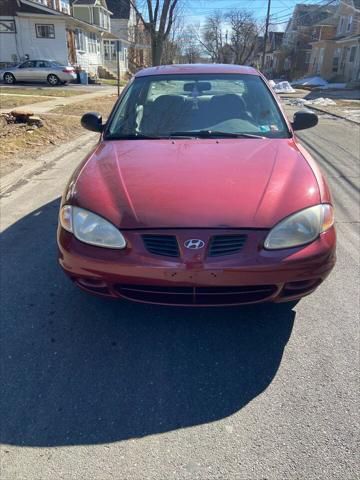
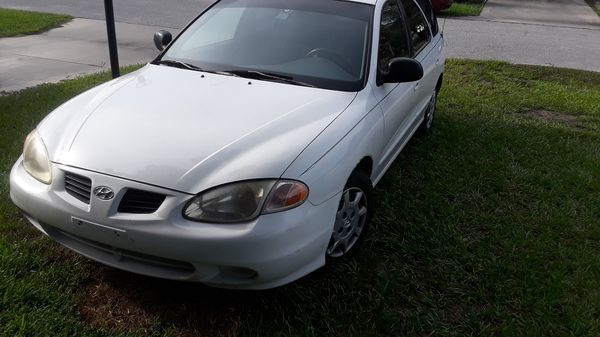
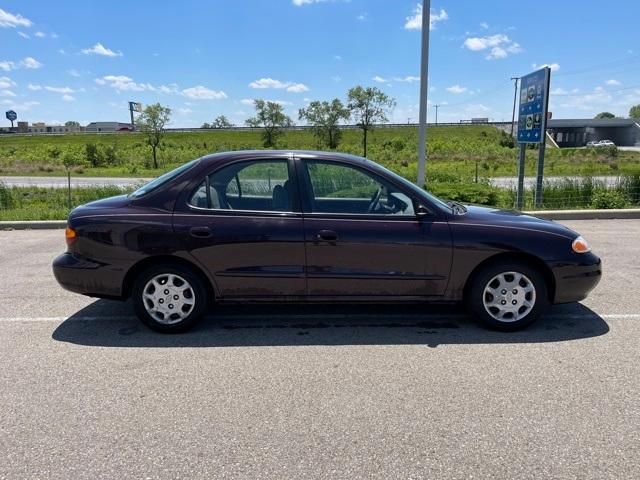
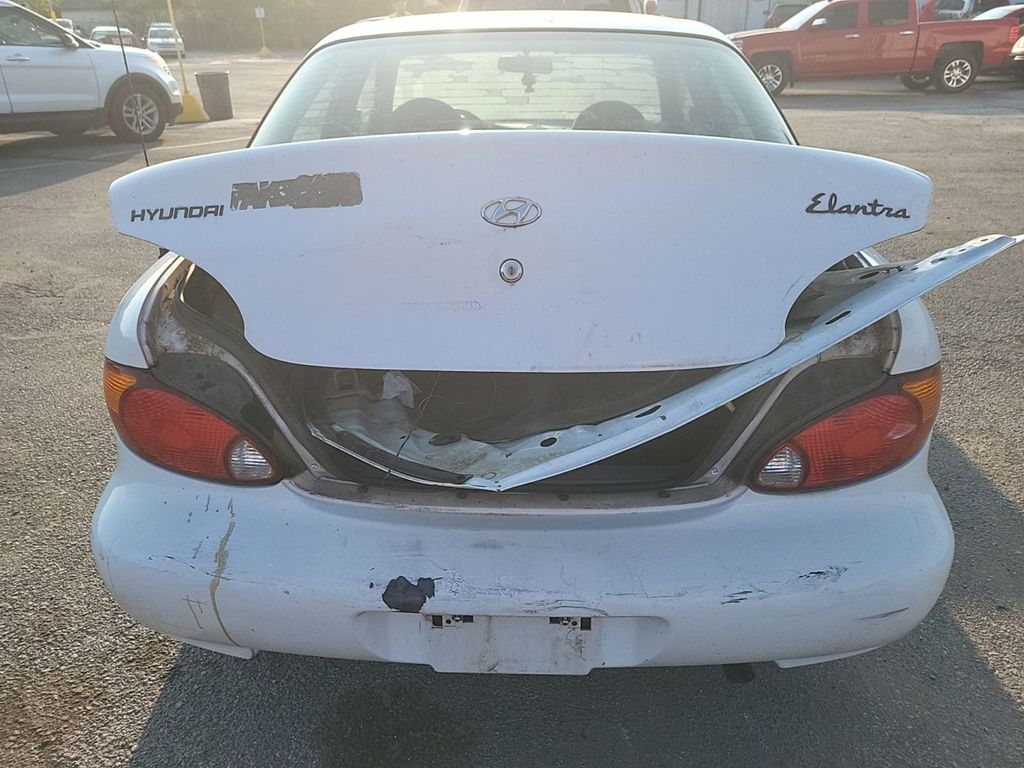
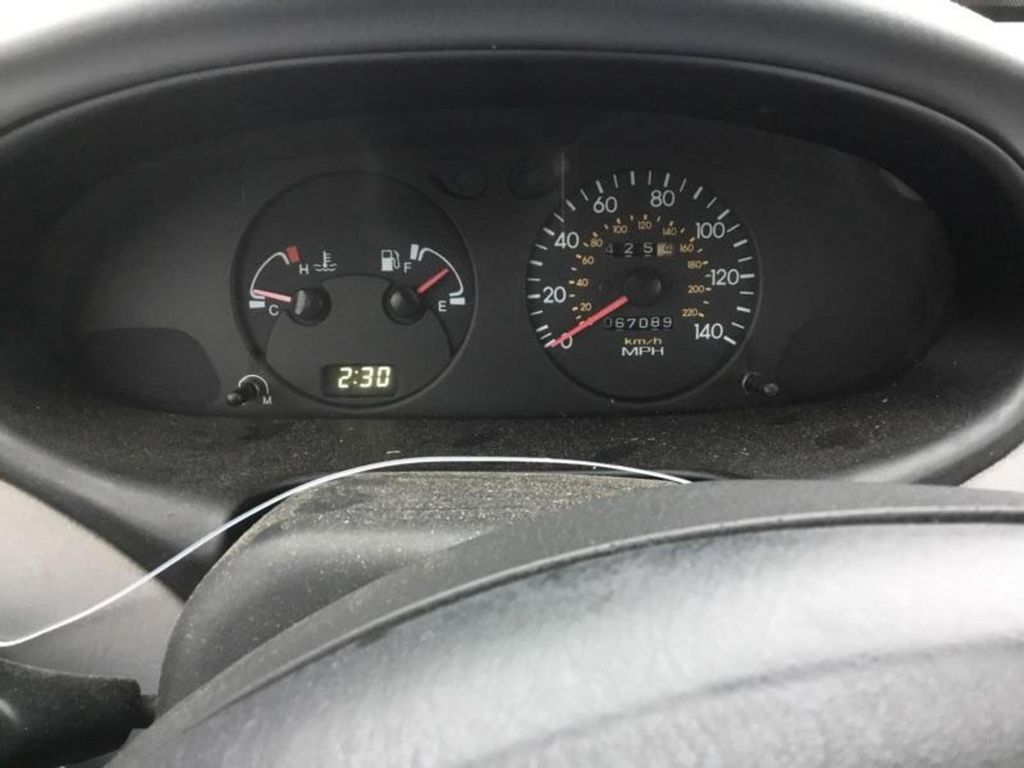
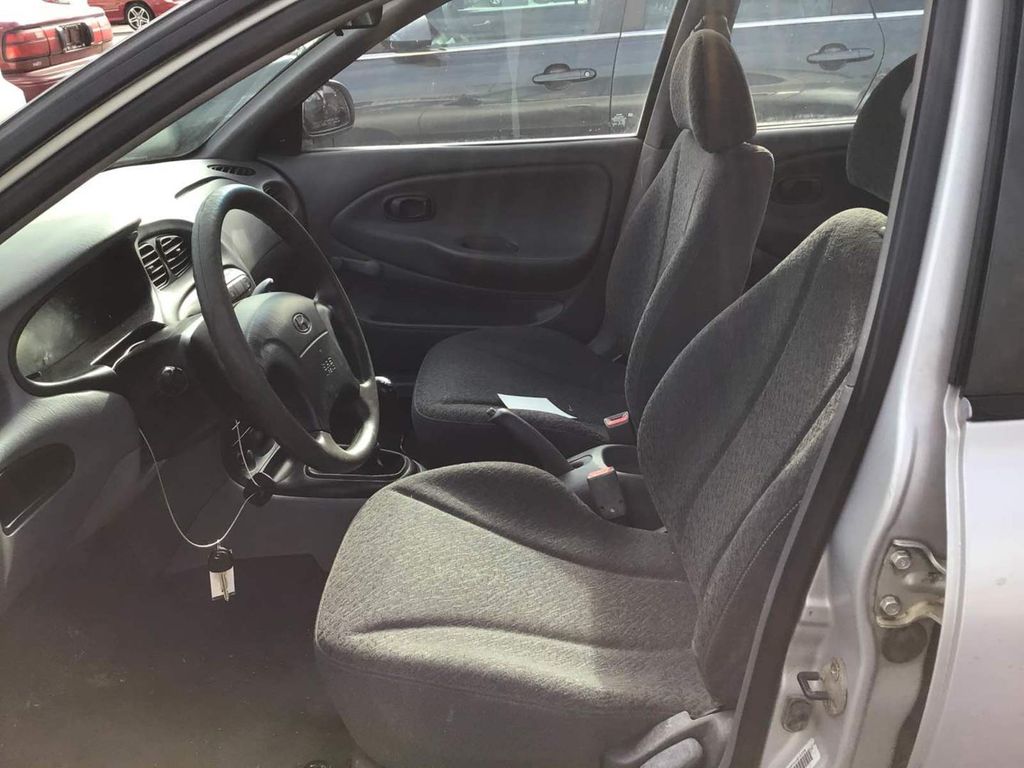
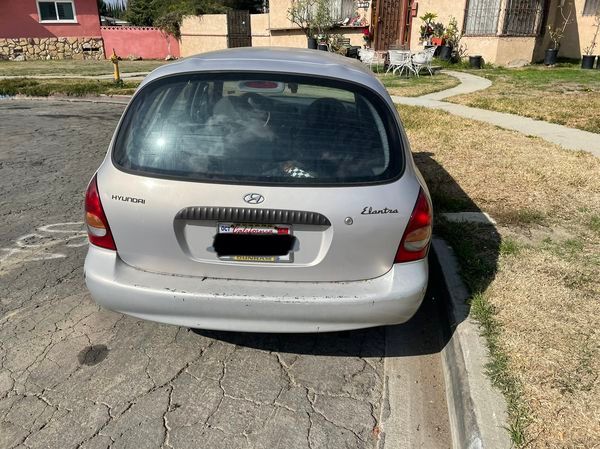
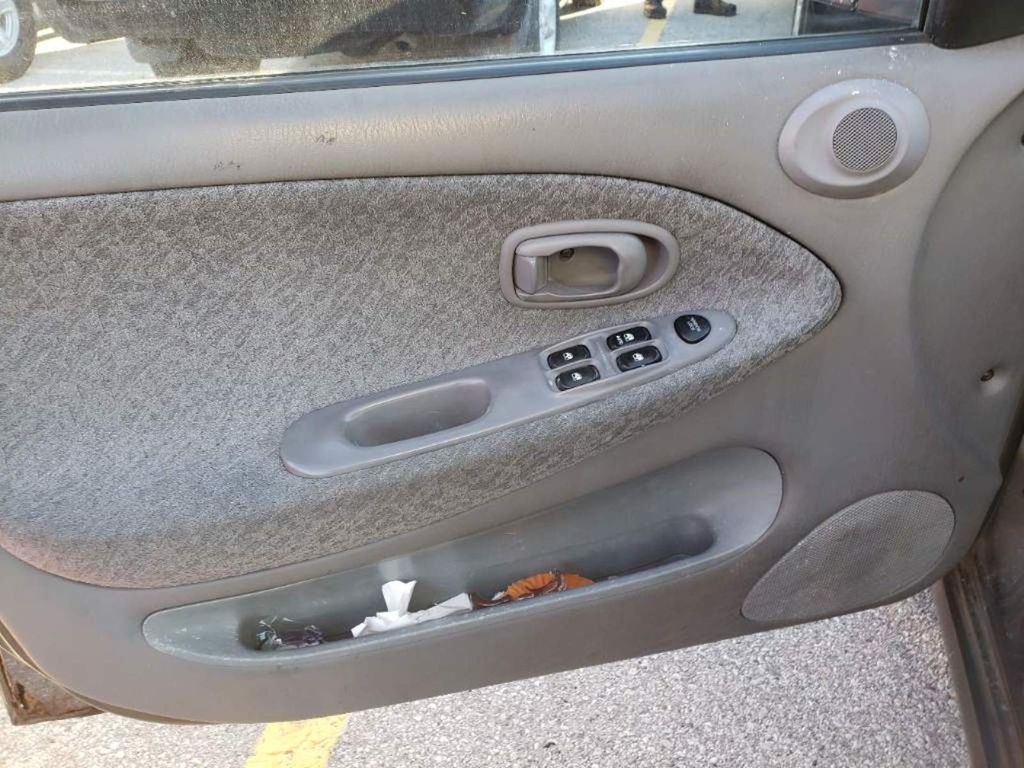
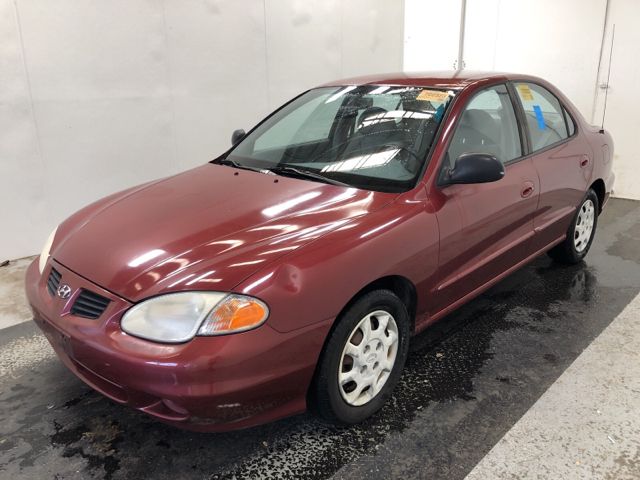
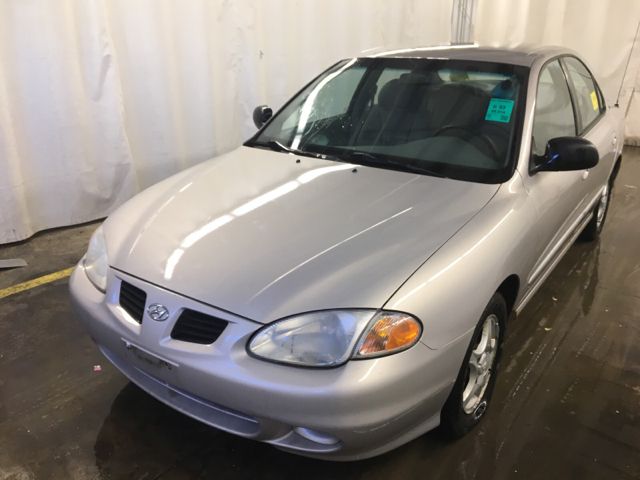
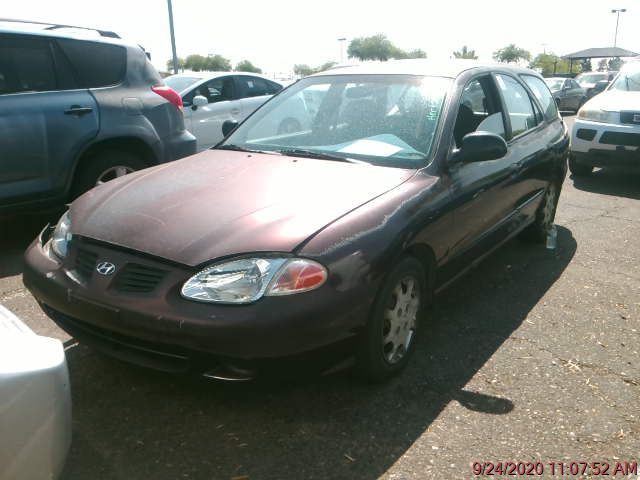
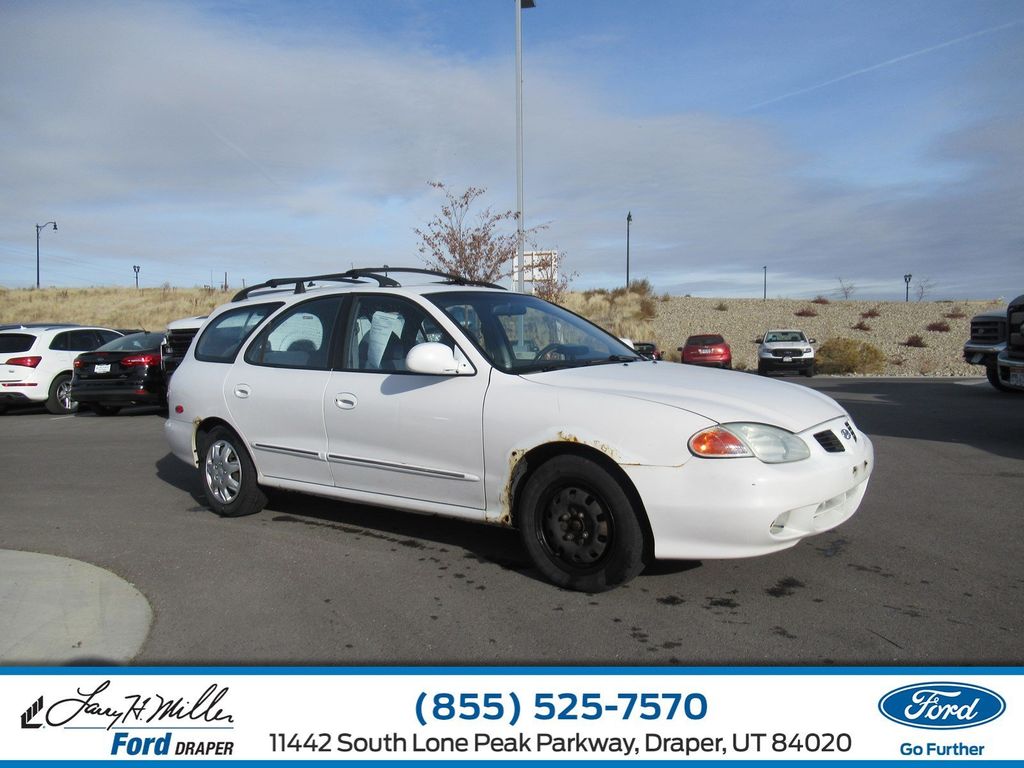
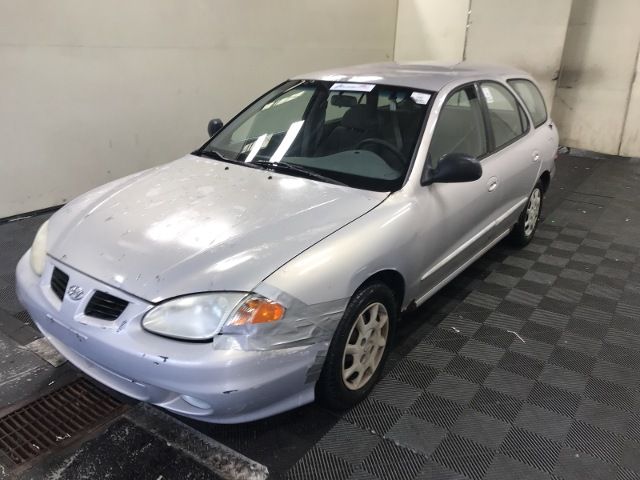
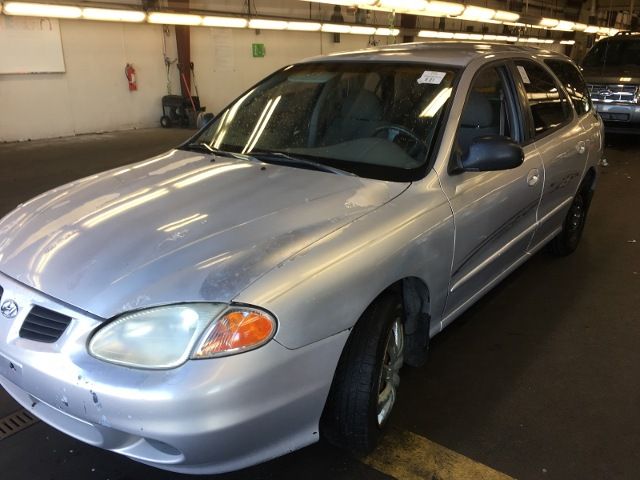
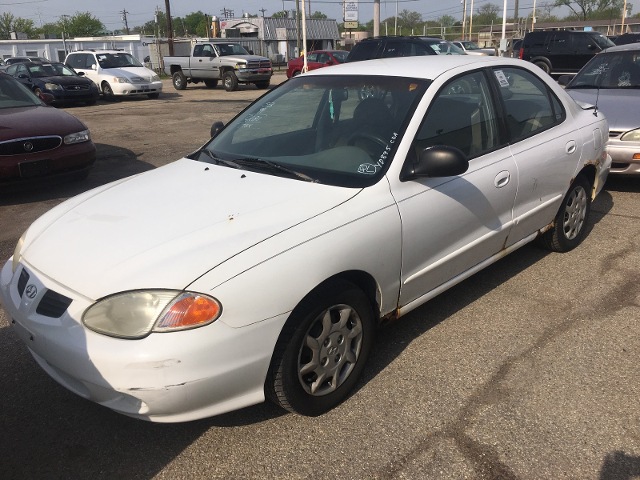
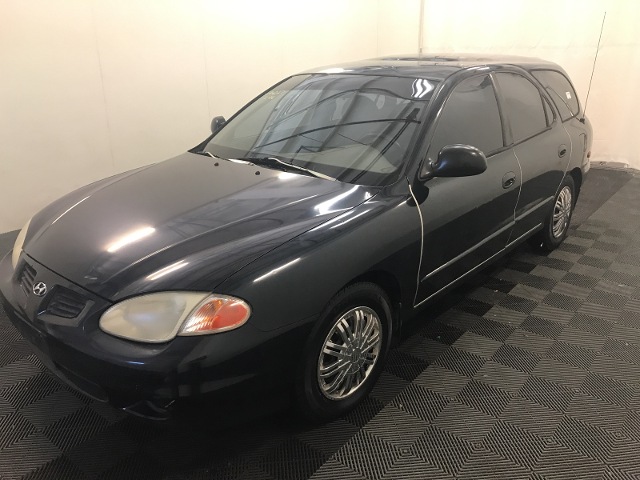
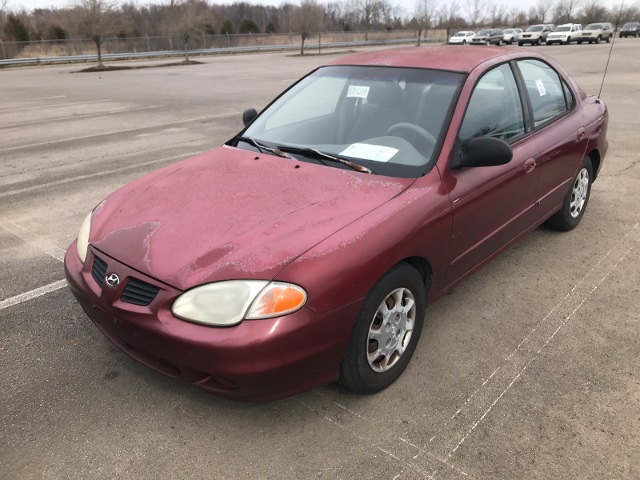
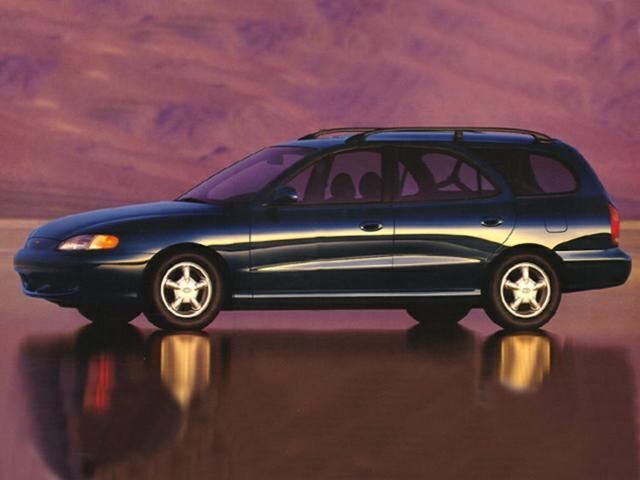
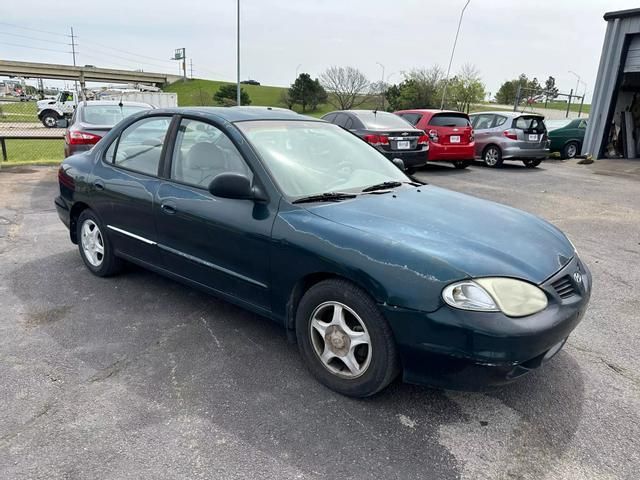
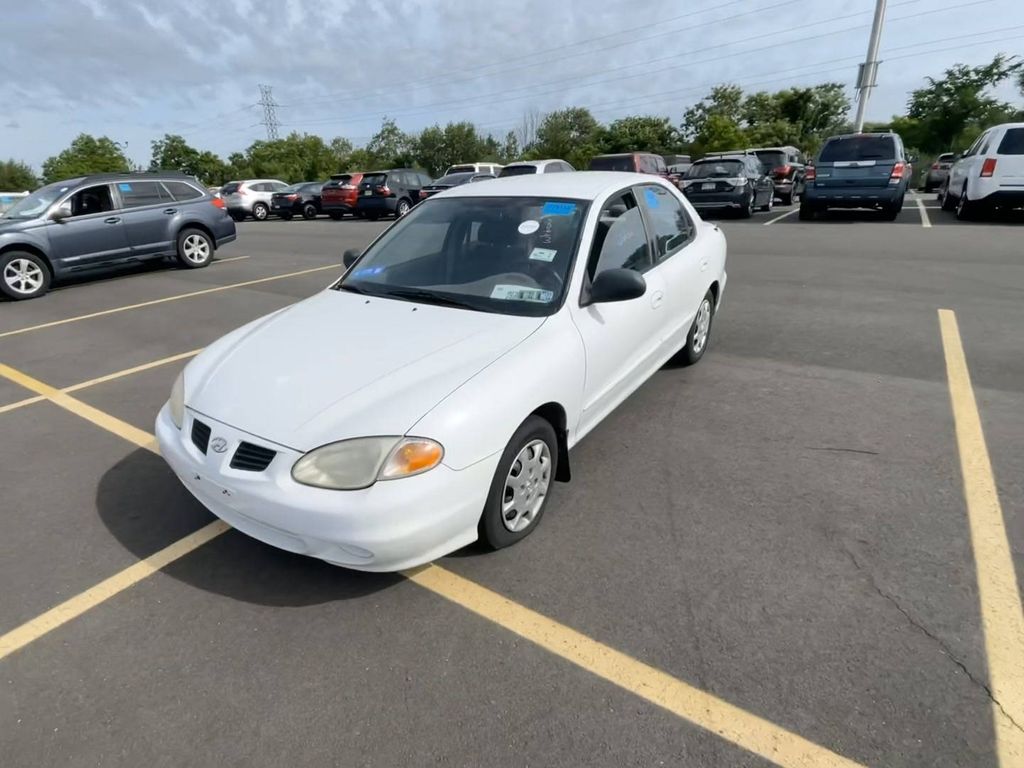
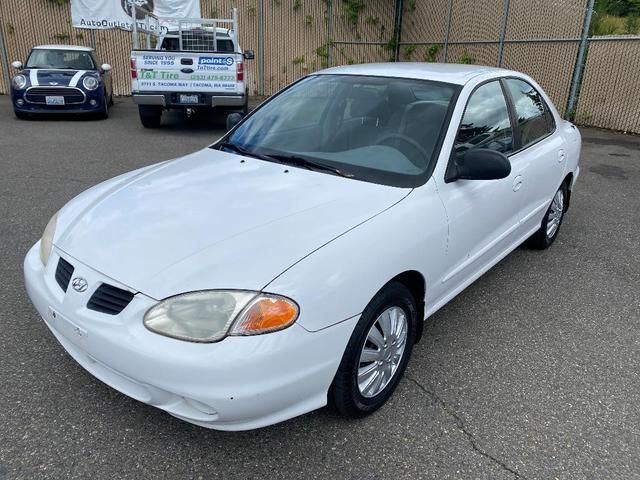
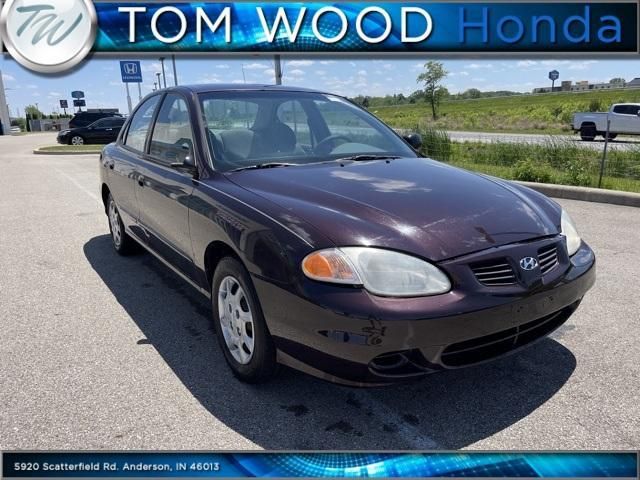
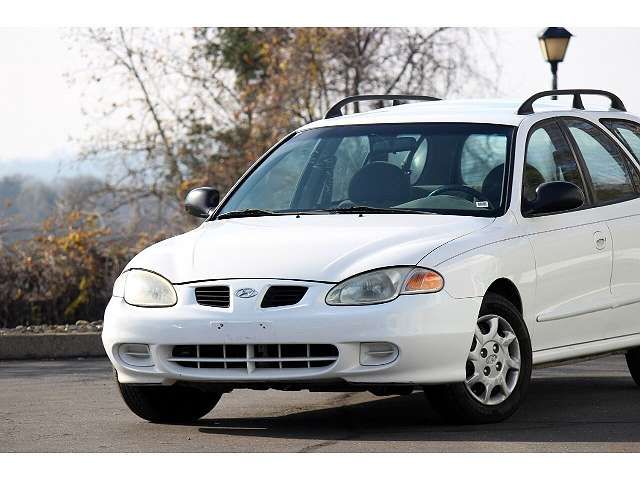
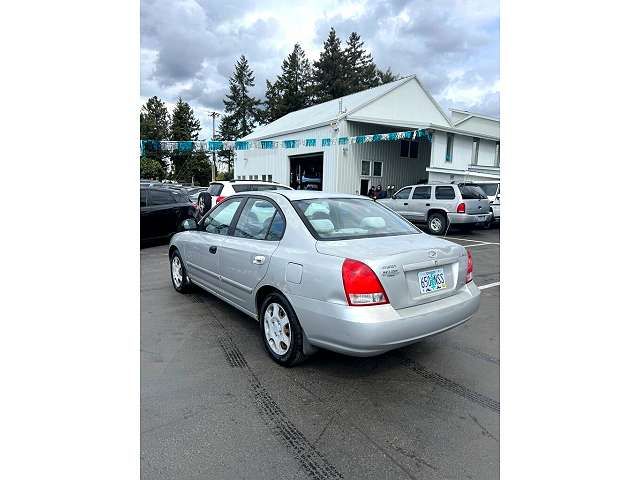
Photos
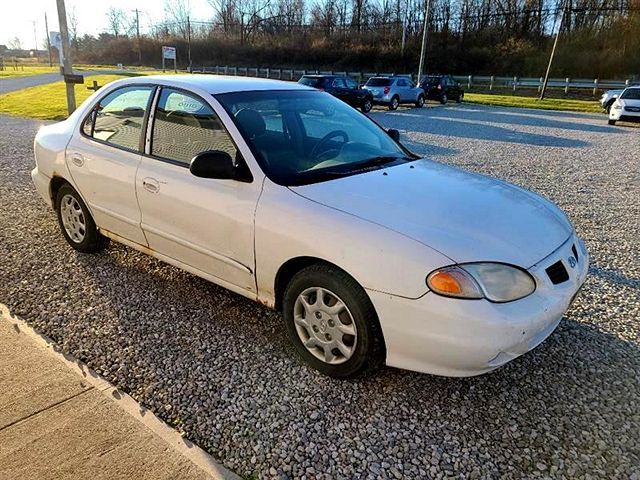
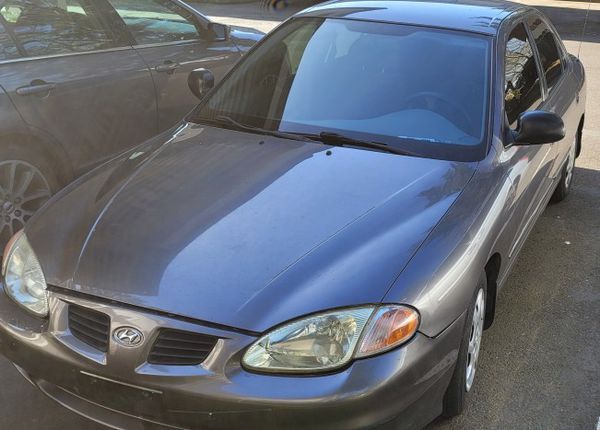
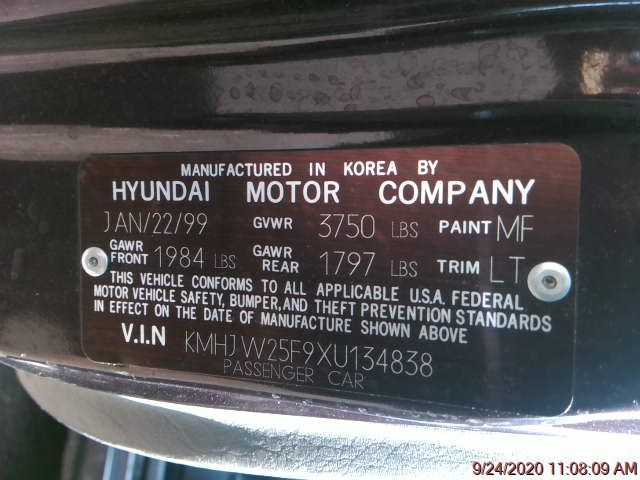
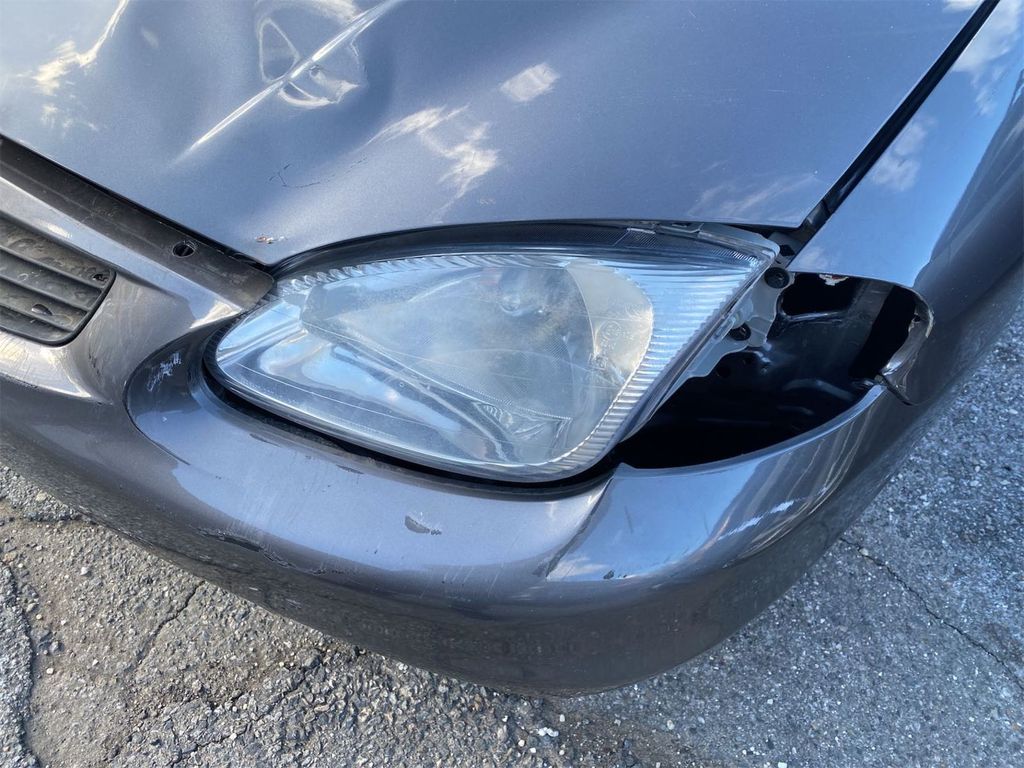
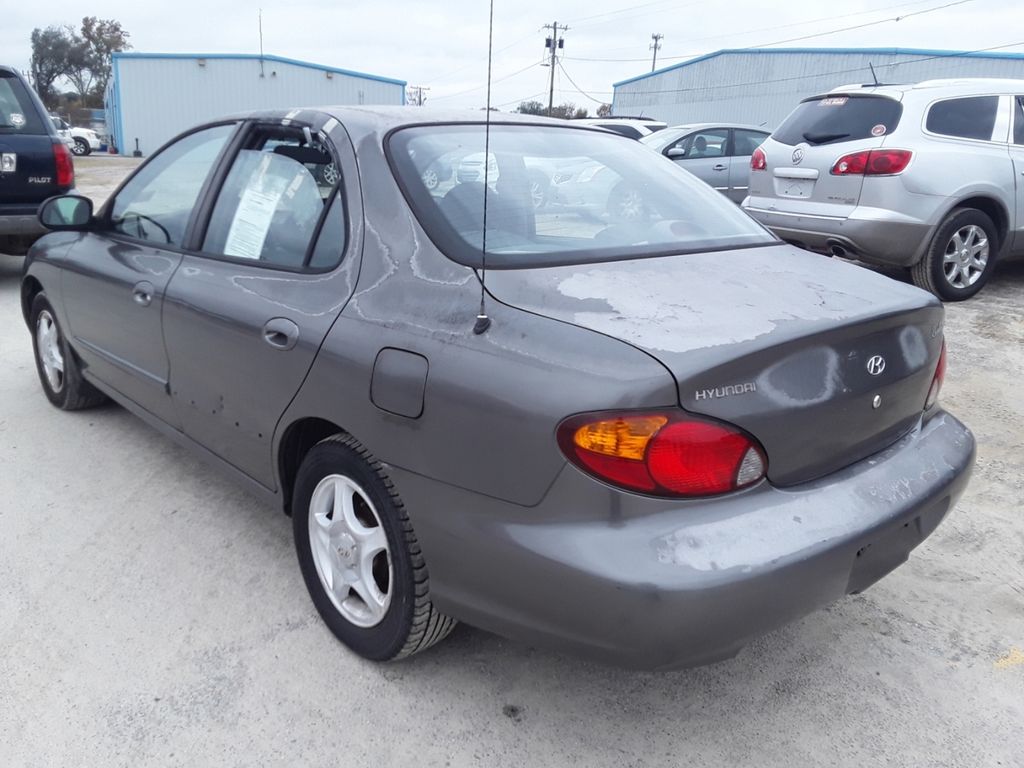
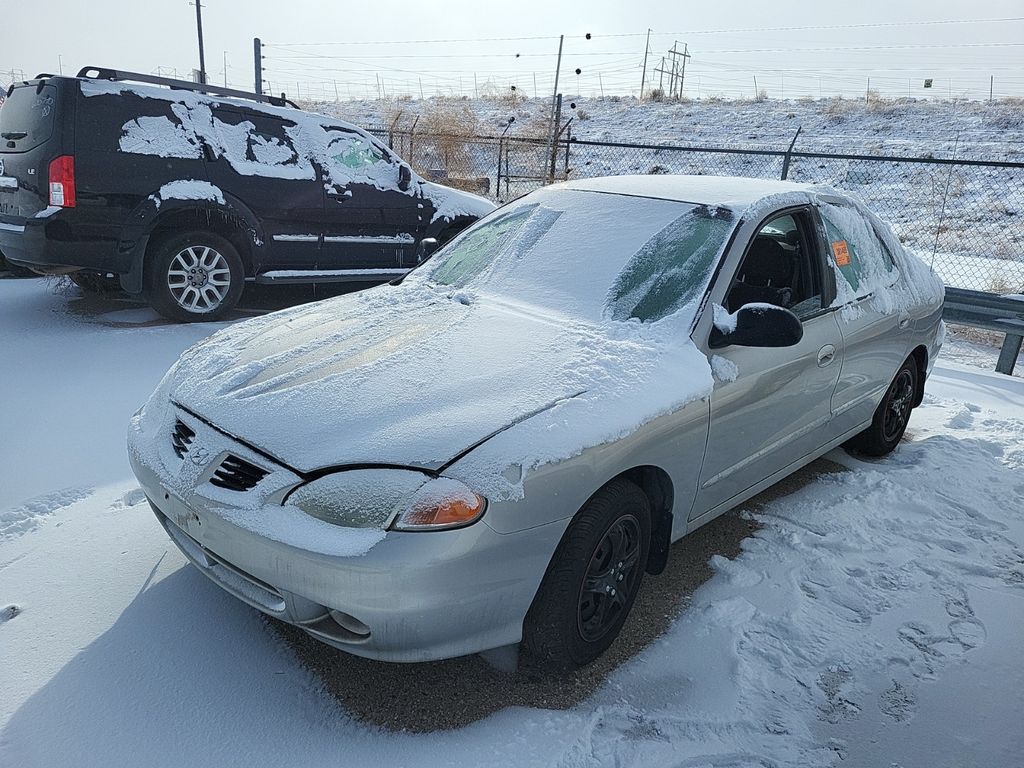
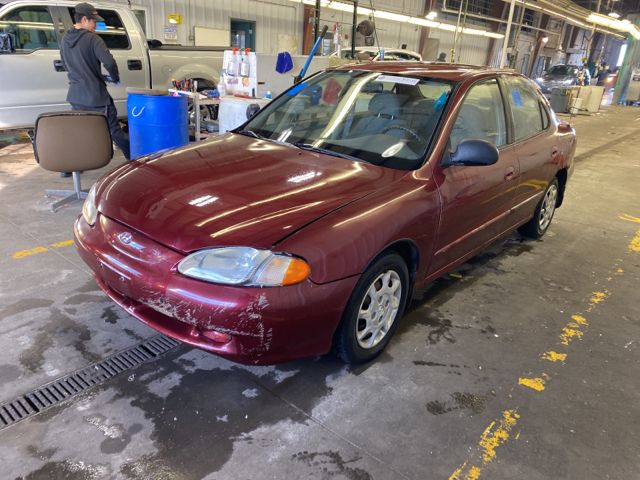
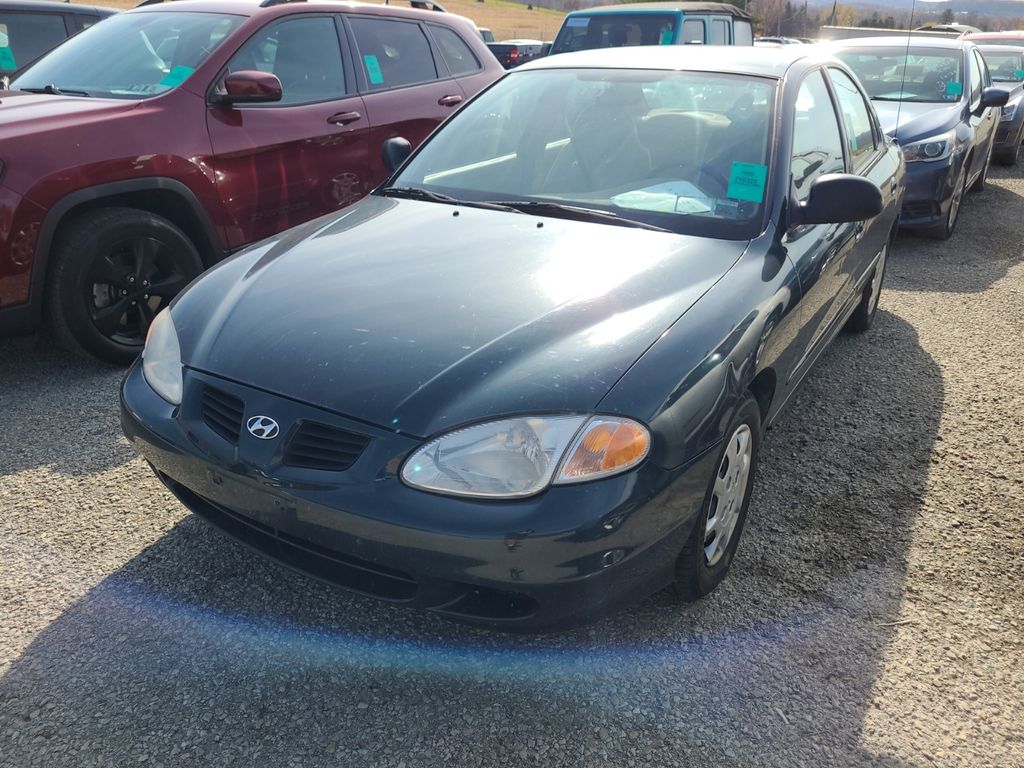
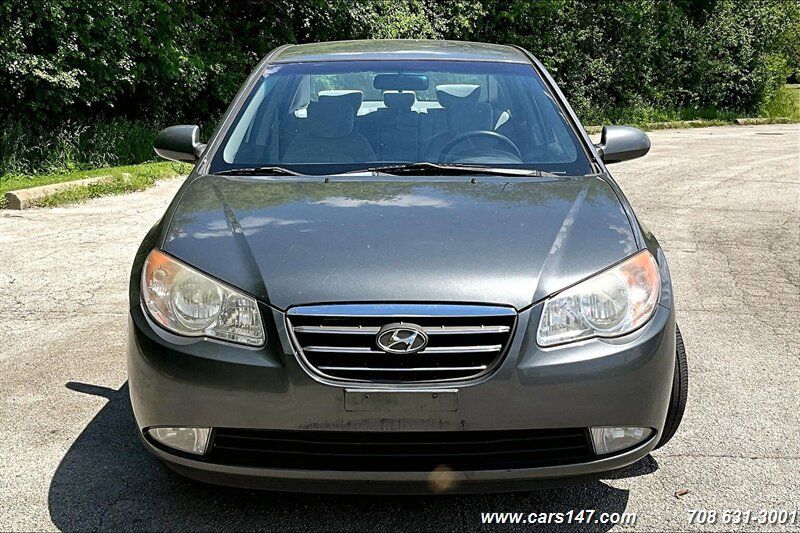
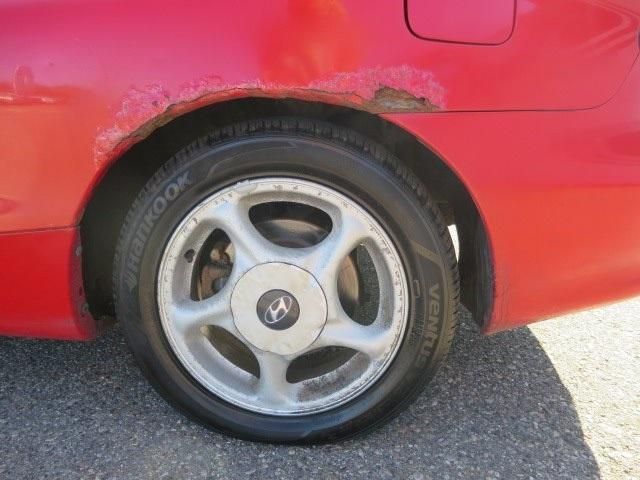
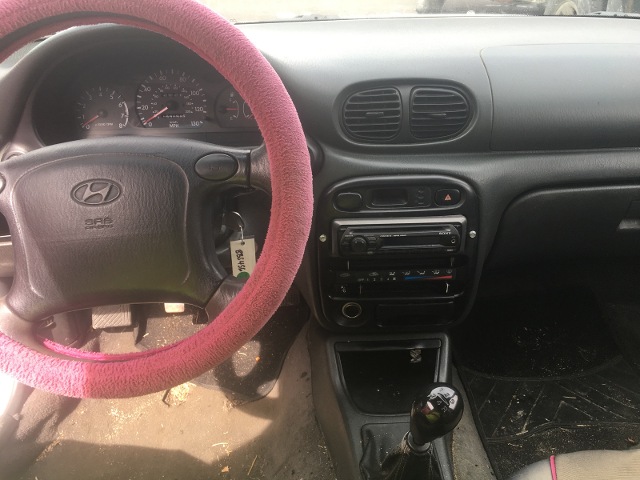
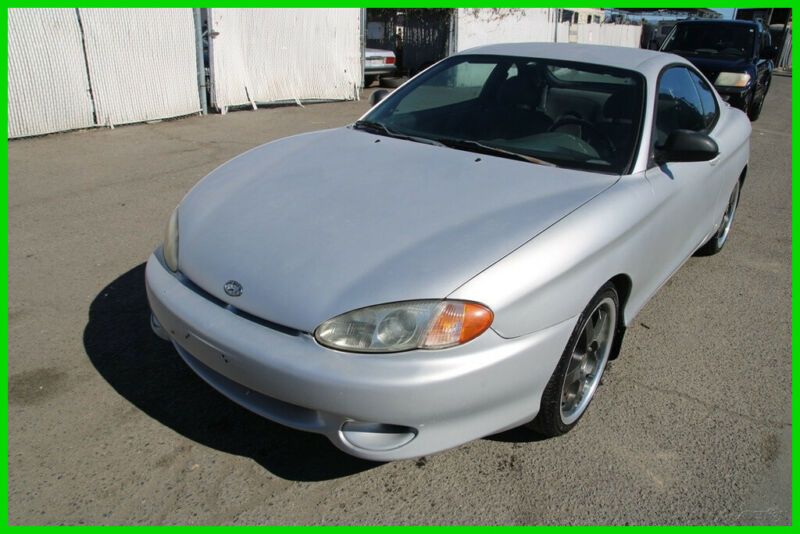
Pictures below are not fancy pictures from manufacturer catalog. It's all photos of real vehicles that were on sale on United States market. You can click on any picture to see specific vehicle and its VIN report.


The graph below is a depreciation curve for 1999 HYUNDAI ELANTRA. It shows how much this model looses per year in price. This analytics is calculated using sales records from BADVIN database.
The table below shows average price for used 1999 HYUNDAI ELANTRA in each year since the year of manufacturing, current year price and projected price in the future years.
You can scroll the table horizontally to see all columns.
| Year | Average Mileage | Average Price | % Left | % Lost | ||
|---|---|---|---|---|---|---|
| 1999 MSRP | 0 mi | $20,800 | — | — | 100% | 0% |
| 1999 | 10,128 mi | $22,990 | −$2,190 | −10.53% | 110.53% | -10.53% |
| 2000 | 20,256 mi | $21,675 | +$1,315 | +5.72% | 104.21% | -4.21% |
| 2001 | 30,384 mi | $19,998 | +$1,677 | +7.74% | 96.14% | 3.86% |
| 2002 | 40,512 mi | $18,987 | +$1,011 | +5.06% | 91.28% | 8.72% |
| 2003 | 50,640 mi | $15,988 | +$2,999 | +15.8% | 76.87% | 23.13% |
| → Visit 1999 HYUNDAI ELANTRA depreciation page to see full data. | ||||||
The graph below shows how mileage affects the price for 1999 HYUNDAI ELANTRA. This data was calculated using sales records from BADVIN database.
The table below shows average price for used 1999 HYUNDAI ELANTRA by mileage and number of sales.
You can scroll the table horizontally to see all columns.
| Mileage | Average Price | Sample Size |
|---|---|---|
| → Visit 1999 HYUNDAI ELANTRA depreciation page to see full data. | ||
Recent sales
BADVIN contain information about more than 100 sold 1999 HYUNDAI ELANTRA on US market. Below you may find some of recent sales with exact mileage and prices.
What's the difference between auctions and classifieds?Dealer and insurance auctions
147,653 mi
sold for $300
CO
a year ago
125,146 mi
sold for $600
IA
2 years ago
121,035 mi
sold for $550
PA
2 years ago
53,851 mi
sold for $1,100
NJ
3 years ago
89,615 mi
sold for $900
IL
4 years ago
101,288 mi
sold for $350
AZ
4 years ago
189,730 mi
sold for $200
UT
5 years ago
159,086 mi
sold for $200
NJ
5 years ago
161,455 mi
sold for $150
ID
5 years ago
173,720 mi
sold for $550
OH
5 years ago
82,635 mi
sold for $600
NV
5 years ago
344,705 mi
sold for $400
TN
5 years ago
Classifieds
93,766 mi
listed for $2,855
CT
4 months ago
listed for $2,500
OK
a year ago
99,946 mi
listed for $3,195
NJ
2 years ago
71,500 mi
listed for $2,938
WA
2 years ago
71,500 mi
listed for $2,938
WA
2 years ago
99,946 mi
listed for $3,195
NJ
2 years ago
191,196 mi
listed for $2,995
IN
2 years ago
191,196 mi
listed for $2,995
IN
2 years ago
101,022 mi
listed for $4,975
CA
2 years ago
101,022 mi
listed for $4,975
CA
3 years ago

260,001 mi
listed for $2,995
IN
3 years ago
260,001 mi
listed for $2,995
IN
3 years ago
Features and options
We've collected all possible options and features that you may find in sales listings for 1999 HYUNDAI ELANTRA and organized it in two lists.
- 5 PASSENGER
- ADJUSTABLE STEERING WHEEL
- AIR BAG
- AIR CONDITIONING
- AIRBAG FRONT LEFT
- AIRBAG FRONT RIGHT
- AM/FM
- AM/FM/CD
- AM\FM\CASSETTE
- CLOTH SEATS
- DUAL AIR BAGS
- HARD TOP
- POWER LOCKS
- POWER MIRRORS
- POWER STEERING
- POWER WINDOWS
- REAR DEFOGGER
- SEAT NONE
- SEAT TYPE - BUCKET
- TILT WHEEL
- WARRANTY BOOK
Other years of HYUNDAI ELANTRA
2002 HYUNDAI ELANTRA
$3,277 average used price
1,200+ sales records
2008 HYUNDAI ELANTRA
$5,376 average used price
8,300+ sales records

2010 HYUNDAI ELANTRA
$5,995 average used price
20,900+ sales records

2017 HYUNDAI ELANTRA
$12,305 average used price
203,800+ sales records

2021 HYUNDAI ELANTRA
$18,987 average used price
69,400+ sales records

2024 HYUNDAI ELANTRA
$22,990 average used price
9,300+ sales records
Similar Models
1997 HYUNDAI TIBURON
$8,790 MSRP
20+ sales records
1998 HYUNDAI ACCENT
$17,215 MSRP
30+ sales records

1999 HYUNDAI SONATA
$25,559 MSRP
60+ sales records
1999 HYUNDAI TIBURON
$8,790 MSRP
20+ sales records

2000 HYUNDAI SONATA
$25,559 MSRP
130+ sales records

2002 HYUNDAI XG
$8,900 MSRP
$4,495 average used price
260+ sales records
Frequently asked questions
A VIN decoder can confirm the safety features originally installed in a vehicle, such as airbags, ABS, and stability control systems.
The window sticker is particularly important for electric and hybrid vehicle vehicles as it provides detailed information on battery range, charging times, and energy consumption.
The best time of year to sell your car to minimize depreciation might be just before the release of a new model, when demand for used models could be higher.
Significant damage from flood, fire, or hail may severely affect a vehicle vehicle's structure and mechanics, potentially resulting in a salvage title, depending on the extent of damage reported.
Aftermarket modifications can affect the depreciation of vehicle either positively, by enhancing appeal to certain buyers, or negatively, by deterring those who prefer stock condition.
These records, if available, detail instances of major damage and subsequent dispositions, essential for evaluating the past treatment and current state of the vehicle.
Safety Recalls
With over 738,000 Hyundais sold annually in the U.S., up to 25% may have unaddressed safety recalls. A VIN check reveals any open recalls.
Accident History
Decoding the VIN uncovers any previous accident damage, flood damage, or other issues that could affect the safety and value of a used Hyundai.
Warranty Coverage
A VIN check confirms the original warranty details and remaining coverage, which is crucial for Hyundais known for their long warranties.


