
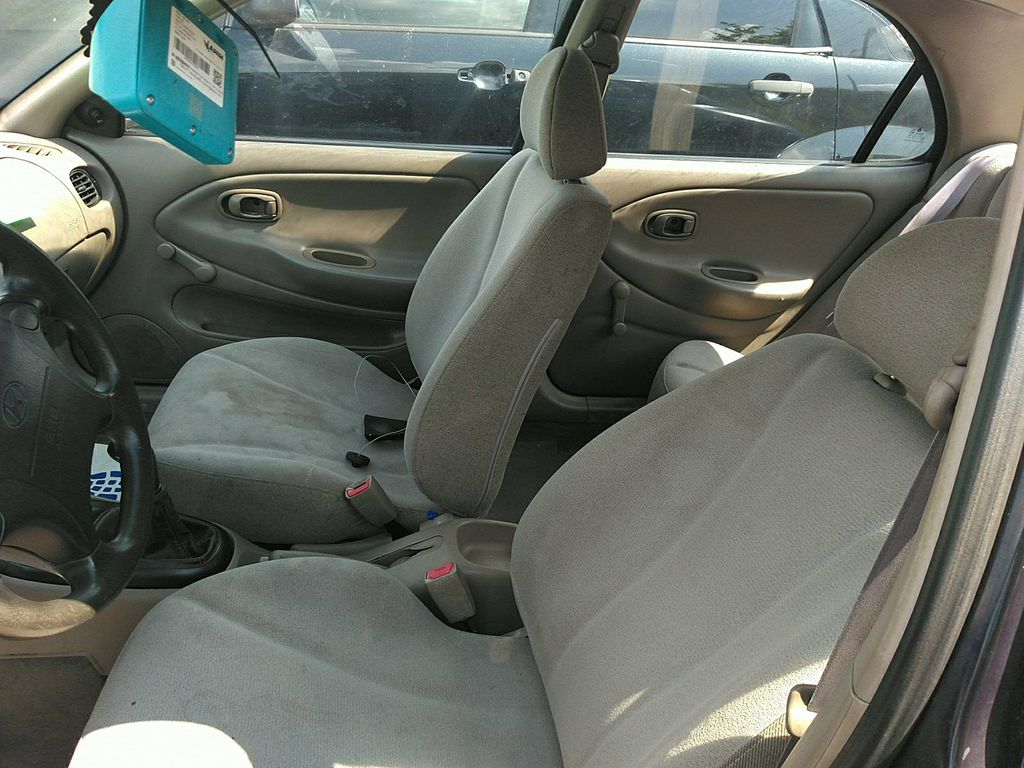
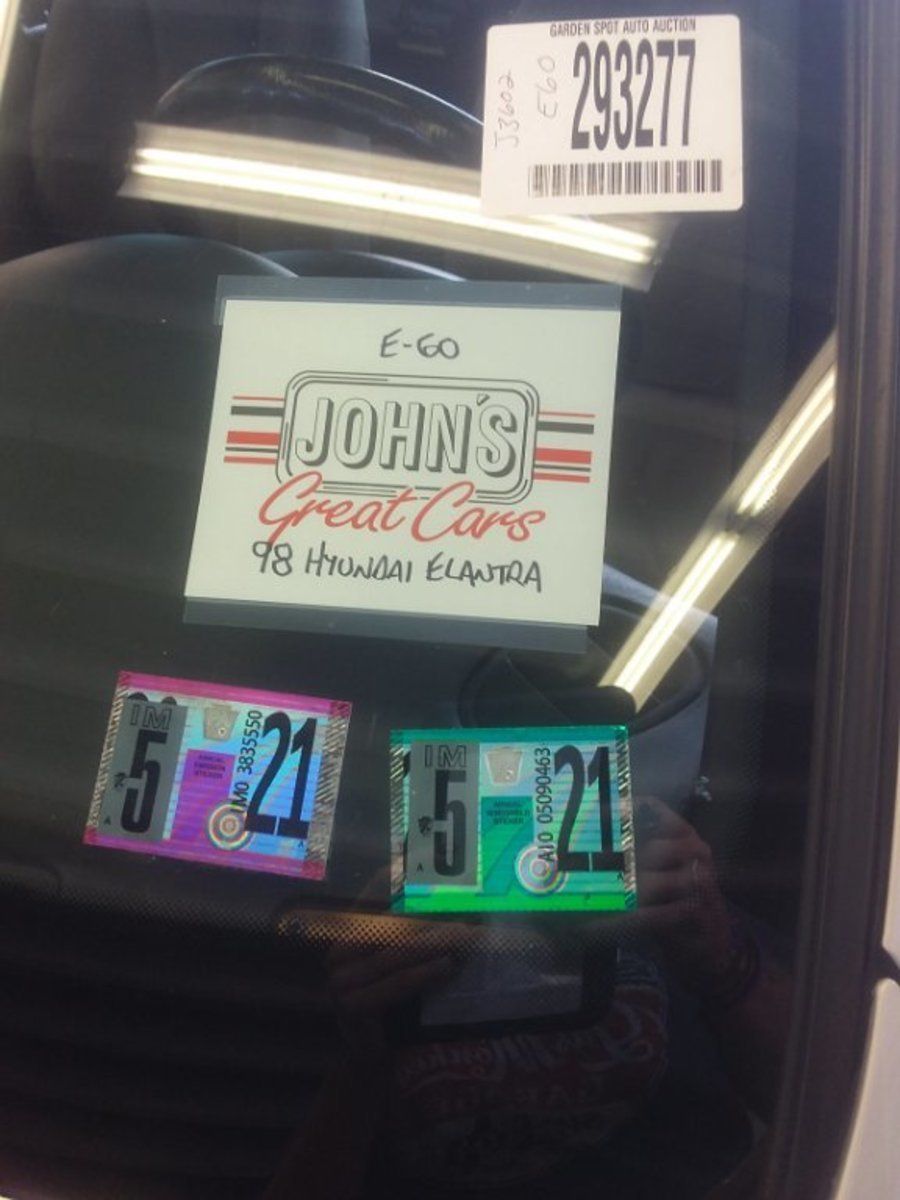
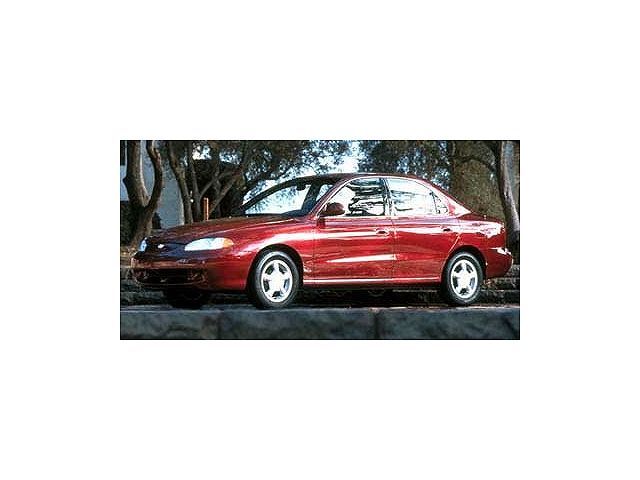
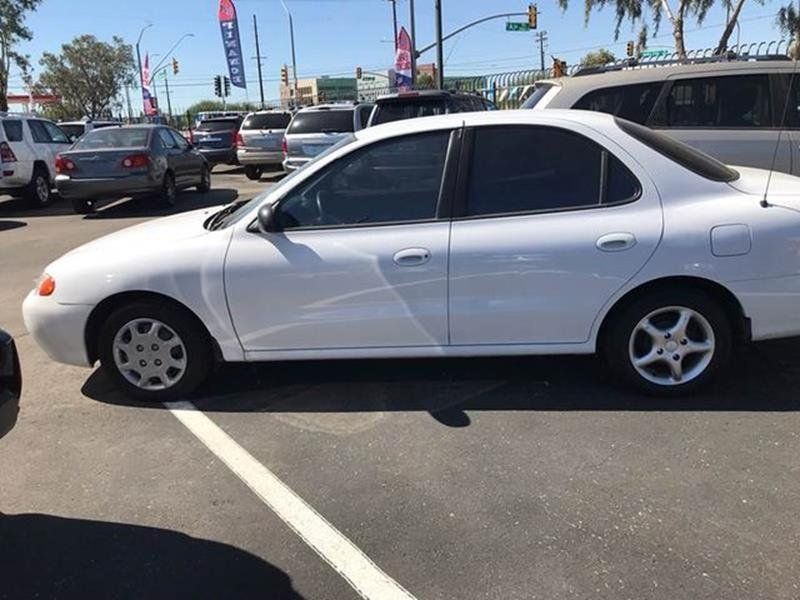
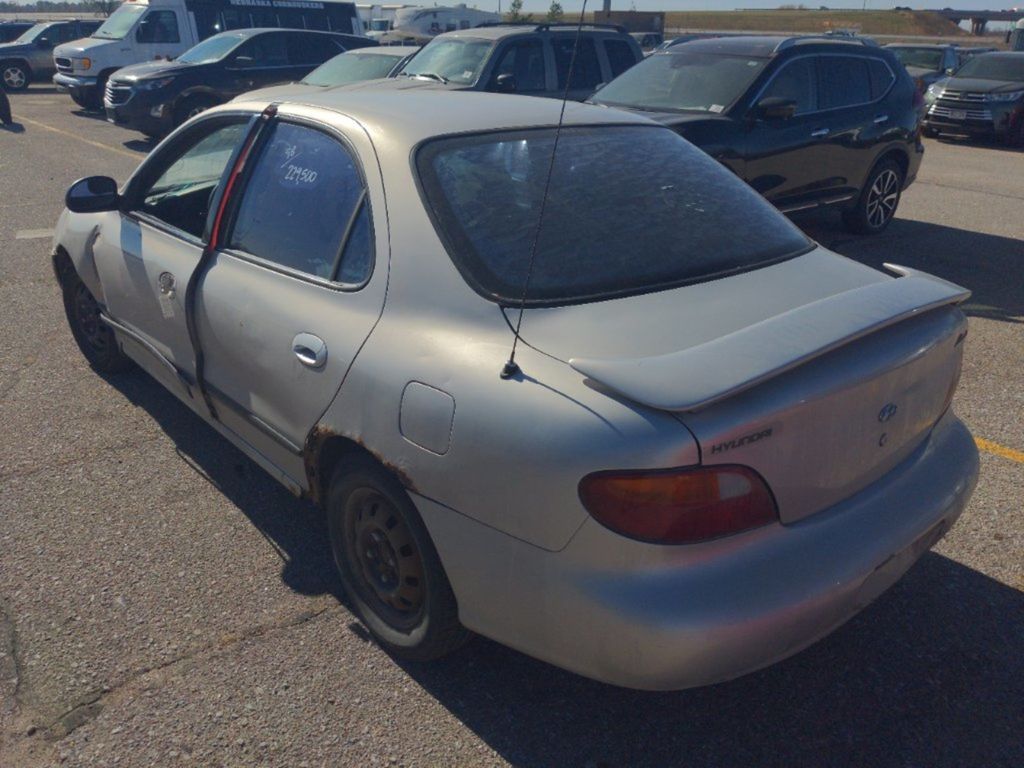
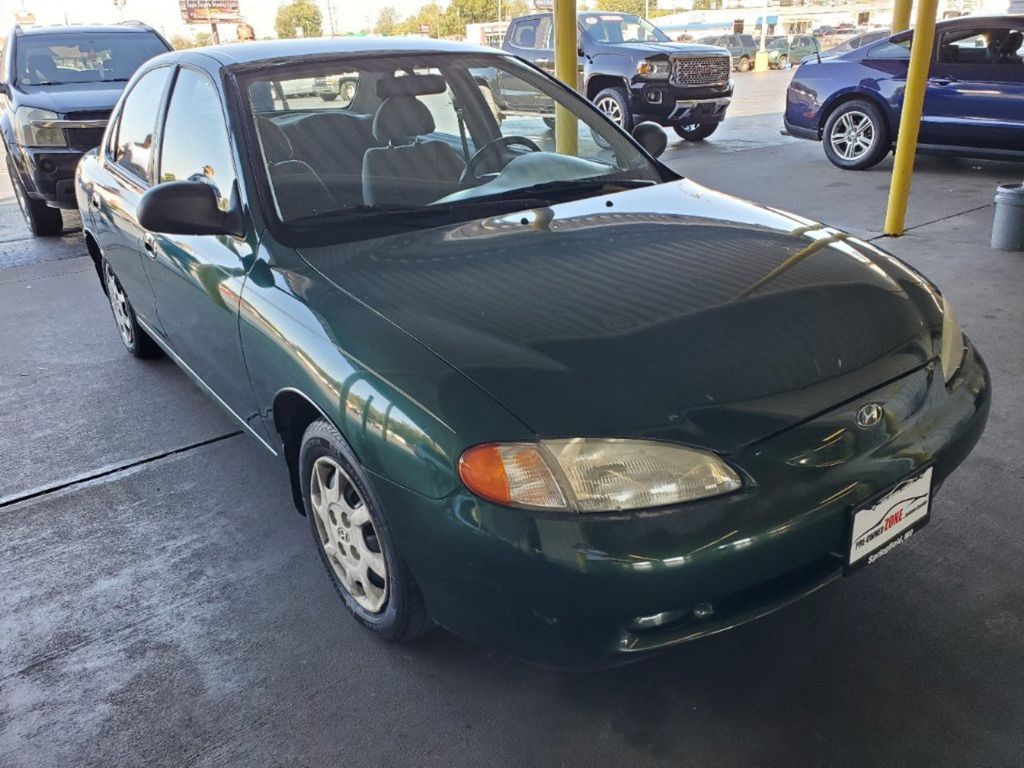
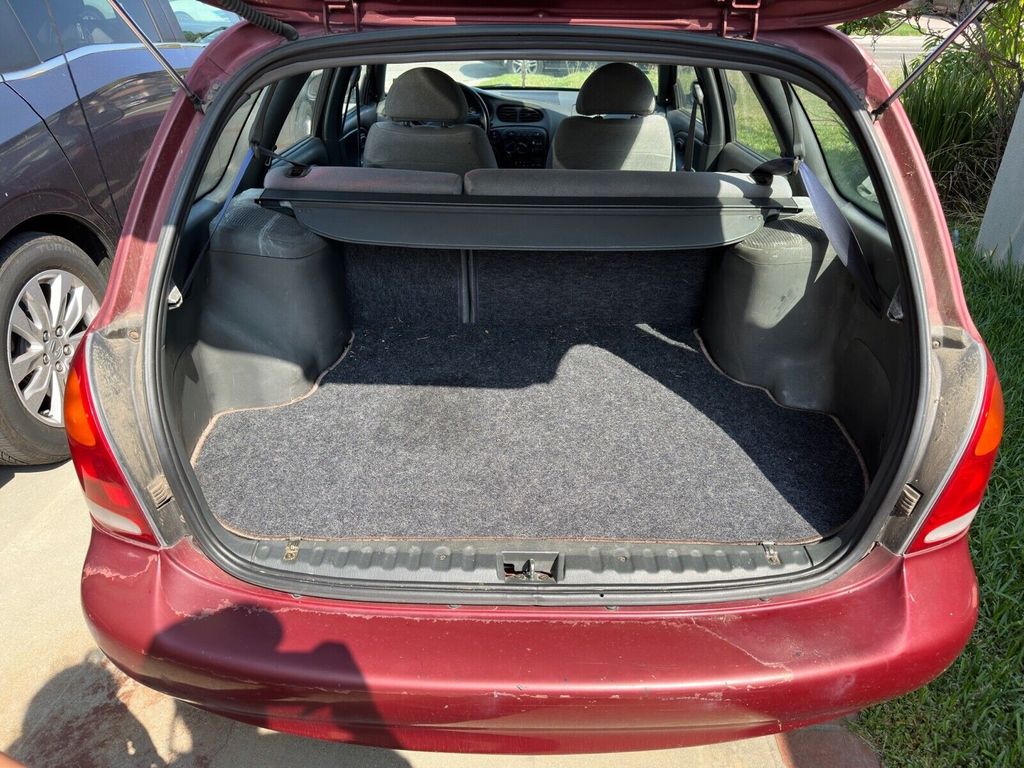
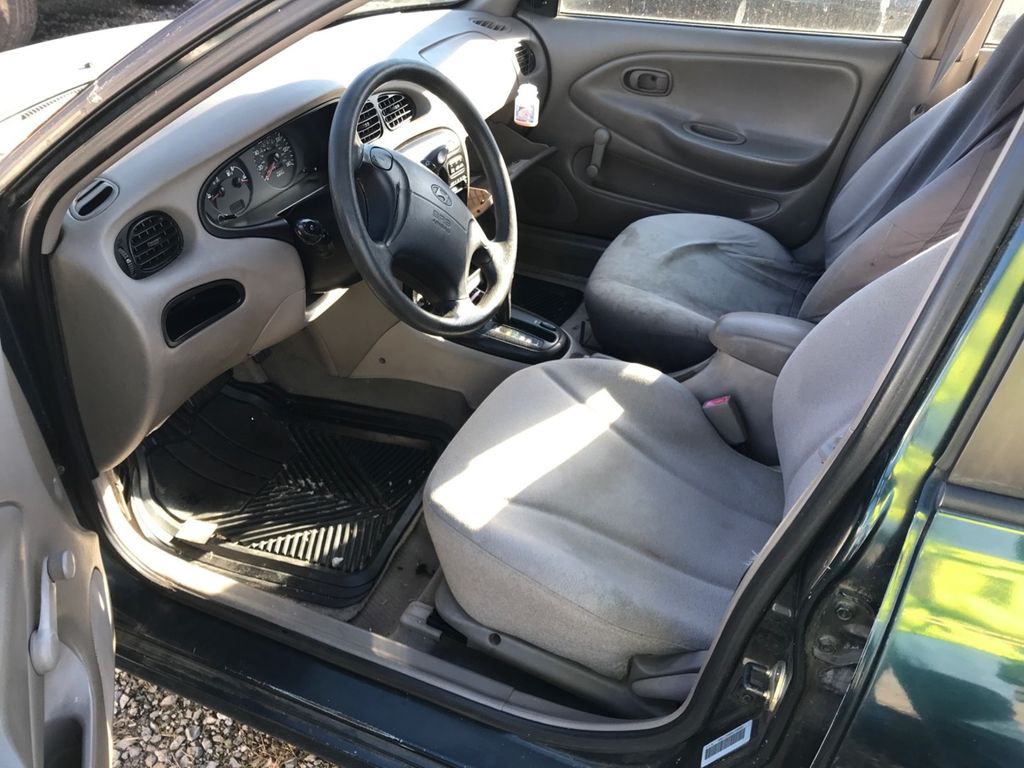
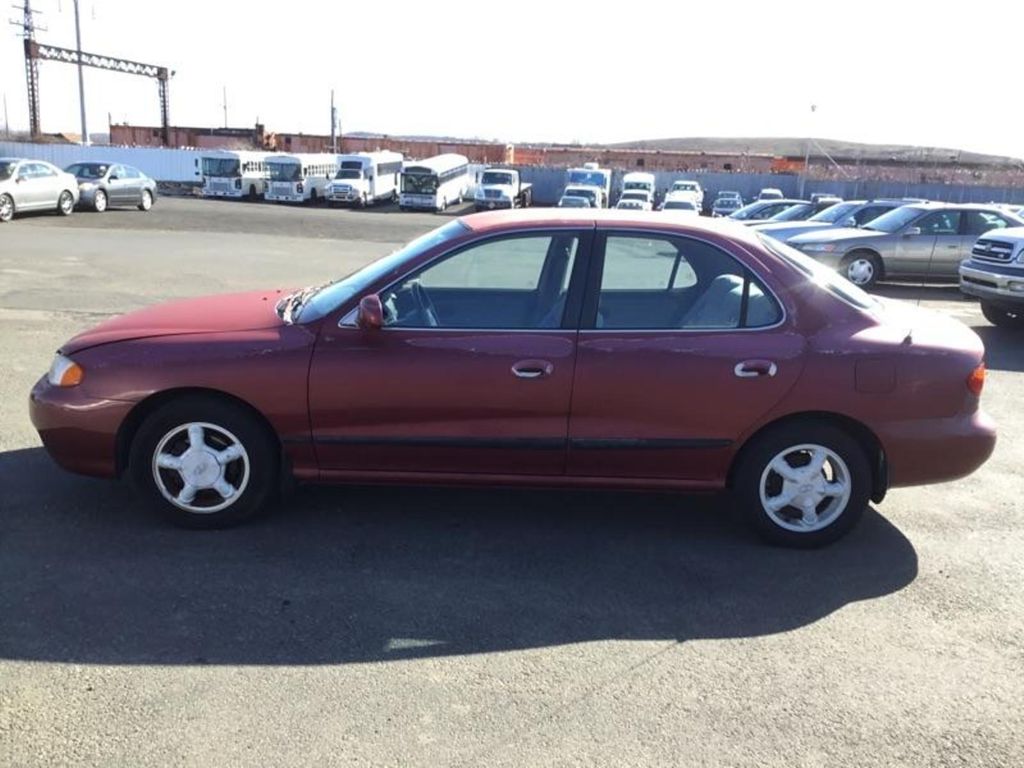
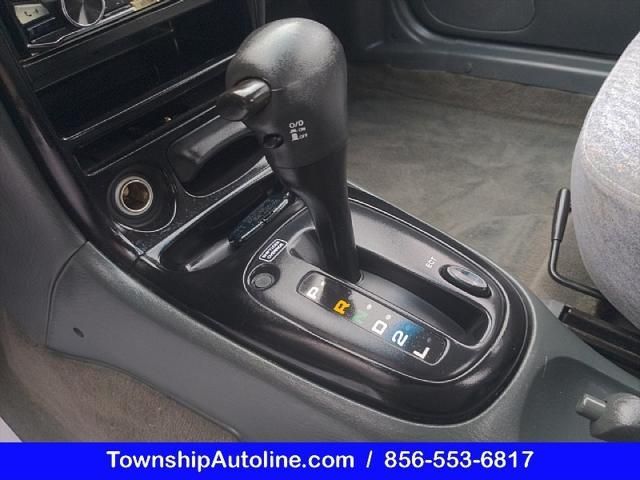
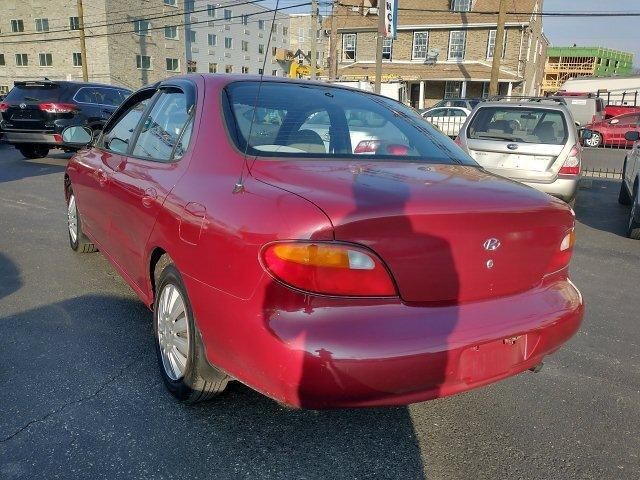
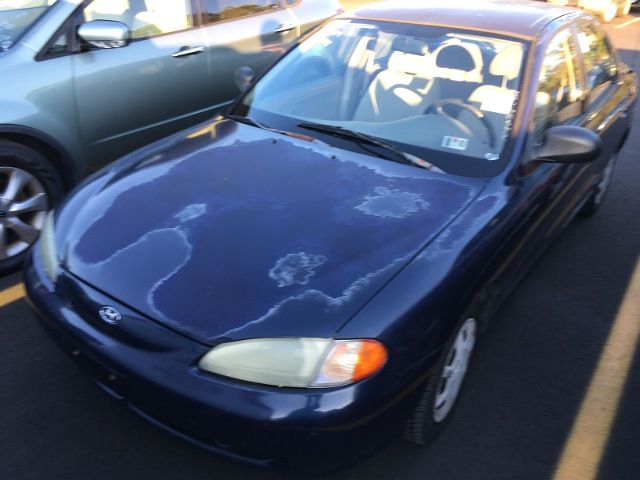
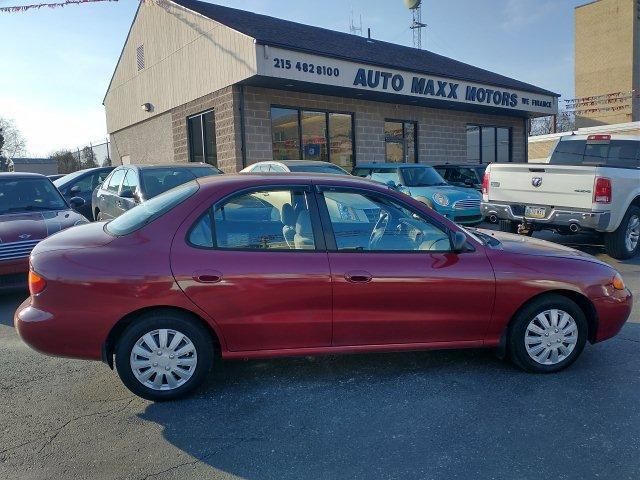
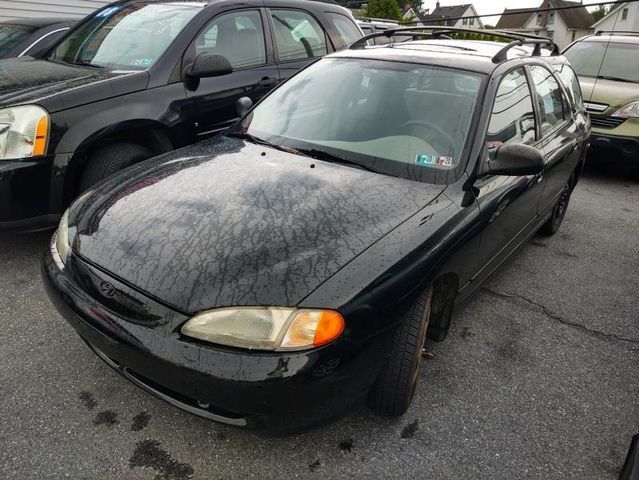
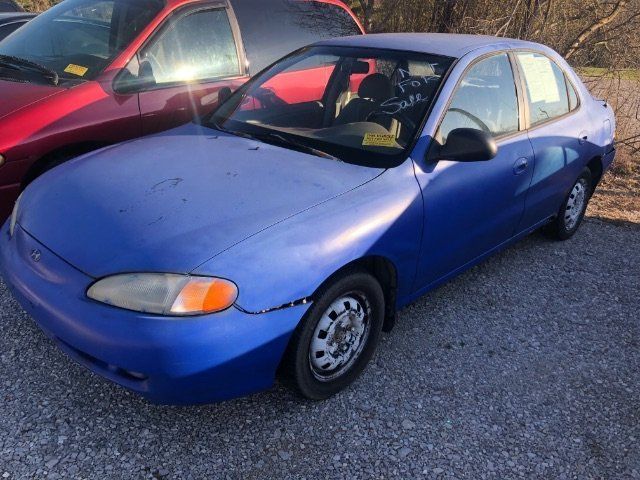
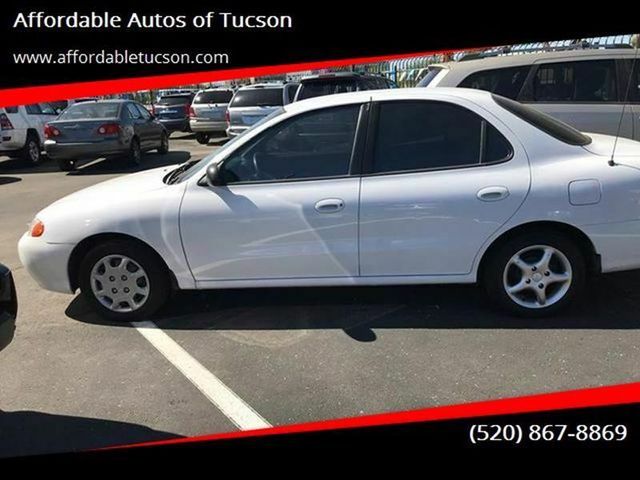
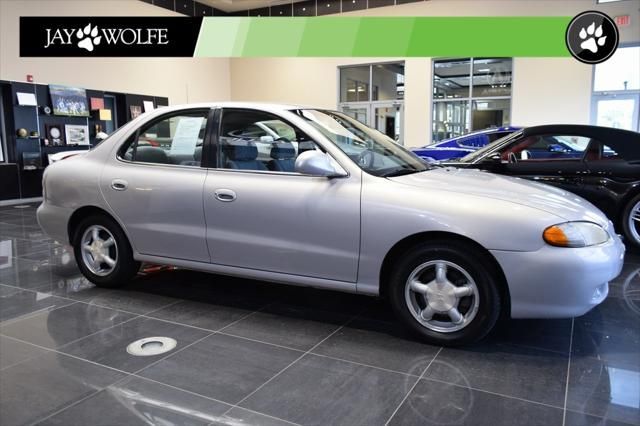
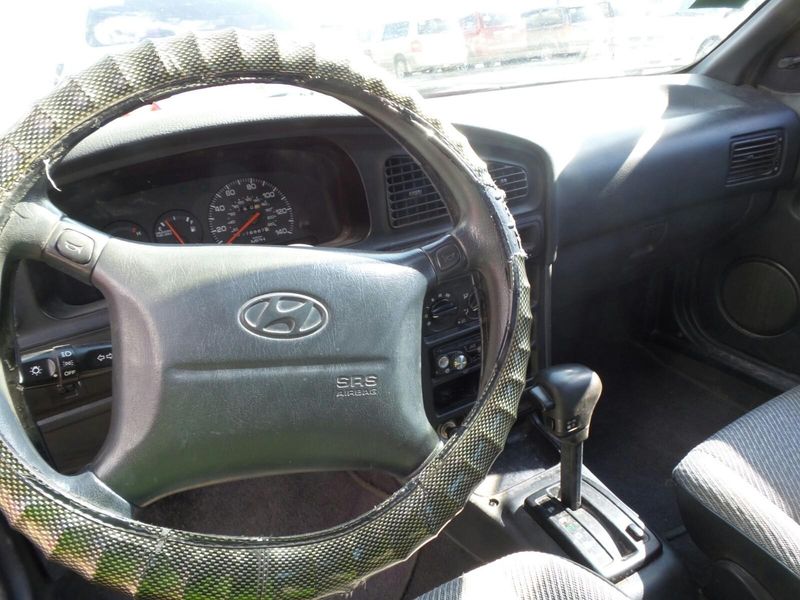
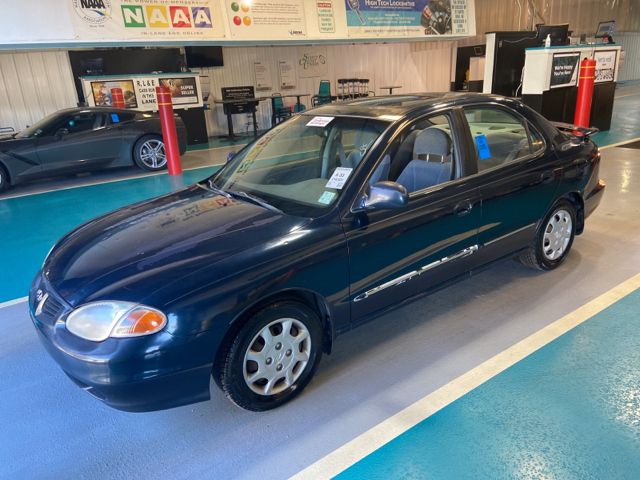
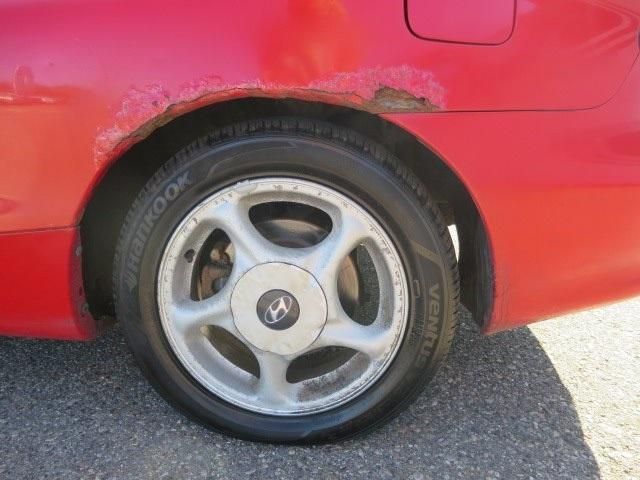
Photos
Pictures below are not fancy pictures from manufacturer catalog. It's all photos of real vehicles that were on sale on United States market. You can click on any picture to see specific vehicle and its VIN report.


The graph below is a depreciation curve for 1998 HYUNDAI ELANTRA. It shows how much this model looses per year in price. This analytics is calculated using sales records from BADVIN database.
The table below shows average price for used 1998 HYUNDAI ELANTRA in each year since the year of manufacturing, current year price and projected price in the future years.
You can scroll the table horizontally to see all columns.
| Year | Average Mileage | Average Price | % Left | % Lost | ||
|---|---|---|---|---|---|---|
| 1998 MSRP | 0 mi | $20,800 | — | — | 100% | 0% |
| 1998 | 10,128 mi | $22,990 | −$2,190 | −10.53% | 110.53% | -10.53% |
| 1999 | 20,256 mi | $21,675 | +$1,315 | +5.72% | 104.21% | -4.21% |
| 2000 | 30,384 mi | $19,998 | +$1,677 | +7.74% | 96.14% | 3.86% |
| 2001 | 40,512 mi | $18,987 | +$1,011 | +5.06% | 91.28% | 8.72% |
| 2002 | 50,640 mi | $15,988 | +$2,999 | +15.8% | 76.87% | 23.13% |
| → Visit 1998 HYUNDAI ELANTRA depreciation page to see full data. | ||||||
The graph below shows how mileage affects the price for 1998 HYUNDAI ELANTRA. This data was calculated using sales records from BADVIN database.
The table below shows average price for used 1998 HYUNDAI ELANTRA by mileage and number of sales.
You can scroll the table horizontally to see all columns.
| Mileage | Average Price | Sample Size |
|---|---|---|
| → Visit 1998 HYUNDAI ELANTRA depreciation page to see full data. | ||
Recent sales
BADVIN contain information about more than 30 sold 1998 HYUNDAI ELANTRA on US market. Below you may find some of recent sales with exact mileage and prices.
What's the difference between auctions and classifieds?Dealer and insurance auctions
86,687 mi
sold for $500
OH
3 years ago
79,857 mi
sold for $550
OH
5 years ago
Classifieds
66,542 mi
listed for $3,690
PA
4 years ago
133,022 mi
listed for $995
PA
4 years ago
133,022 mi
listed for $995
PA
4 years ago
278,027 mi
listed for $500
KY
4 years ago
136,819 mi
listed for $2,995
AZ
5 years ago
92,709 mi
listed for $3,398
MO
5 years ago
136,819 mi
listed for $2,995
AZ
5 years ago

52,848 mi
listed for $2,790
CA
5 years ago
Features and options
We've collected all possible options and features that you may find in sales listings for 1998 HYUNDAI ELANTRA and organized it in two lists.
- 4 PASSENGER
- 5 PASSENGER
- AIR BAG
- AIR CONDITIONING
- AIRBAG FRONT LEFT
- AIRBAG FRONT RIGHT
- AM\FM\CASSETTE
- CLOTH SEATS
- DUAL AIR BAGS
- HARD TOP
- LEFT CURTAIN AIRBAG
- POWER STEERING
- SEAT TYPE - BUCKET
- WARRANTY BOOK
Other years of HYUNDAI ELANTRA
1995 HYUNDAI ELANTRA
10+ sales records

1996 HYUNDAI ELANTRA
20+ sales records
2000 HYUNDAI ELANTRA
$3,999 average used price
330+ sales records

2008 HYUNDAI ELANTRA
$5,376 average used price
8,300+ sales records

2010 HYUNDAI ELANTRA
$5,995 average used price
20,900+ sales records

2024 HYUNDAI ELANTRA
$22,990 average used price
9,300+ sales records
Similar Models

1995 HYUNDAI ACCENT
$17,215 MSRP
20+ sales records

1997 HYUNDAI ACCENT
$17,215 MSRP
30+ sales records
1997 HYUNDAI TIBURON
$8,790 MSRP
20+ sales records

1999 HYUNDAI SONATA
$25,559 MSRP
60+ sales records
2000 HYUNDAI SONATA
$25,559 MSRP
130+ sales records

2001 HYUNDAI XG
$8,900 MSRP
130+ sales records
Frequently asked questions
Emission inspection status may show whether the vehicle vehicle has passed required state emissions testing, which is essential for registration in many areas, if such inspections have been documented.
Yes, a VIN decoder can often determine if specific safety technologies are equipped on a vehicle based on the trim and optional equipment codes within the VIN.
Yes, the choice of vehicle color can impact the depreciation rate, with neutral colors typically being easier to sell and potentially holding their value better than more unconventional colors.
Yes, the fuel type of a vehicle is listed on the window sticker, providing important information for buyers about whether the car operates on gasoline, diesel, electricity, or hybrid technology.
Vehicle history reports may include details and photographs from auto auctions, showing the vehicle vehicle’s condition and specifications when it was up for sale, if available.
Safety Recalls
With over 738,000 Hyundais sold annually in the U.S., up to 25% may have unaddressed safety recalls. A VIN check reveals any open recalls.
Accident History
Decoding the VIN uncovers any previous accident damage, flood damage, or other issues that could affect the safety and value of a used Hyundai.
Warranty Coverage
A VIN check confirms the original warranty details and remaining coverage, which is crucial for Hyundais known for their long warranties.


