
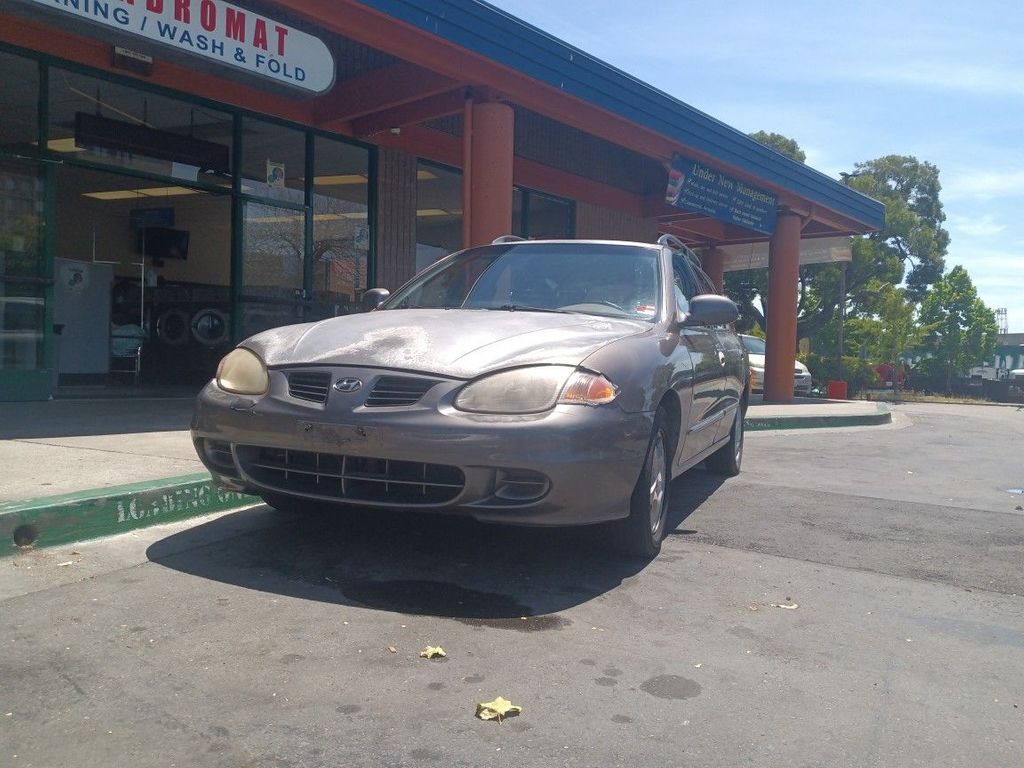
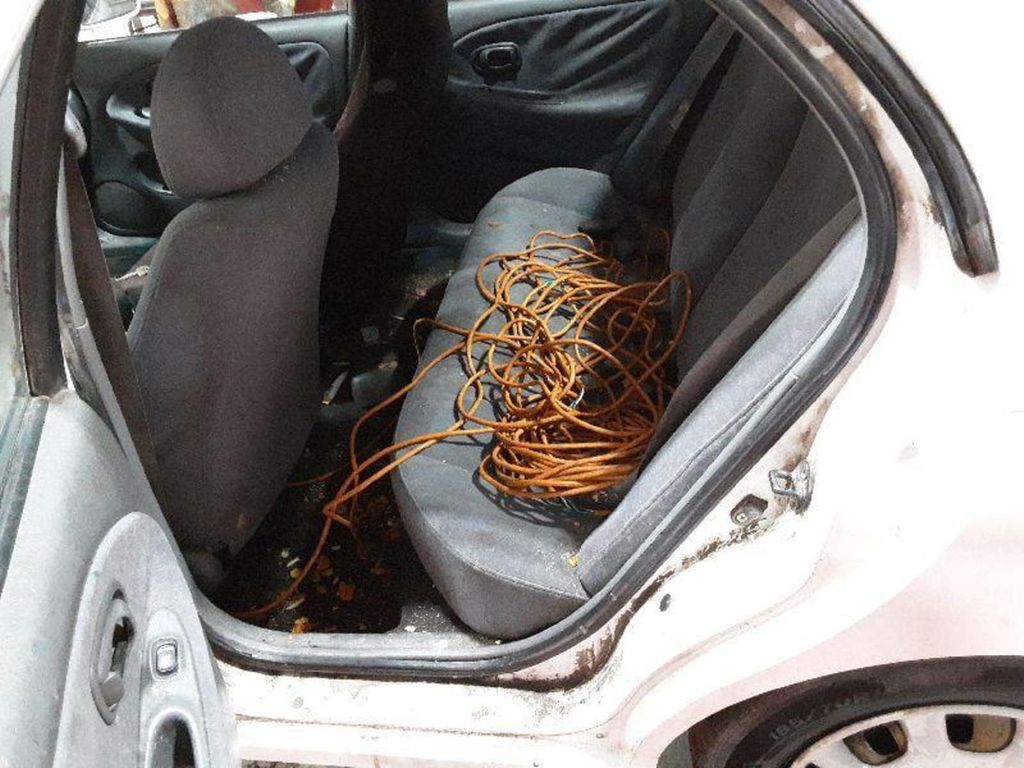
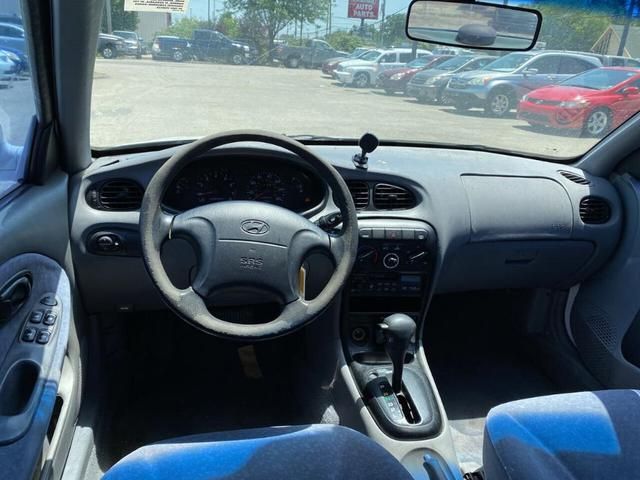
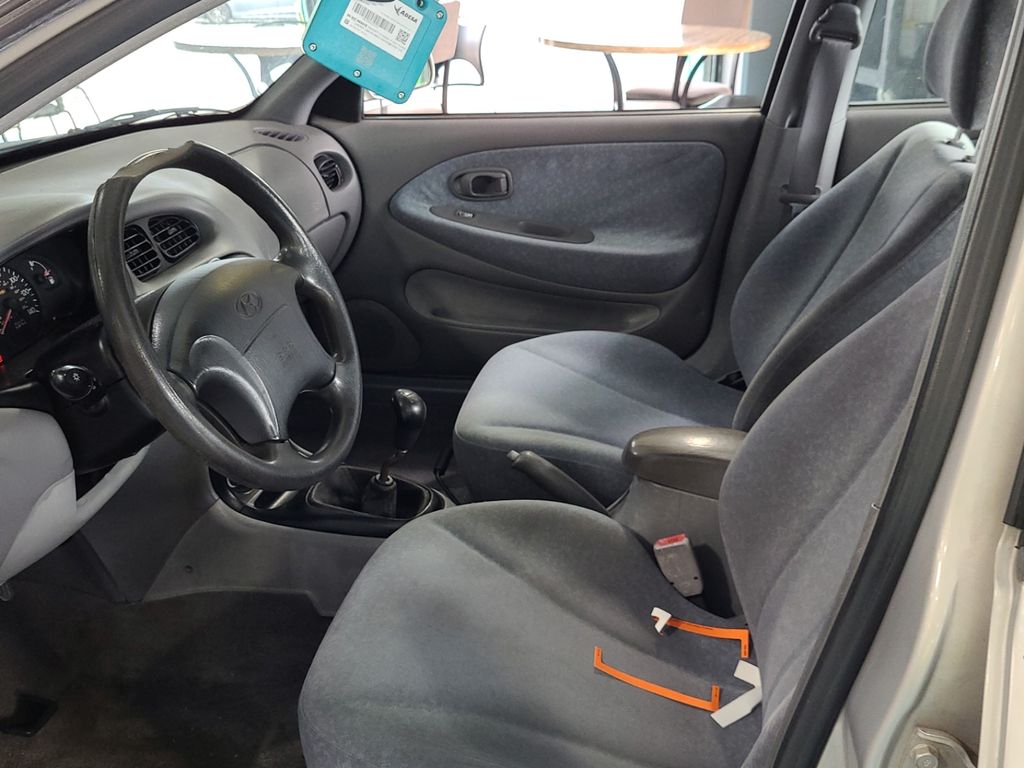
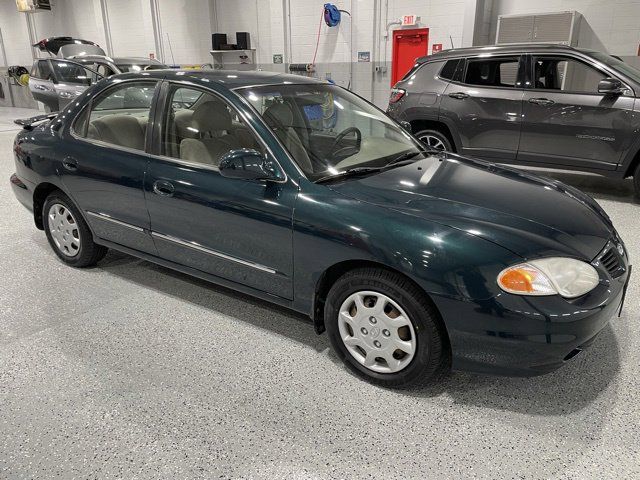
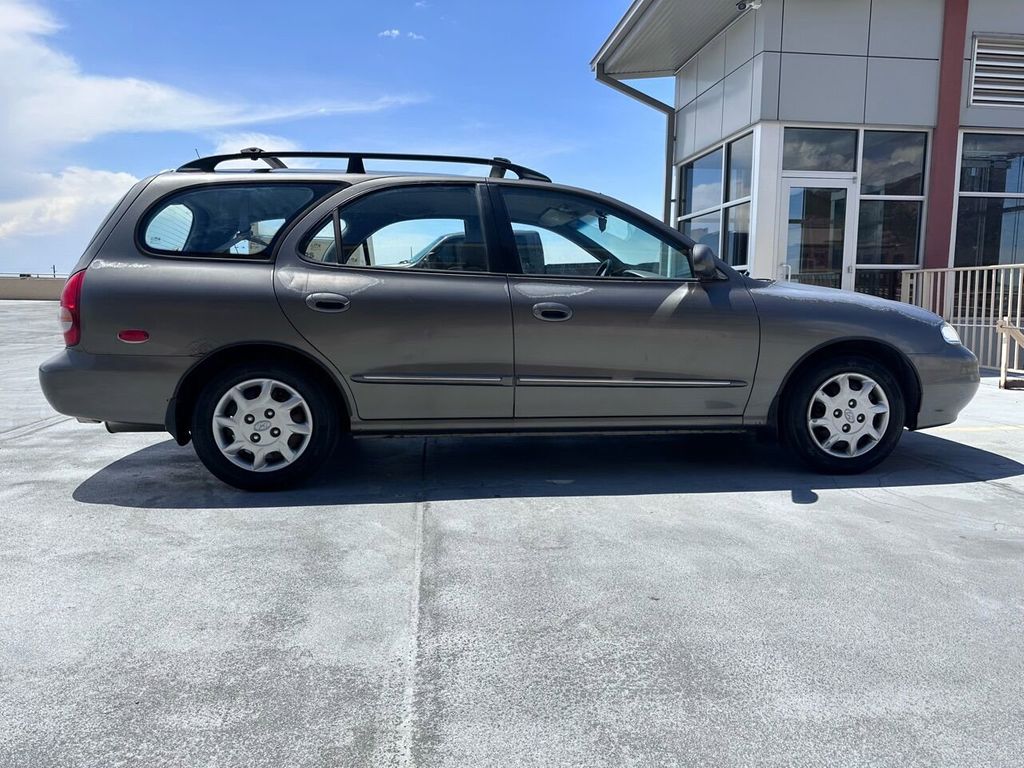
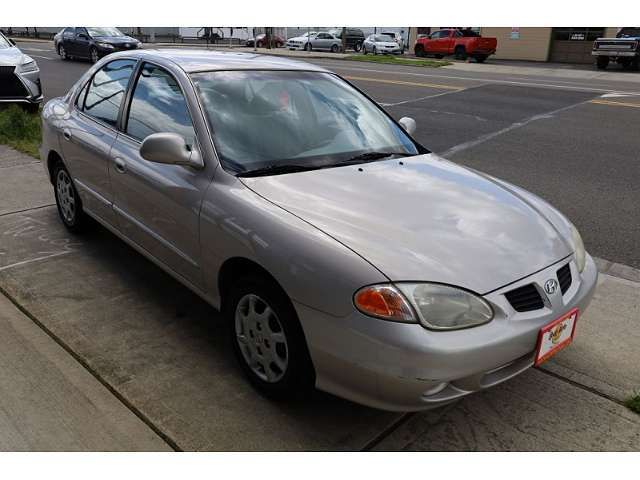
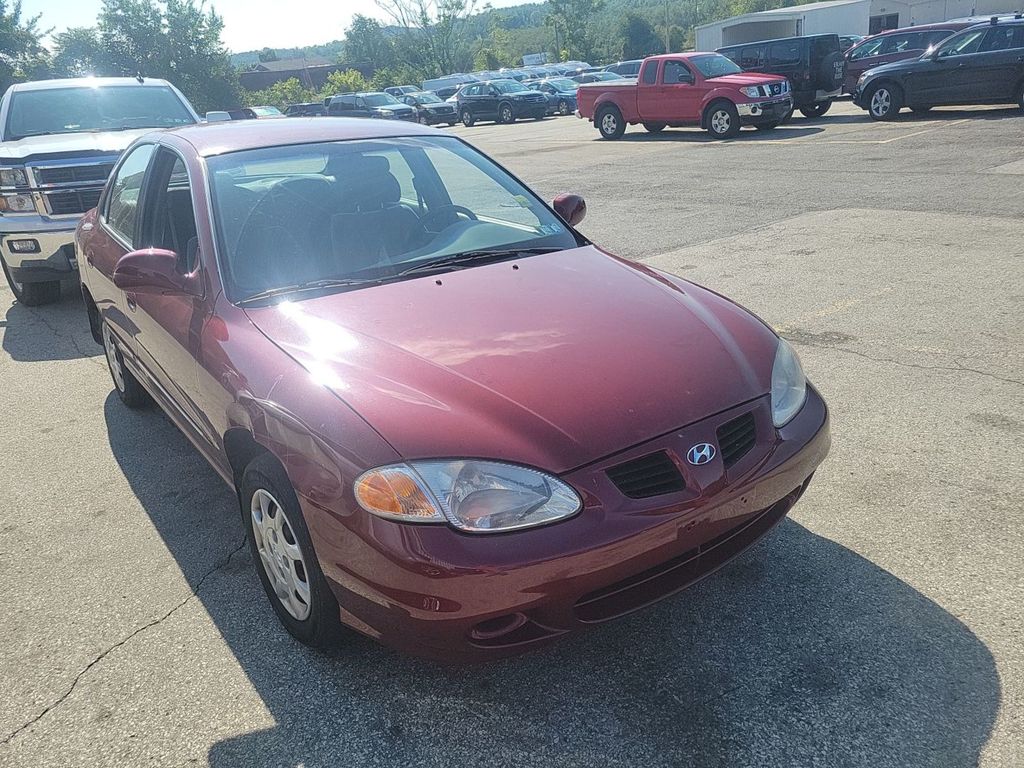
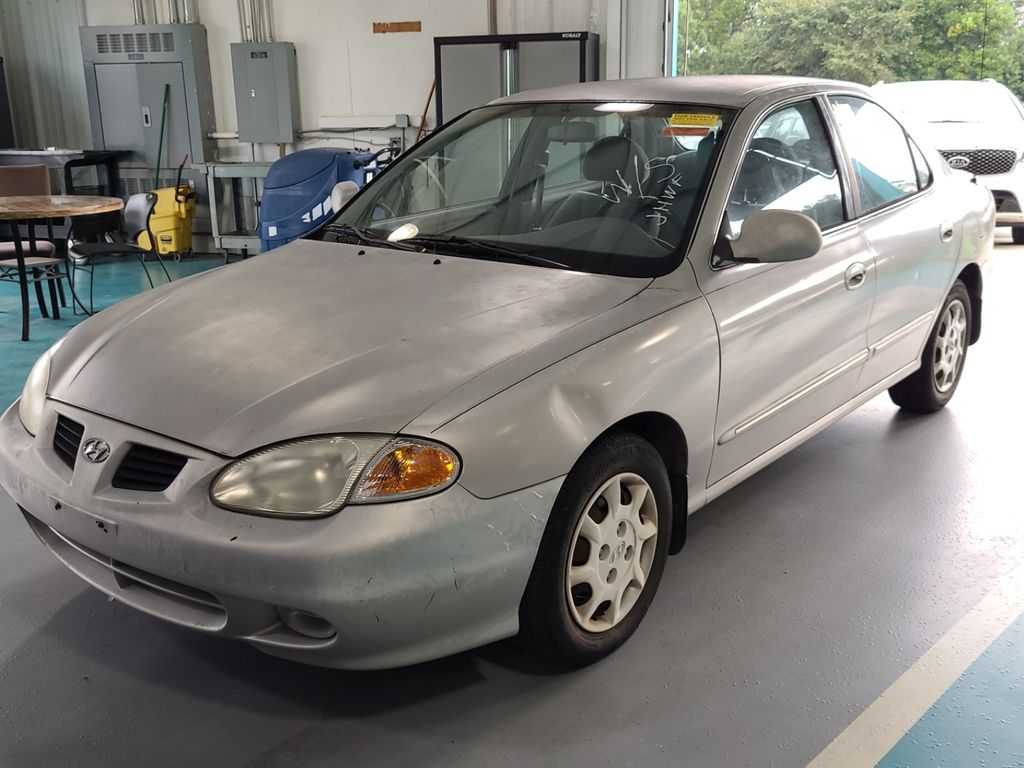
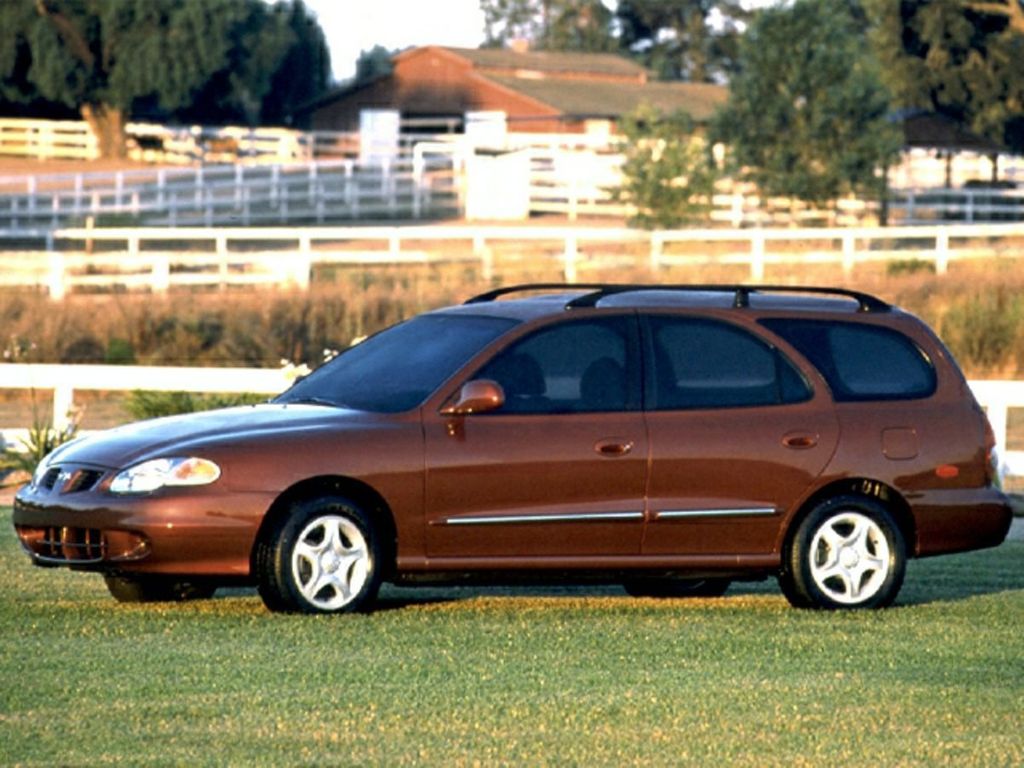
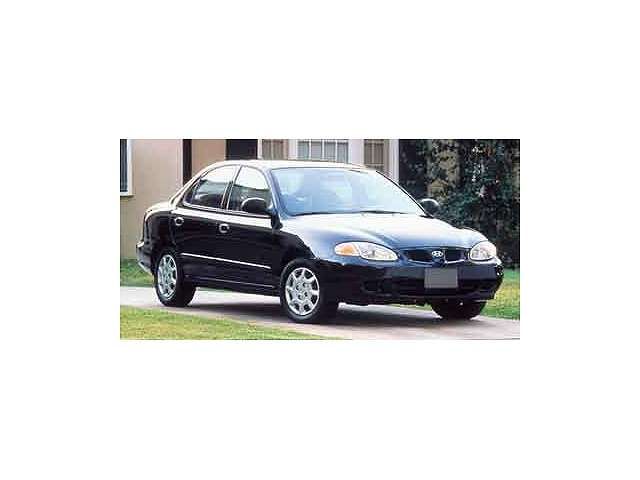
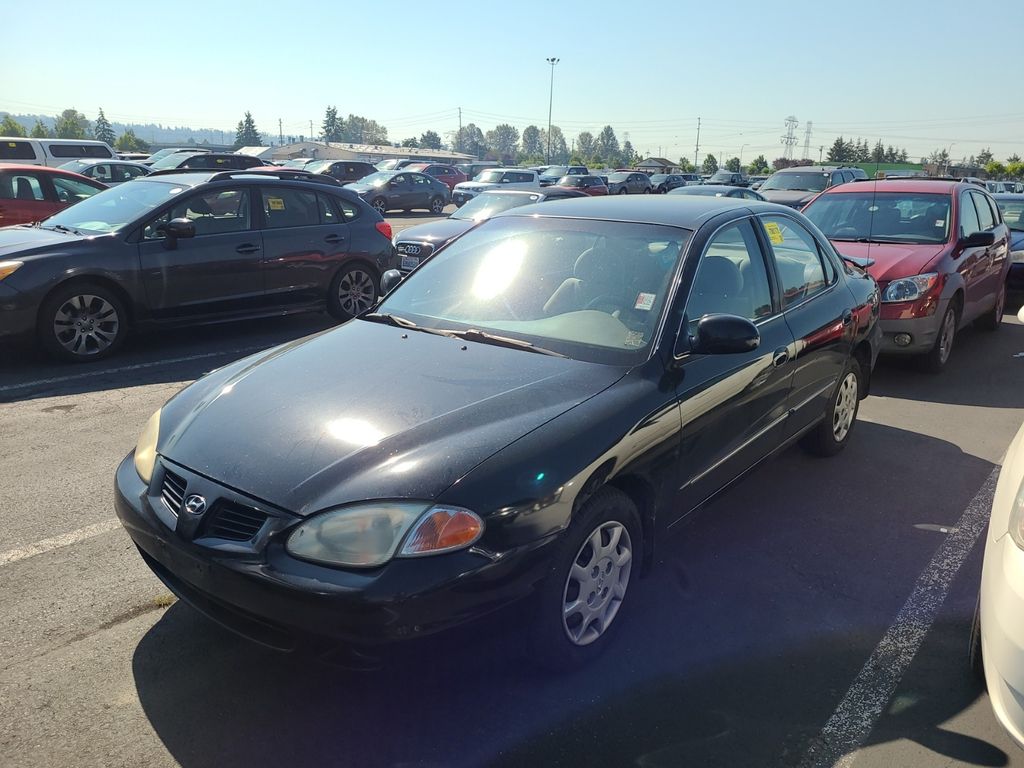
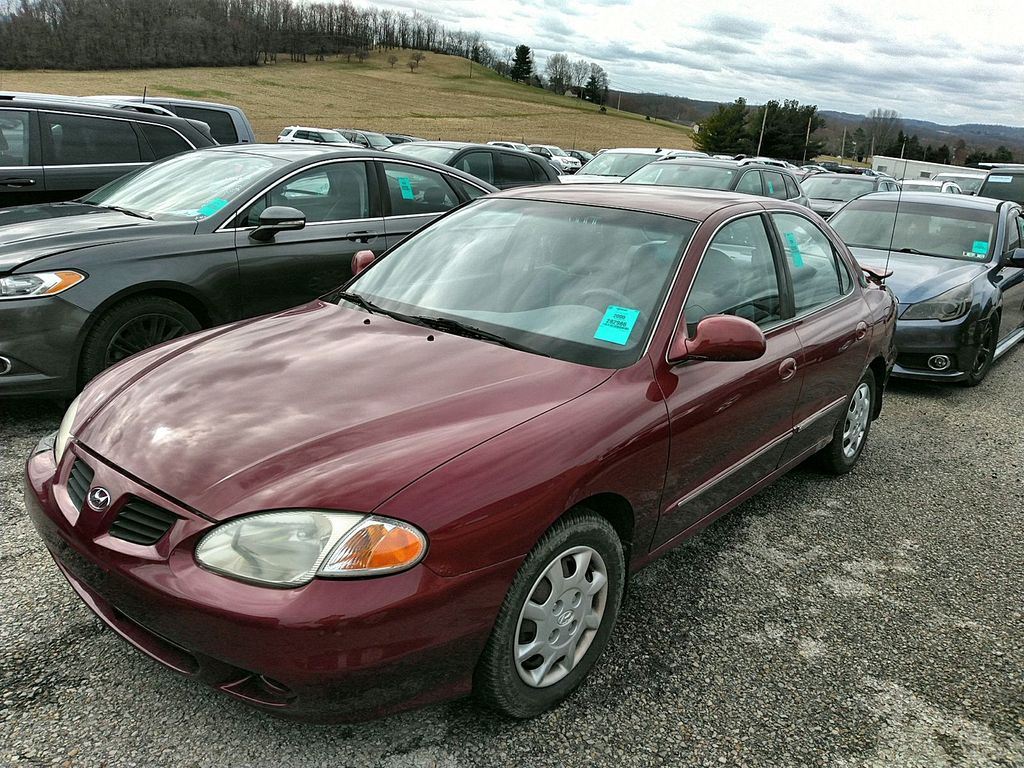
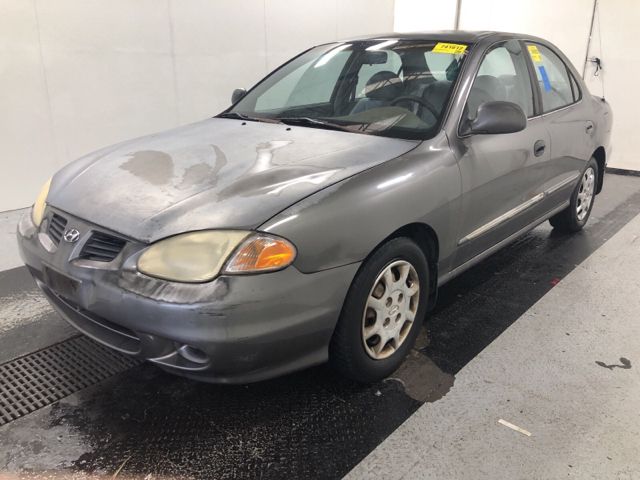
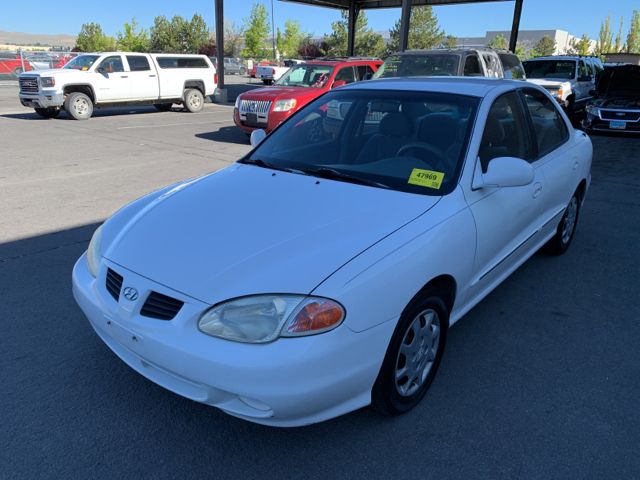
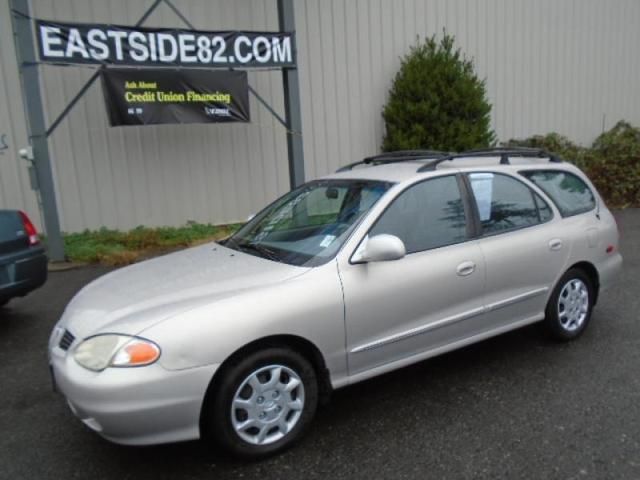
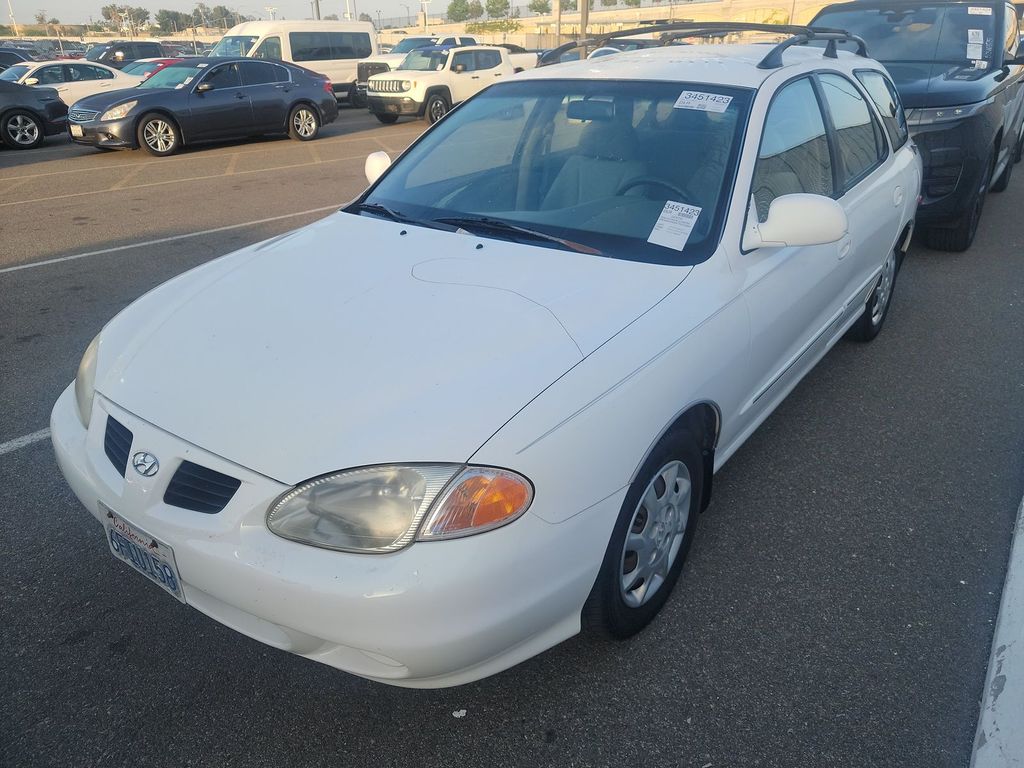
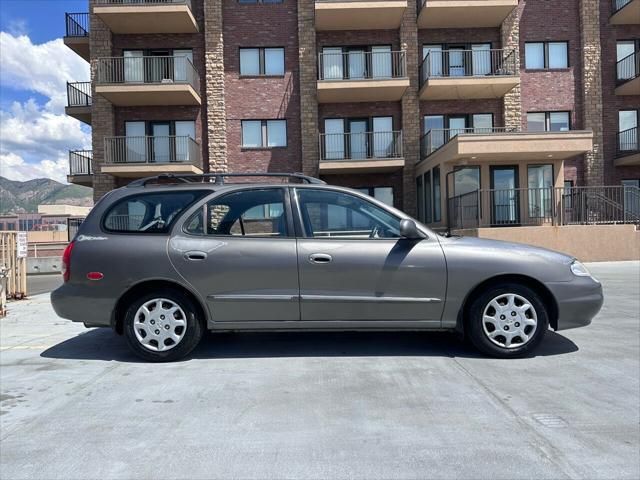
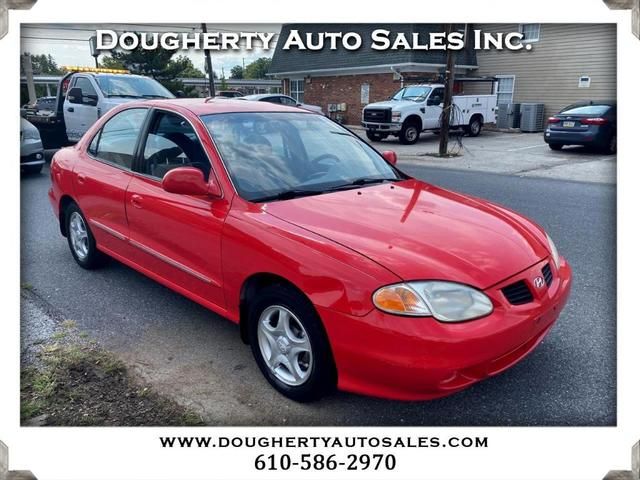
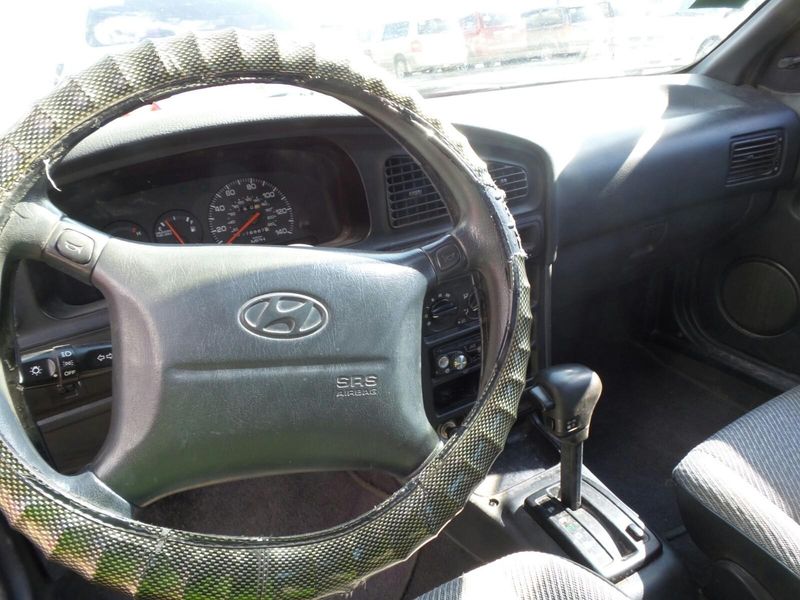
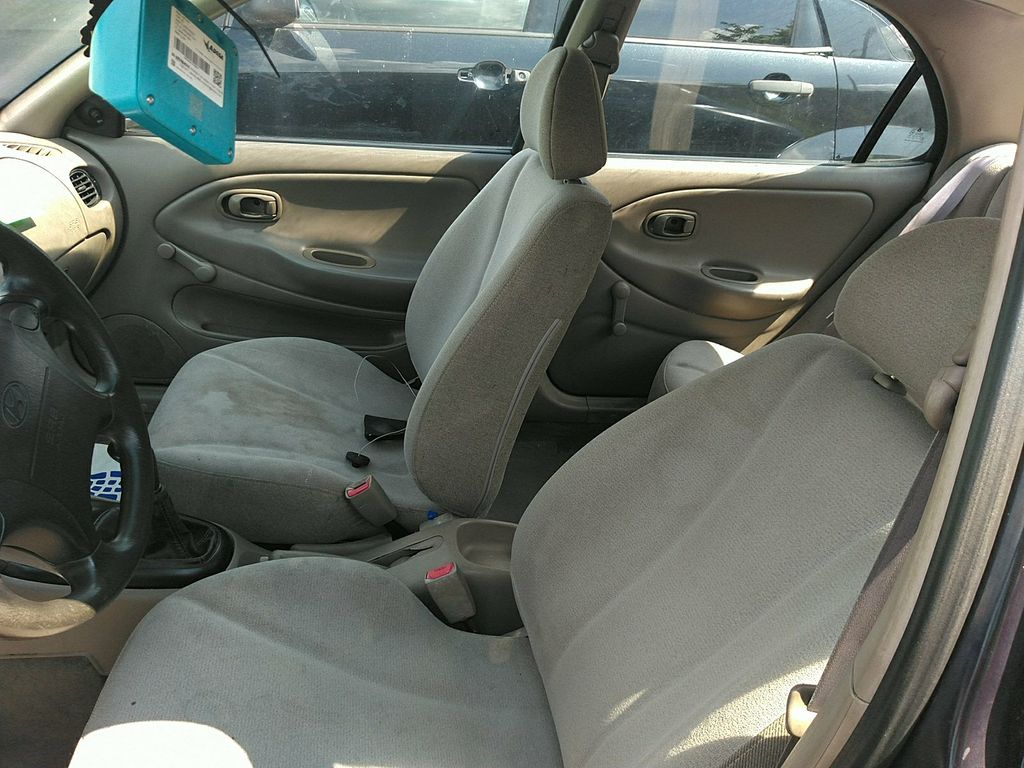
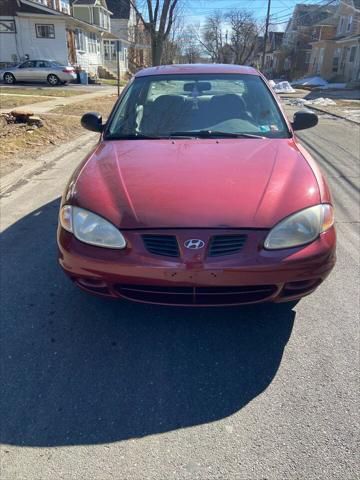
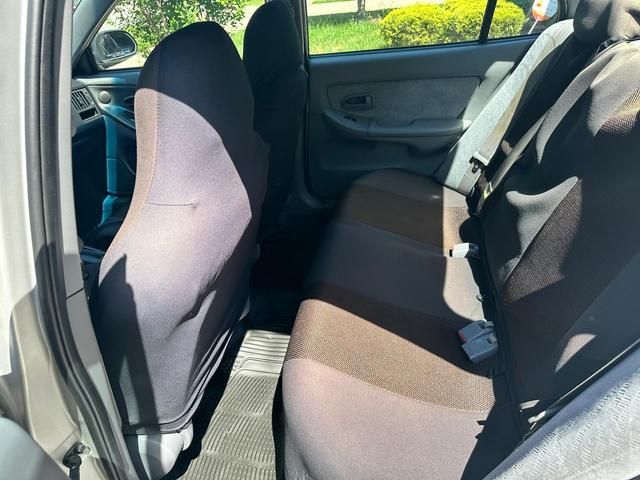
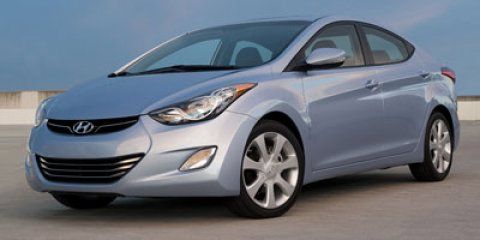
Photos
Pictures below are not fancy pictures from manufacturer catalog. It's all photos of real vehicles that were on sale on United States market. You can click on any picture to see specific vehicle and its VIN report.


The graph below is a depreciation curve for 2000 HYUNDAI ELANTRA. It shows how much this model looses per year in price. This analytics is calculated using sales records from BADVIN database.
The table below shows average price for used 2000 HYUNDAI ELANTRA in each year since the year of manufacturing, current year price and projected price in the future years.
You can scroll the table horizontally to see all columns.
| Year | Average Mileage | Average Price | % Left | % Lost | ||
|---|---|---|---|---|---|---|
| 2000 MSRP | 0 mi | $20,800 | — | — | 100% | 0% |
| 2000 | 10,128 mi | $22,990 | −$2,190 | −10.53% | 110.53% | -10.53% |
| 2001 | 20,256 mi | $21,675 | +$1,315 | +5.72% | 104.21% | -4.21% |
| 2002 | 30,384 mi | $19,998 | +$1,677 | +7.74% | 96.14% | 3.86% |
| 2003 | 40,512 mi | $18,987 | +$1,011 | +5.06% | 91.28% | 8.72% |
| 2004 | 50,640 mi | $15,988 | +$2,999 | +15.8% | 76.87% | 23.13% |
| → Visit 2000 HYUNDAI ELANTRA depreciation page to see full data. | ||||||
The graph below shows how mileage affects the price for 2000 HYUNDAI ELANTRA. This data was calculated using sales records from BADVIN database.
The table below shows average price for used 2000 HYUNDAI ELANTRA by mileage and number of sales.
You can scroll the table horizontally to see all columns.
| Mileage | Average Price | Sample Size |
|---|---|---|
| 75,000 mi | $5,423 | 14 sales |
| 150,000 mi | $2,253 | 10 sales |
| 170,000 mi | $2,374 | 16 sales |
| → Visit 2000 HYUNDAI ELANTRA depreciation page to see full data. | ||
Recent sales
BADVIN contain information about more than 330 sold 2000 HYUNDAI ELANTRA on US market. Below you may find some of recent sales with exact mileage and prices.
What's the difference between auctions and classifieds?Dealer and insurance auctions
71,066 mi
sold for $1,500
PA
a year ago
120,503 mi
sold for $2,600
TN
a year ago
214,631 mi
sold for $1,000
MO
a year ago
119,390 mi
sold for $600
PA
2 years ago

206,227 mi
sold for $200
OR
2 years ago
172,120 mi
sold for $500
NC
2 years ago
157,056 mi
sold for $500
TX
2 years ago
141,248 mi
sold for $2,200
TX
2 years ago
207,659 mi
sold for $1,200
WA
2 years ago
88,954 mi
sold for $800
PA
2 years ago
85,988 mi
sold for $700
NJ
3 years ago
114,852 mi
sold for $900
NV
3 years ago
Classifieds

75,812 mi
listed for $4,497
FL
a month ago

220,000 mi
listed for $1,400
NY
3 months ago
75,795 mi
listed for $4,897
FL
3 months ago

75,894 mi
listed for $4,500
IA
3 months ago
77,073 mi
listed for $5,950
OR
8 months ago
77,073 mi
listed for $5,950
OR
8 months ago

68,000 mi
listed for $3,995
KS
8 months ago
77,073 mi
listed for $5,950
OR
9 months ago
93,422 mi
listed for $3,995
CA
a year ago
143,489 mi
listed for $2,495
UT
a year ago
143,489 mi
listed for $2,495
UT
a year ago
59,486 mi
listed for $3,950
NJ
a year ago
Features and options
We've collected all possible options and features that you may find in sales listings for 2000 HYUNDAI ELANTRA and organized it in two lists.
- POWER MOONROOF
- SUN ROOF
- SUNROOF/MOONROOF
- 5 PASSENGER
- ABS
- ADJUSTABLE STEERING WHEEL
- AIR BAG
- AIR CONDITIONING
- AIRBAG FRONT LEFT
- AIRBAG FRONT RIGHT
- AM/FM
- AM/FM/CD
- AM\FM\CASSETTE
- AM\FM\CASS\CD
- CARGO COVER
- CD IN DASH
- CLOTH SEATS
- COMPACT DISC
- CRUISE CONTROL
- DRIVE TRAIN - 2 WHEEL
- DUAL AIR BAGS
- ELECTRIC MIRRORS
- FLOOR MATS
- FOG LIGHTS
- HARD TOP
- JACK ASSEMBLY
- LEFT CURTAIN AIRBAG
- LF SIDE AIRBAG
- MP3 CAPABILITY
- POWER BRAKES
- POWER DRIVER SEAT
- POWER LOCKS
- POWER MIRRORS
- POWER STEERING
- POWER WINDOWS
- REAR DEFOGGER
- REAR SPOILER
- RF SIDE AIRBAG
- ROOF LUGGAGE RACK
- ROOF TYPE: SUNROOF
- SEAT NONE
- SEAT TYPE - BUCKET
- SIDE FRONT AIR BAGS
- SPOILER
- TILT WHEEL
- TOW PACKAGE
- WARRANTY BOOK
Other years of HYUNDAI ELANTRA
1995 HYUNDAI ELANTRA
10+ sales records
1998 HYUNDAI ELANTRA
30+ sales records
1999 HYUNDAI ELANTRA
100+ sales records
2006 HYUNDAI ELANTRA
$3,999 average used price
4,000+ sales records
2012 HYUNDAI ELANTRA
$8,497 average used price
36,000+ sales records

2014 HYUNDAI ELANTRA
$9,900 average used price
52,000+ sales records
Similar Models

1997 HYUNDAI ACCENT
$17,215 MSRP
30+ sales records
1997 HYUNDAI SONATA
$25,559 MSRP
10+ sales records
1998 HYUNDAI ACCENT
$17,215 MSRP
30+ sales records

2001 HYUNDAI SANTA FE
$31,445 MSRP
$4,995 average used price
500+ sales records
2003 HYUNDAI TIBURON
$8,790 MSRP
$5,250 average used price
520+ sales records

2003 HYUNDAI SANTA FE
$31,445 MSRP
$4,000 average used price
2,600+ sales records
2000 HYUNDAI ELANTRA on BADVIN
Frequently asked questions
For importing or exporting vehicle vehicles, the VIN is crucial for compliance with international regulations, ensuring the vehicle meets safety, emission, and manufacturing standards of the importing country.
Yes, the window sticker of a vehicle provides the EPA fuel efficiency ratings, showing expected mpg in city and highway conditions.
Yes, the Monroney label includes information about the vehicle’s manufacturing origin, specifying where the vehicle was assembled and the origin of its parts.
You can use a Monroney label to compare different vehicle models by reviewing their features, fuel economy, safety equipment, and pricing directly on the sticker.
To possibly get a vehicle history report by VIN, you can enter the VIN on our website's search tool; the availability and detail of the report will depend on the data accessible for that specific VIN.
Safety Recalls
With over 738,000 Hyundais sold annually in the U.S., up to 25% may have unaddressed safety recalls. A VIN check reveals any open recalls.
Accident History
Decoding the VIN uncovers any previous accident damage, flood damage, or other issues that could affect the safety and value of a used Hyundai.
Warranty Coverage
A VIN check confirms the original warranty details and remaining coverage, which is crucial for Hyundais known for their long warranties.


