
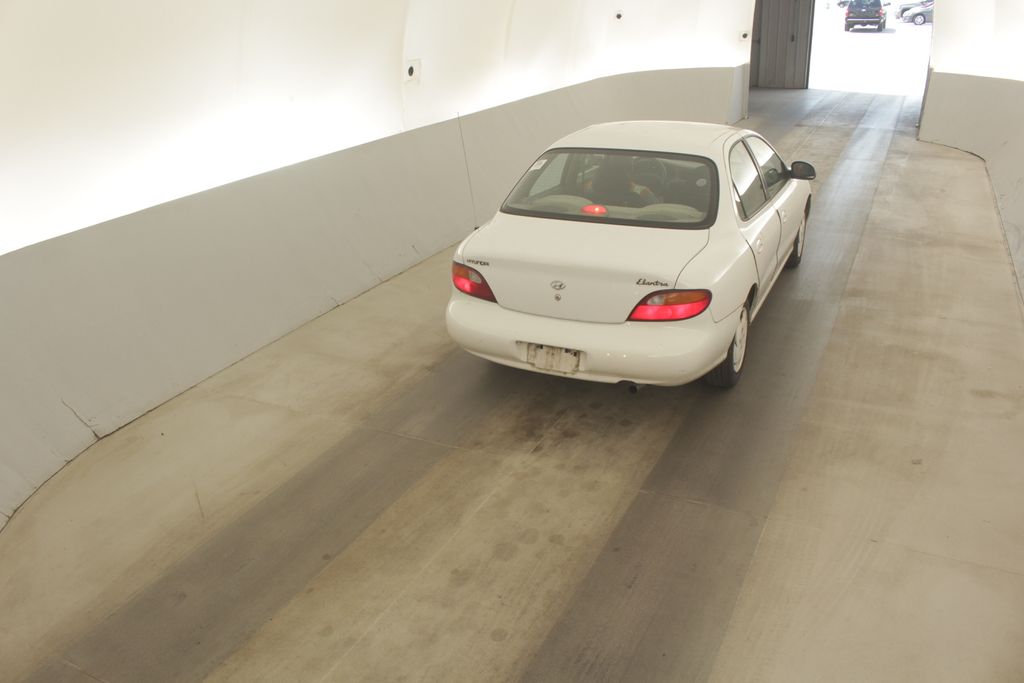
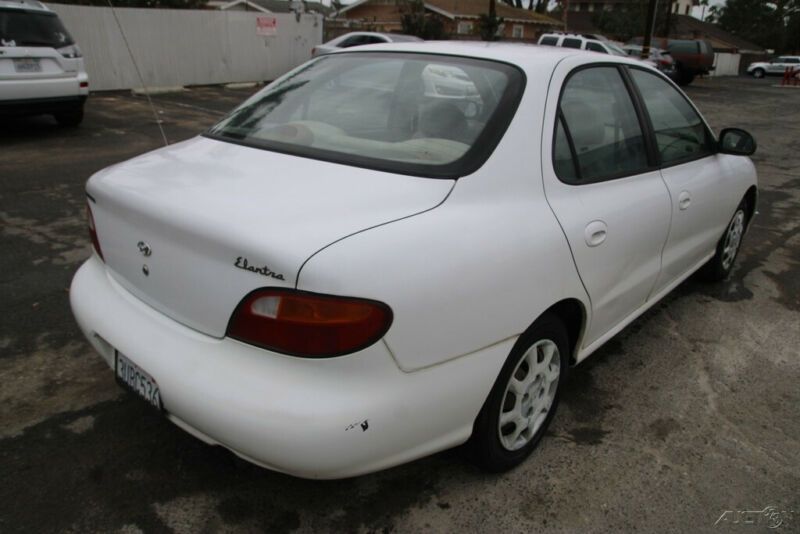
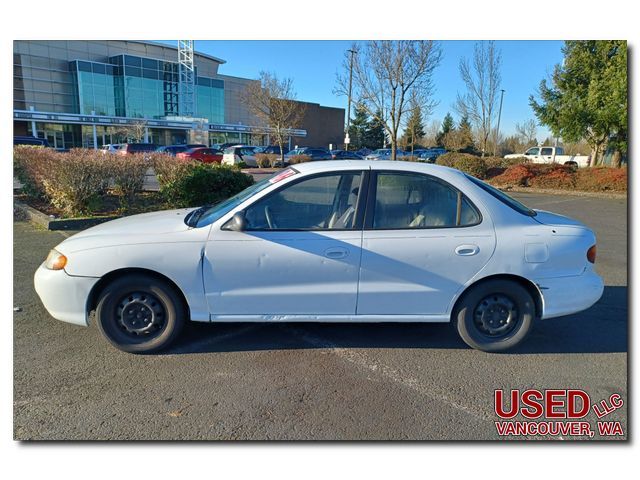
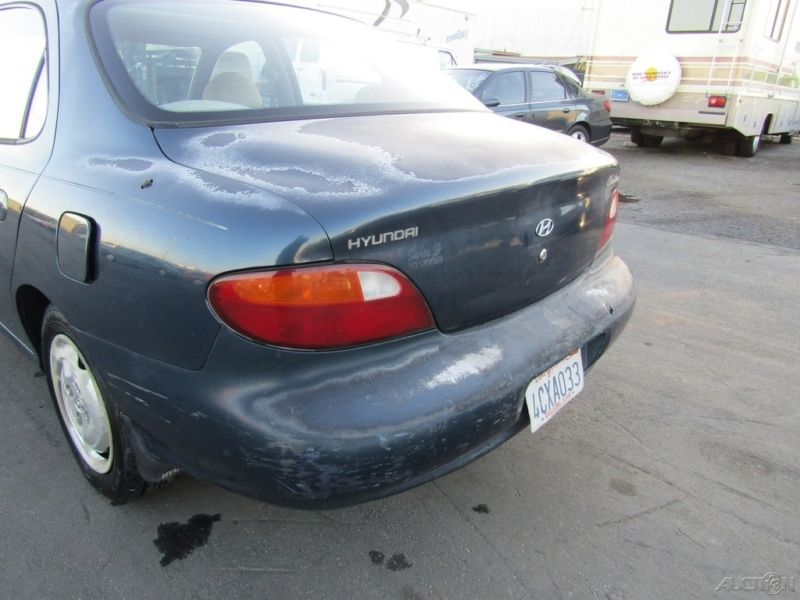
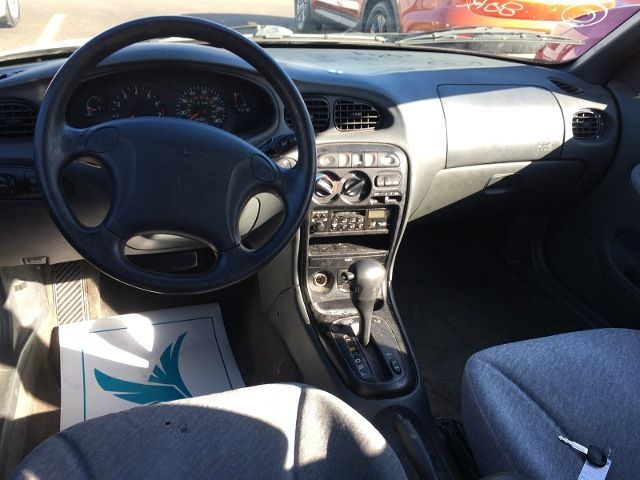
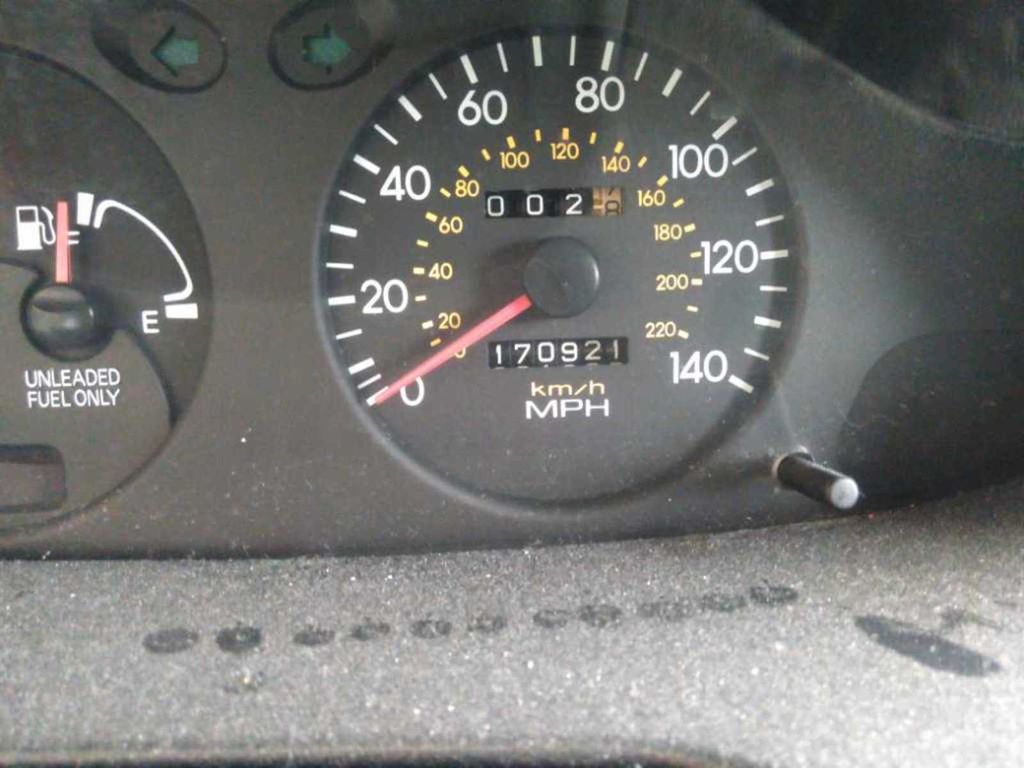
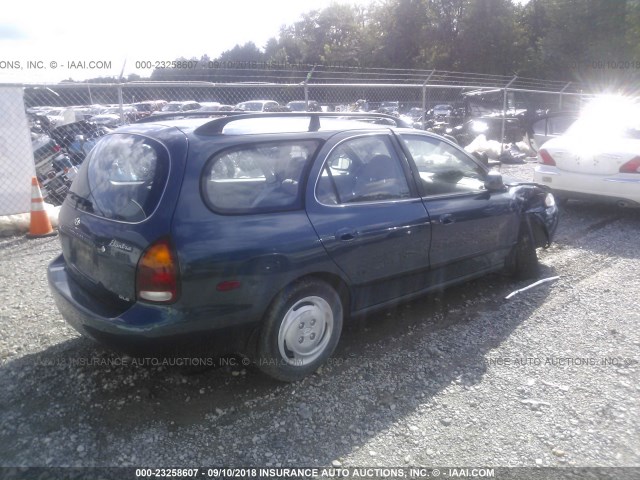
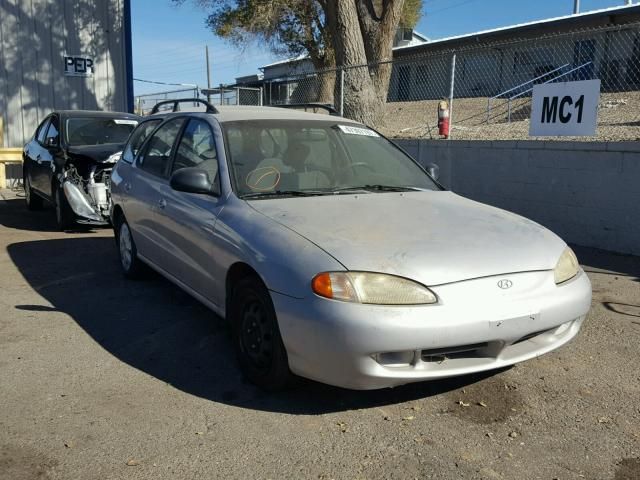
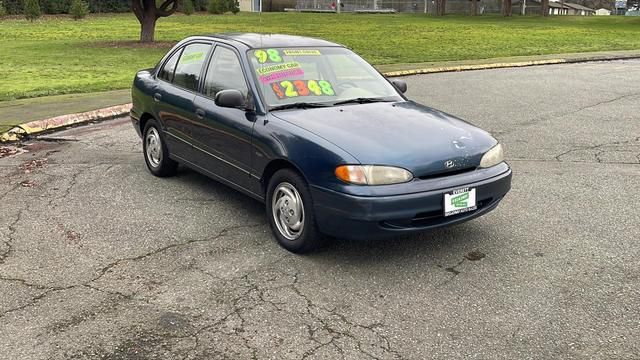
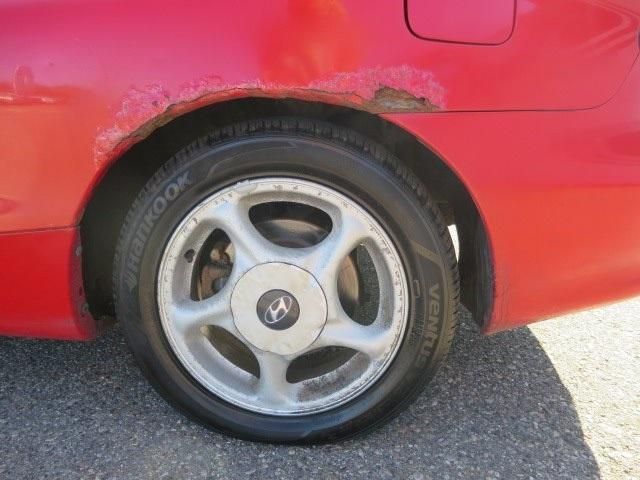
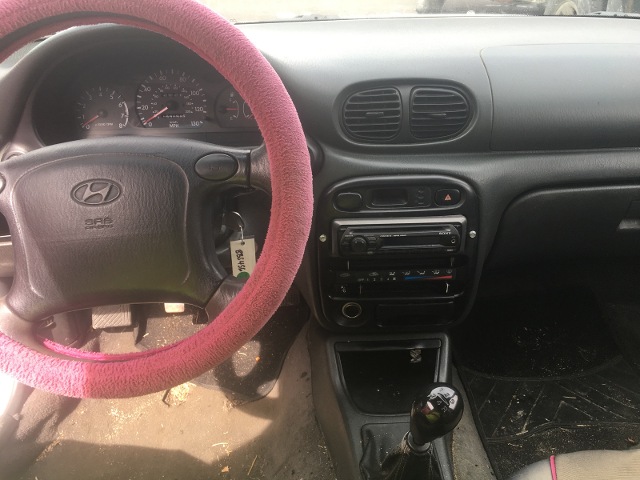
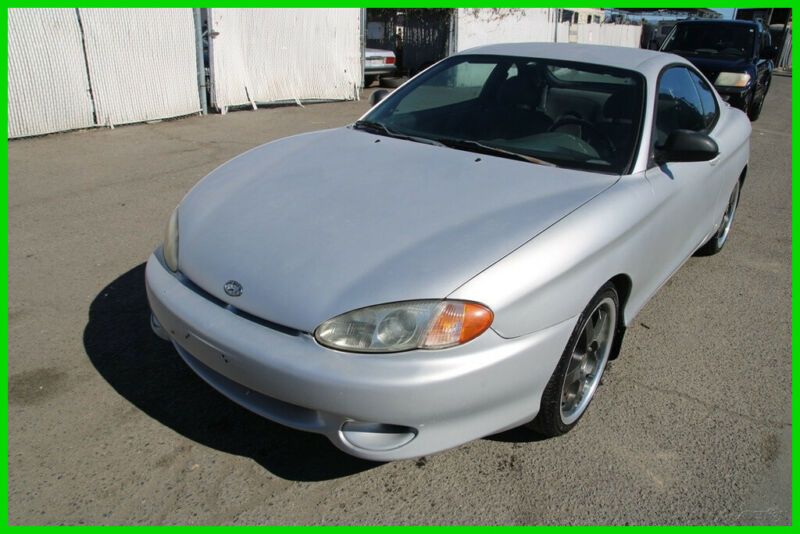
Photos
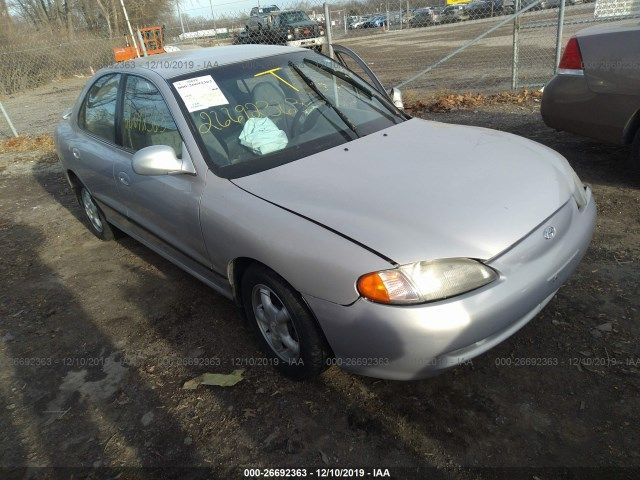
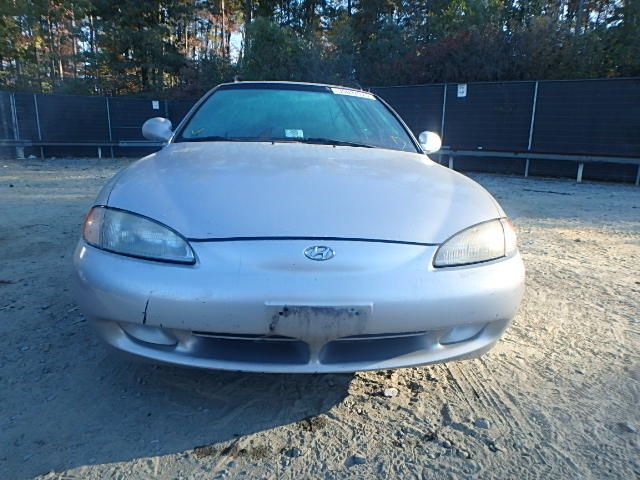
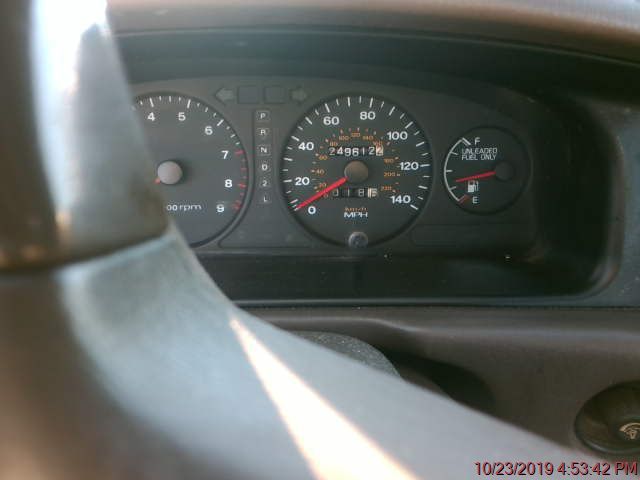
Pictures below are not fancy pictures from manufacturer catalog. It's all photos of real vehicles that were on sale on United States market. You can click on any picture to see specific vehicle and its VIN report.


The graph below is a depreciation curve for 1996 HYUNDAI ELANTRA. It shows how much this model looses per year in price. This analytics is calculated using sales records from BADVIN database.
The table below shows average price for used 1996 HYUNDAI ELANTRA in each year since the year of manufacturing, current year price and projected price in the future years.
You can scroll the table horizontally to see all columns.
| Year | Average Mileage | Average Price | % Left | % Lost | ||
|---|---|---|---|---|---|---|
| 1996 MSRP | 0 mi | $20,800 | — | — | 100% | 0% |
| 1996 | 10,128 mi | $22,990 | −$2,190 | −10.53% | 110.53% | -10.53% |
| 1997 | 20,256 mi | $21,675 | +$1,315 | +5.72% | 104.21% | -4.21% |
| 1998 | 30,384 mi | $19,998 | +$1,677 | +7.74% | 96.14% | 3.86% |
| 1999 | 40,512 mi | $18,987 | +$1,011 | +5.06% | 91.28% | 8.72% |
| 2000 | 50,640 mi | $15,988 | +$2,999 | +15.8% | 76.87% | 23.13% |
| → Visit 1996 HYUNDAI ELANTRA depreciation page to see full data. | ||||||
The graph below shows how mileage affects the price for 1996 HYUNDAI ELANTRA. This data was calculated using sales records from BADVIN database.
The table below shows average price for used 1996 HYUNDAI ELANTRA by mileage and number of sales.
You can scroll the table horizontally to see all columns.
| Mileage | Average Price | Sample Size |
|---|---|---|
| → Visit 1996 HYUNDAI ELANTRA depreciation page to see full data. | ||
Recent sales
BADVIN contain information about more than 20 sold 1996 HYUNDAI ELANTRA on US market. Below you may find some of recent sales with exact mileage and prices.
What's the difference between auctions and classifieds?Dealer and insurance auctions

80,931 mi
sold for $450
OH
5 years ago
Classifieds

274,489 mi
listed for $2,995
WA
2 years ago
Features and options
We've collected all possible options and features that you may find in sales listings for 1996 HYUNDAI ELANTRA and organized it in two lists.
- CLOTH SEATS
- DUAL AIR BAGS
- POWER LOCKS
- POWER STEERING
- POWER WINDOWS
- SEAT TYPE - BUCKET
Other years of HYUNDAI ELANTRA

1997 HYUNDAI ELANTRA
20+ sales records

2005 HYUNDAI ELANTRA
$3,999 average used price
3,800+ sales records

2010 HYUNDAI ELANTRA
$5,995 average used price
20,900+ sales records

2013 HYUNDAI ELANTRA
$8,991 average used price
114,200+ sales records

2014 HYUNDAI ELANTRA
$9,900 average used price
52,000+ sales records

2016 HYUNDAI ELANTRA
$10,890 average used price
91,300+ sales records
Similar Models

1995 HYUNDAI ACCENT
$17,215 MSRP
20+ sales records
1995 HYUNDAI SONATA
$25,559 MSRP
10+ sales records
1996 HYUNDAI ACCENT
$17,215 MSRP
20+ sales records
1997 HYUNDAI TIBURON
$8,790 MSRP
20+ sales records
1998 HYUNDAI ACCENT
$17,215 MSRP
30+ sales records
1999 HYUNDAI TIBURON
$8,790 MSRP
20+ sales records
Frequently asked questions
A vehicle window sticker includes information such as MSRP, fuel efficiency, safety ratings, and optional equipment.
Car depreciation is the decrease in value of a vehicle over time. It's a crucial factor to consider when calculating the total cost of vehicle ownership.
Our vehicle history reports may indicate if the vehicle vehicle was previously used in commercial services like a taxi or rental car, which may affect its condition and value, if such usage is recorded.
A VIN decoder can confirm the safety features originally installed in a vehicle, such as airbags, ABS, and stability control systems.
Warranty returns, if documented, are detailed with reasons for returns and repairs made, providing insight into past issues with the vehicle vehicle.
The frequency of oil changes, a crucial aspect of vehicle maintenance, might be documented in the service history section of our reports, if records are available.
VIN decoding does not directly reveal maintenance history; however, it can identify the vehicle model and year, which you can use to access maintenance records through service databases with the VIN.
Safety Recalls
With over 738,000 Hyundais sold annually in the U.S., up to 25% may have unaddressed safety recalls. A VIN check reveals any open recalls.
Accident History
Decoding the VIN uncovers any previous accident damage, flood damage, or other issues that could affect the safety and value of a used Hyundai.
Warranty Coverage
A VIN check confirms the original warranty details and remaining coverage, which is crucial for Hyundais known for their long warranties.


