
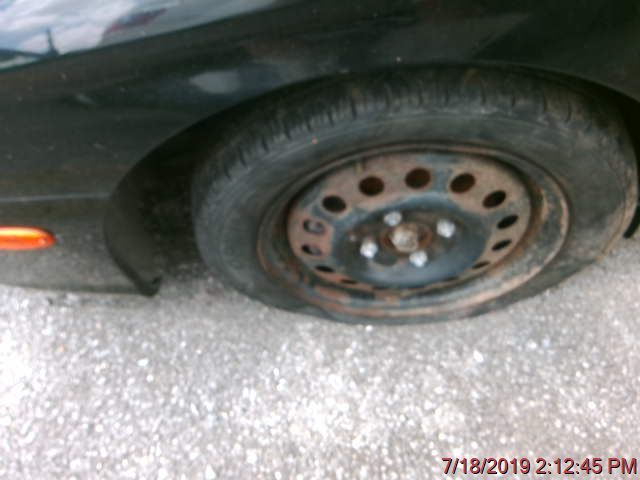
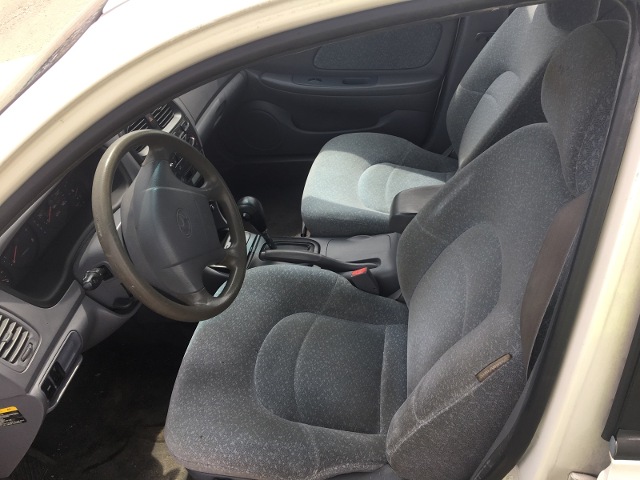
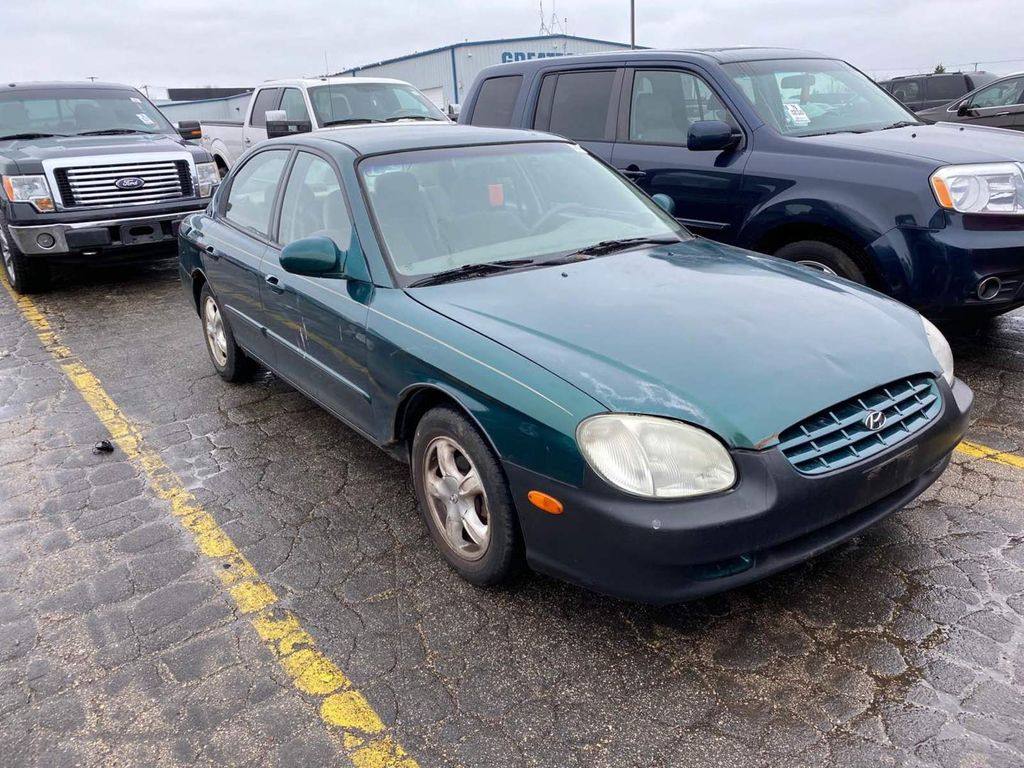
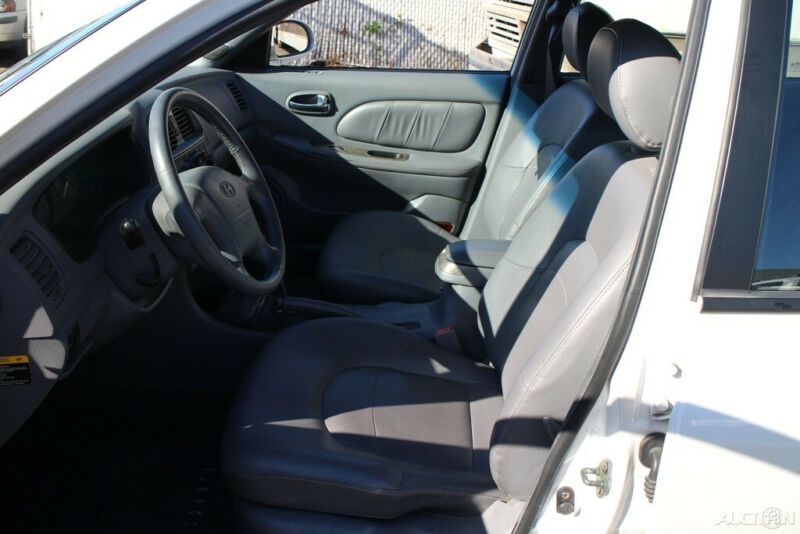
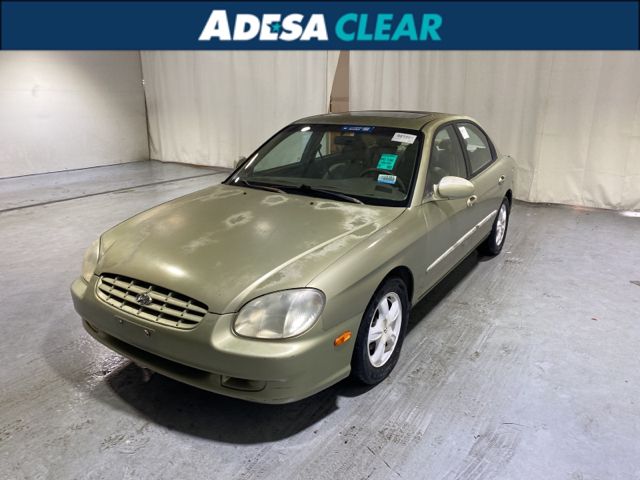
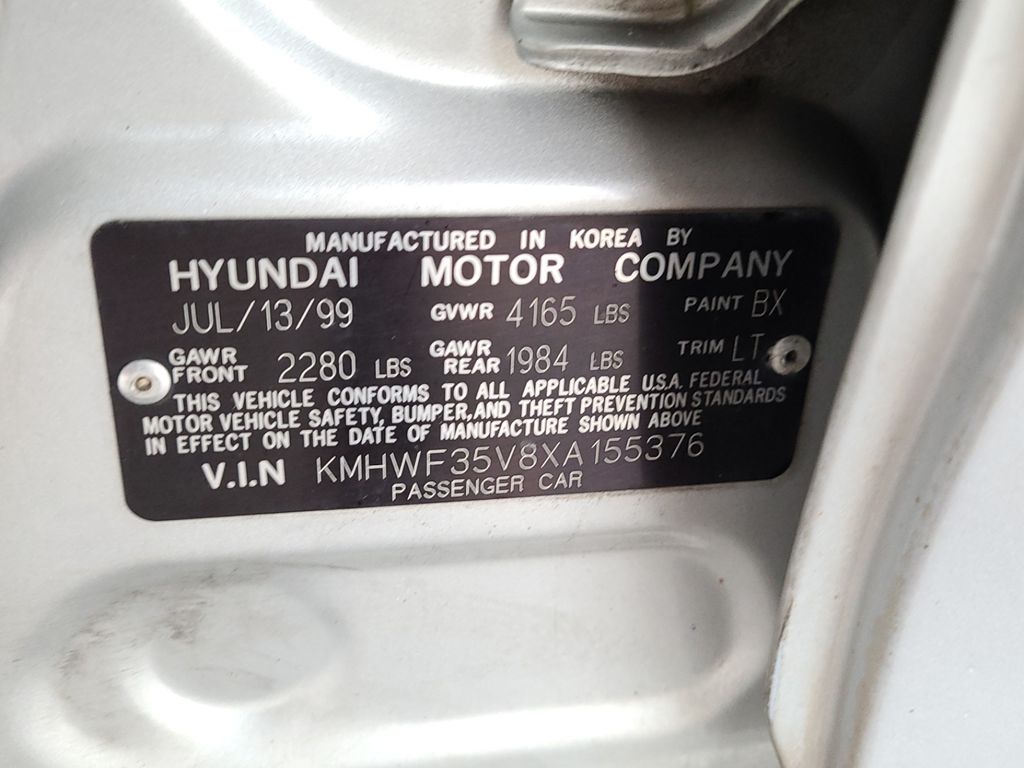
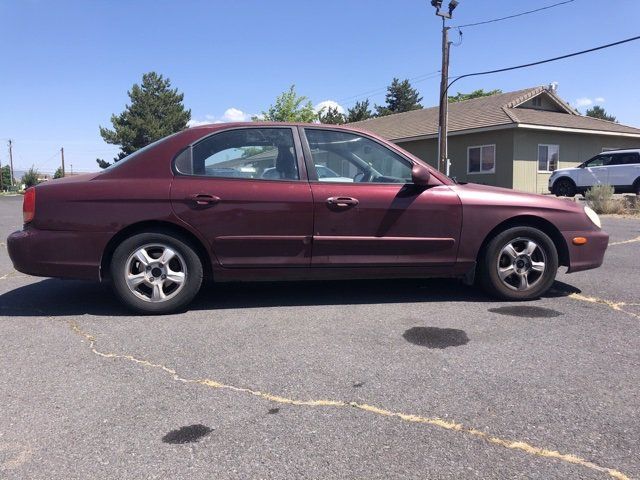
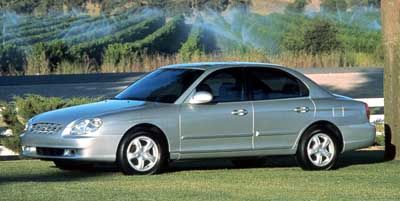
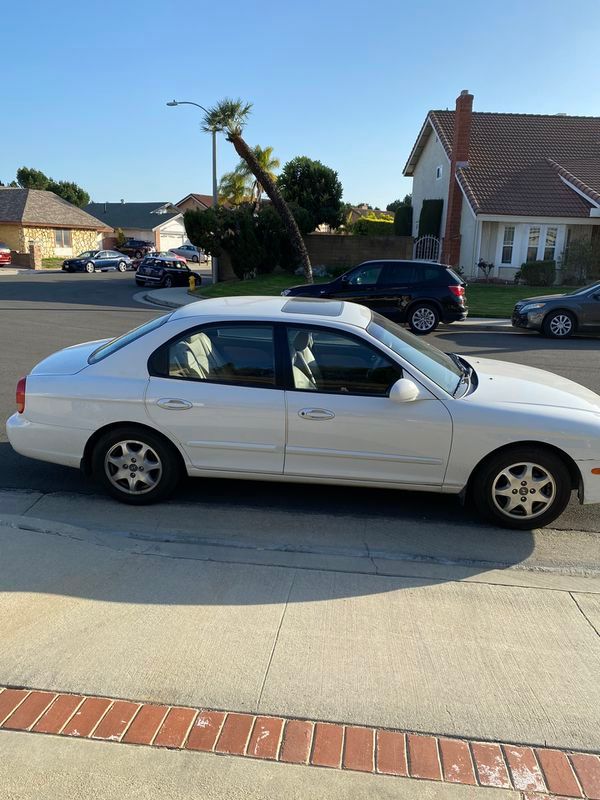
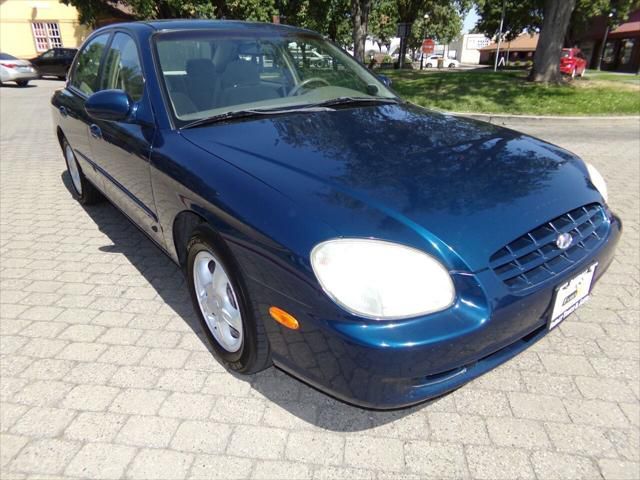
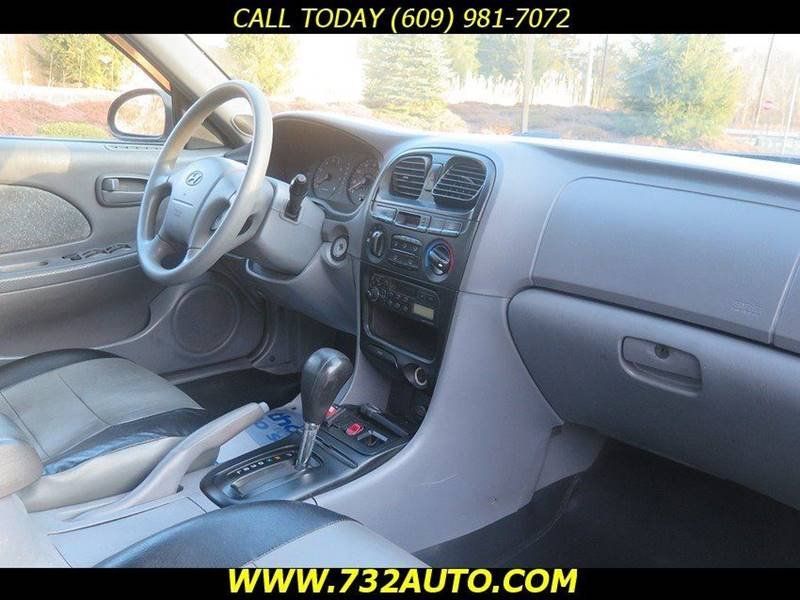
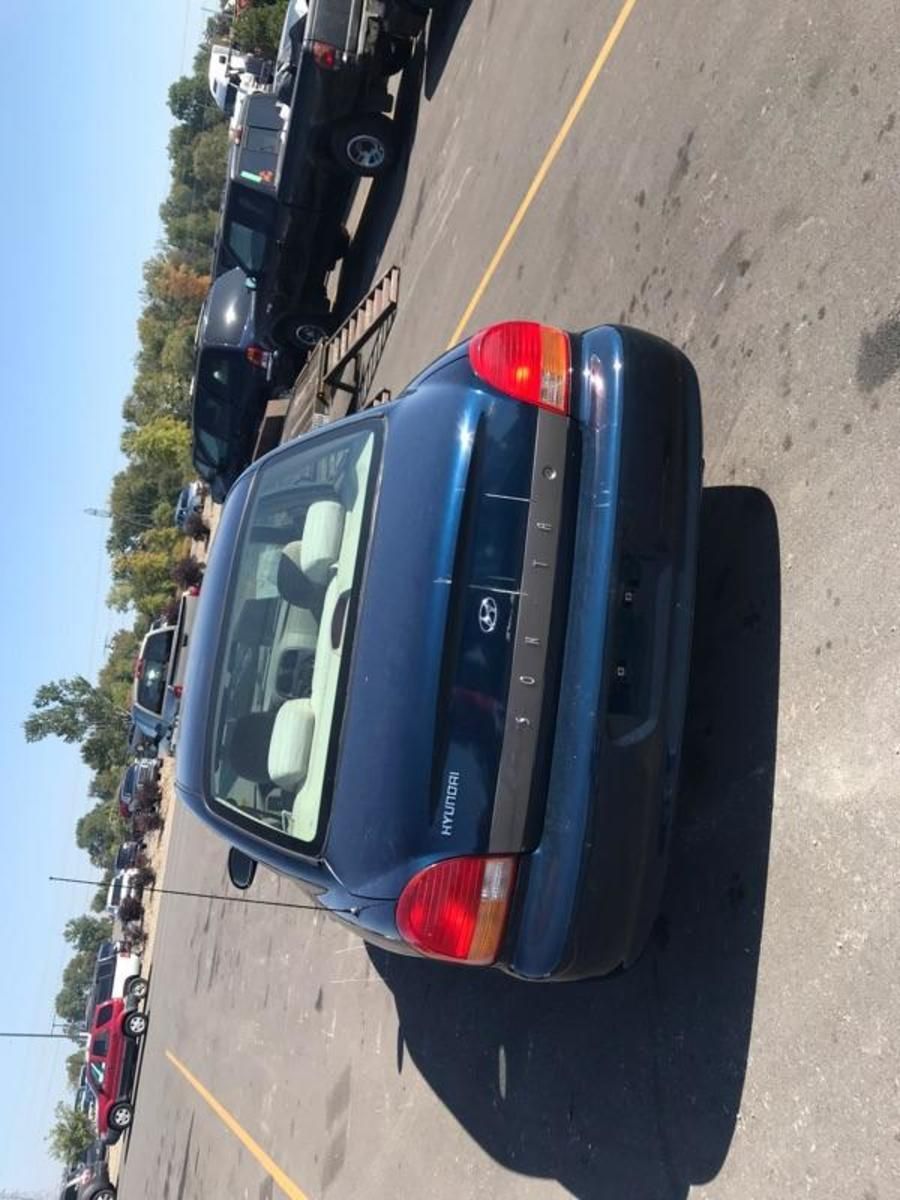
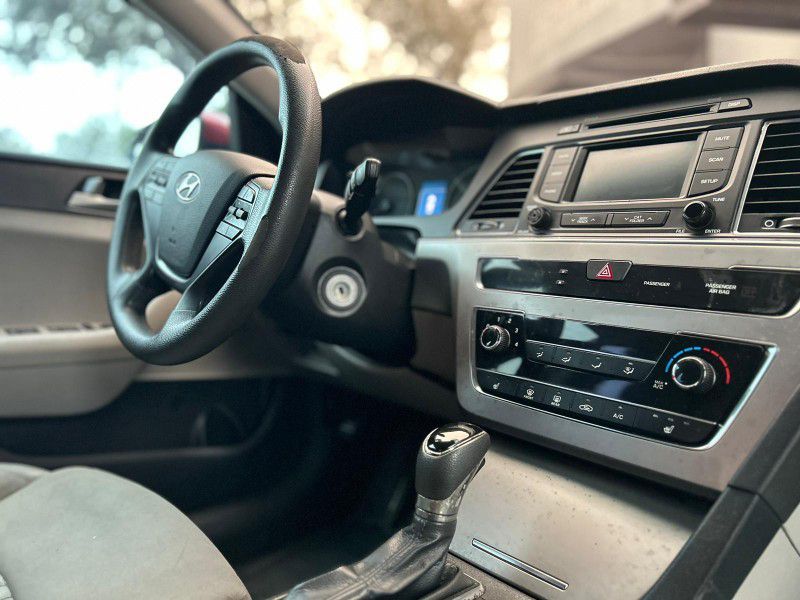
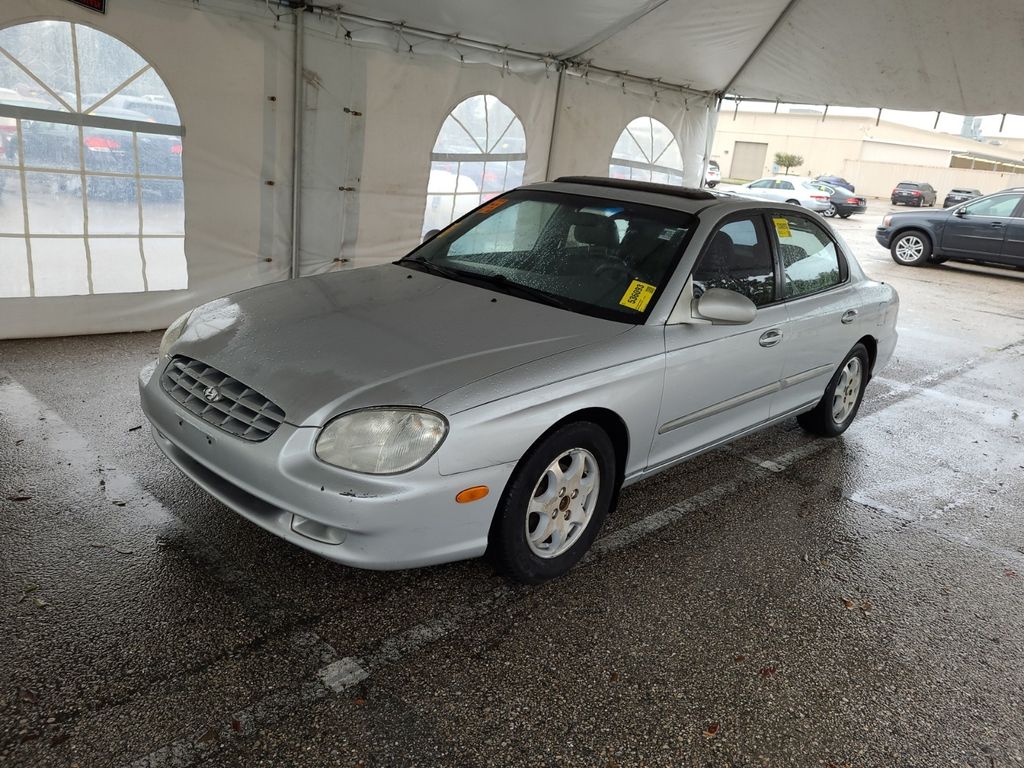
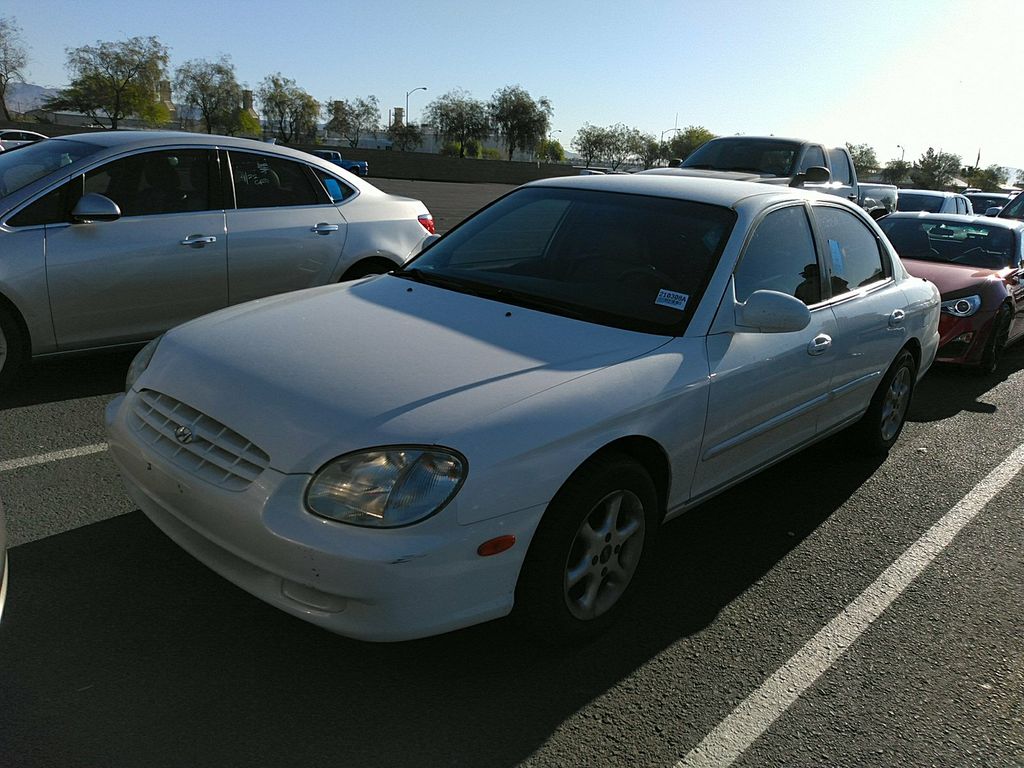
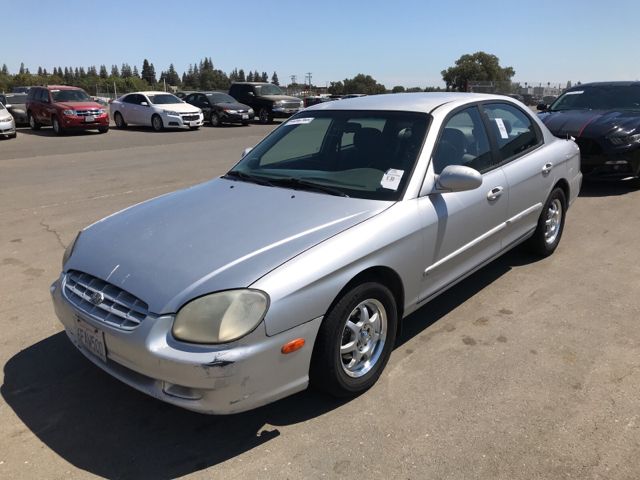
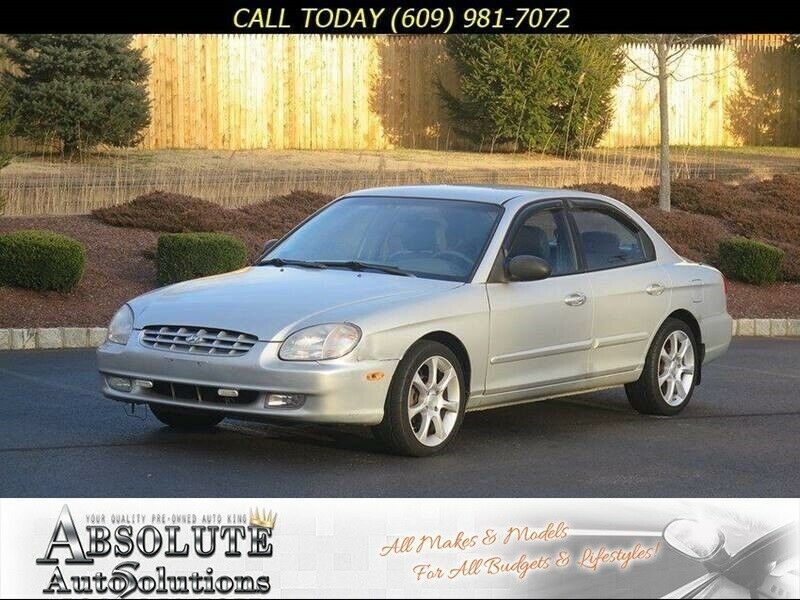
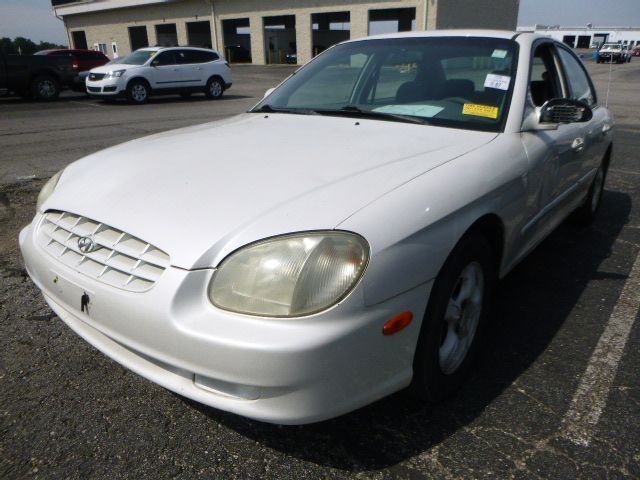
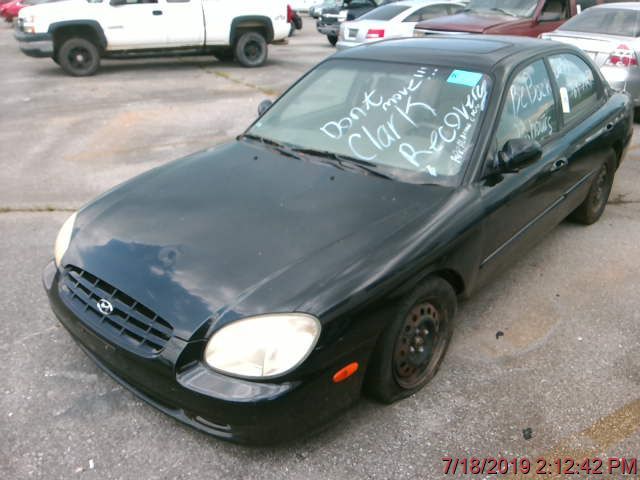
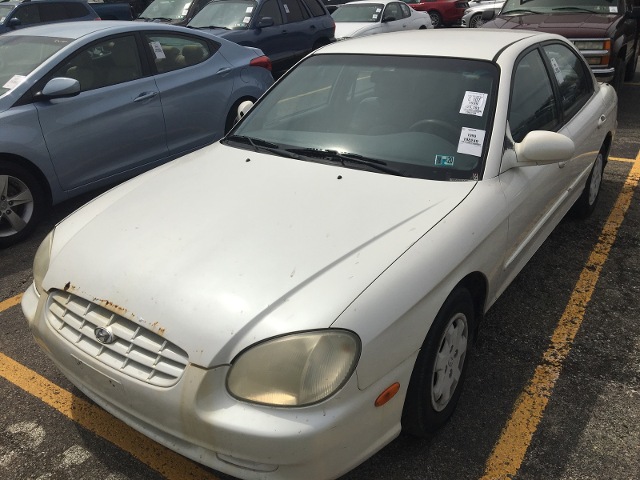
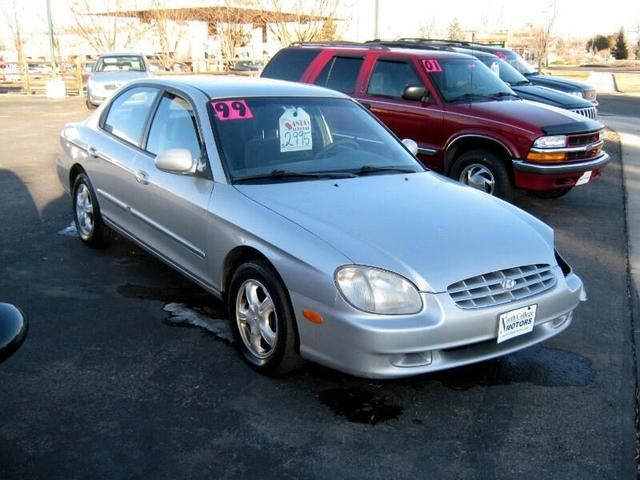
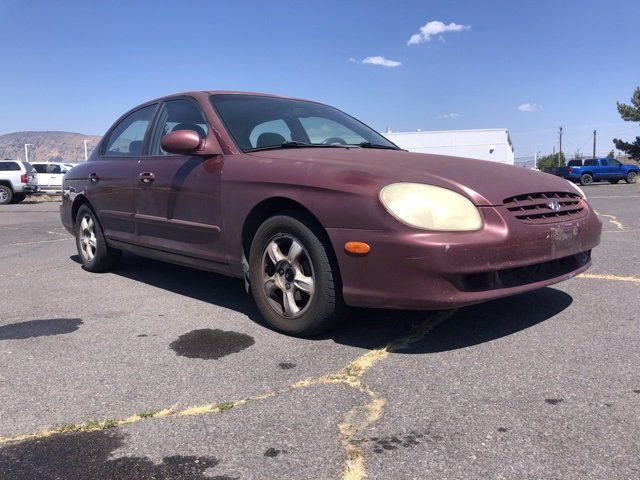
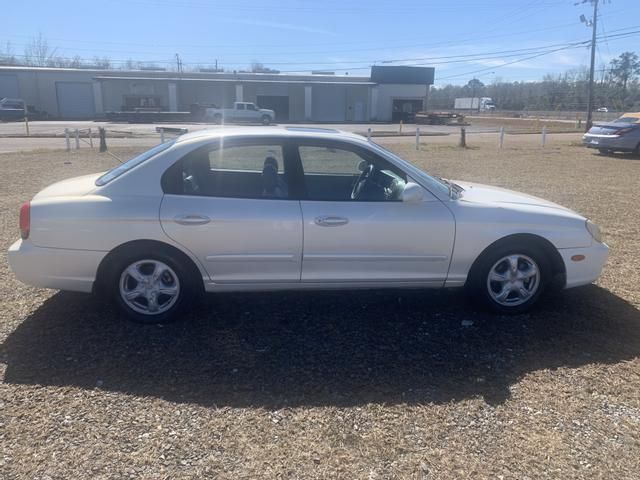
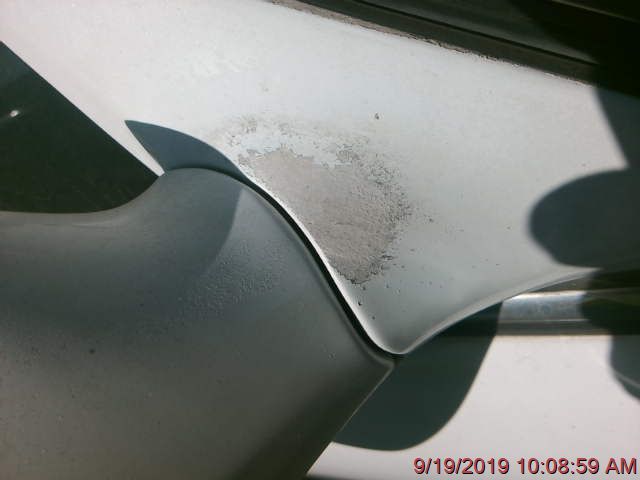
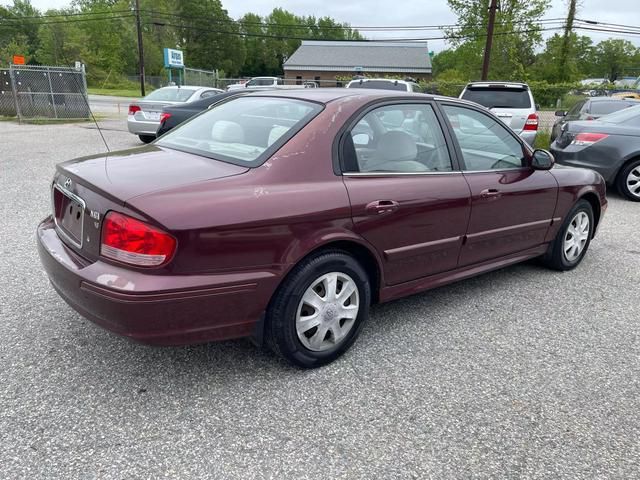
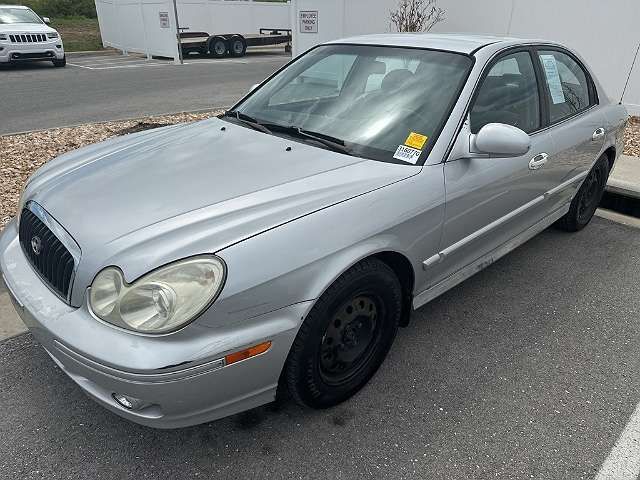
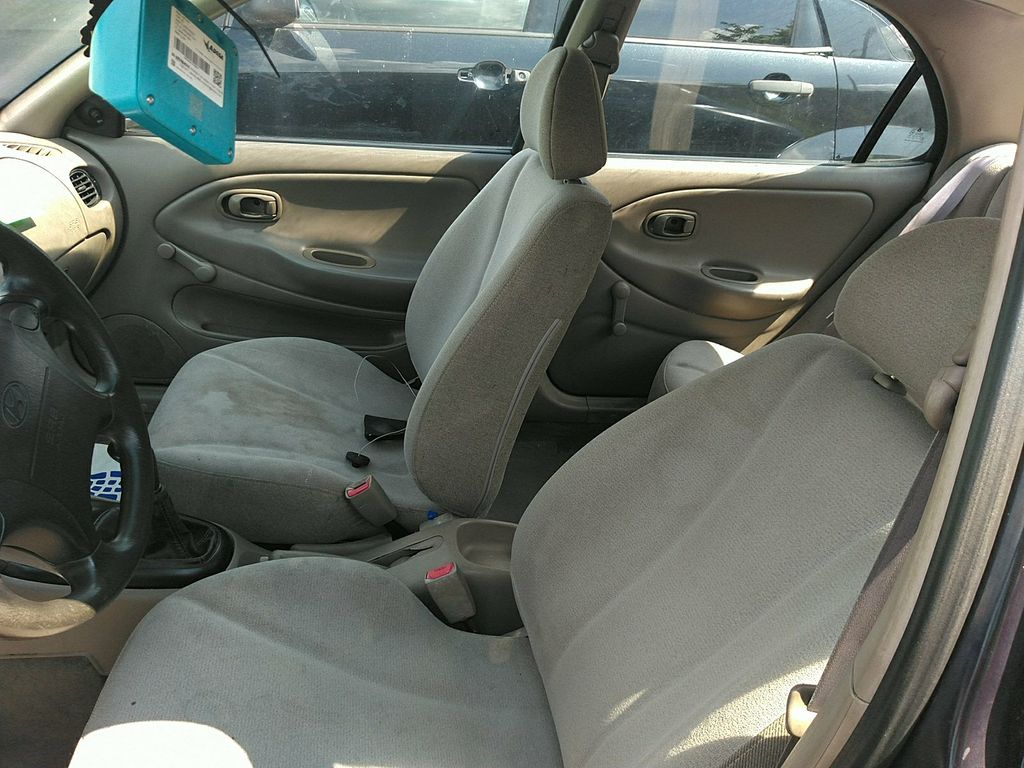
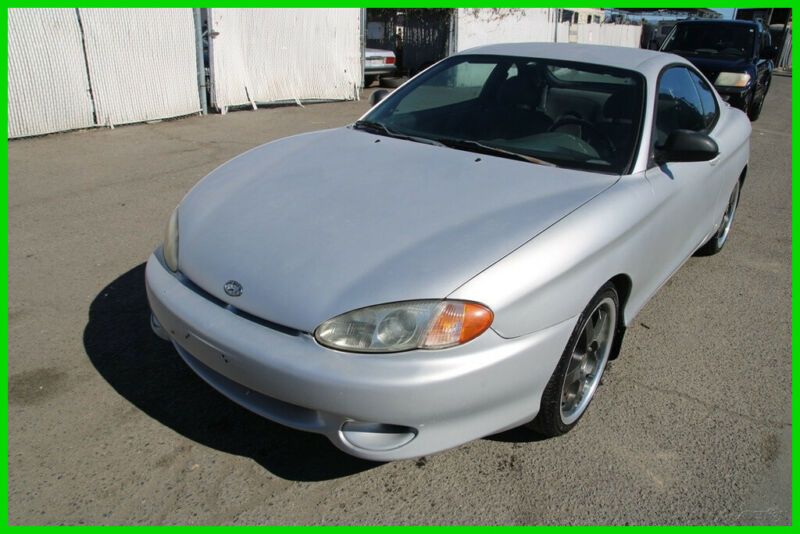
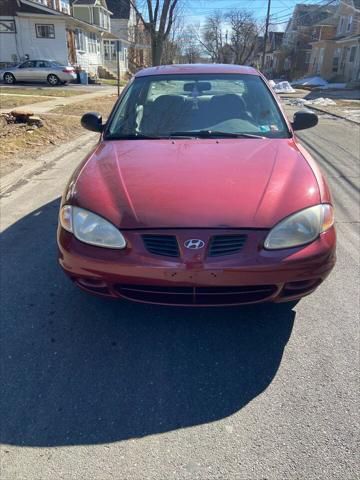
Photos
Pictures below are not fancy pictures from manufacturer catalog. It's all photos of real vehicles that were on sale on United States market. You can click on any picture to see specific vehicle and its VIN report.


The graph below is a depreciation curve for 1999 HYUNDAI SONATA. It shows how much this model looses per year in price. This analytics is calculated using sales records from BADVIN database.
The table below shows average price for used 1999 HYUNDAI SONATA in each year since the year of manufacturing, current year price and projected price in the future years.
You can scroll the table horizontally to see all columns.
| Year | Average Mileage | Average Price | % Left | % Lost | ||
|---|---|---|---|---|---|---|
| 1999 MSRP | 0 mi | $25,559 | — | — | 100% | 0% |
| 1999 | 10,286 mi | $29,626 | −$4,067 | −15.91% | 115.91% | -15.91% |
| 2000 | 20,572 mi | $23,943 | +$5,683 | +19.18% | 93.68% | 6.32% |
| 2001 | 30,858 mi | $23,395 | +$548 | +2.29% | 91.53% | 8.47% |
| 2002 | 41,144 mi | $20,999 | +$2,396 | +10.24% | 82.16% | 17.84% |
| 2003 | 51,430 mi | $20,267 | +$732 | +3.49% | 79.29% | 20.71% |
| → Visit 1999 HYUNDAI SONATA depreciation page to see full data. | ||||||
The graph below shows how mileage affects the price for 1999 HYUNDAI SONATA. This data was calculated using sales records from BADVIN database.
The table below shows average price for used 1999 HYUNDAI SONATA by mileage and number of sales.
You can scroll the table horizontally to see all columns.
| Mileage | Average Price | Sample Size |
|---|---|---|
| → Visit 1999 HYUNDAI SONATA depreciation page to see full data. | ||
Recent sales
BADVIN contain information about more than 60 sold 1999 HYUNDAI SONATA on US market. Below you may find some of recent sales with exact mileage and prices.
What's the difference between auctions and classifieds?Dealer and insurance auctions

138,539 mi
sold for $1,300
GA
a year ago
215,292 mi
sold for $500
FL
2 years ago
132,526 mi
sold for $900
NV
3 years ago
206,322 mi
sold for $300
CA
4 years ago
89,414 mi
sold for $450
NJ
5 years ago
176,620 mi
sold for $200
MO
5 years ago
97,833 mi
sold for $200
TN
5 years ago
125,783 mi
sold for $400
PA
5 years ago
Classifieds

97,564 mi
listed for $2,650
UT
9 months ago
97,564 mi
listed for $2,750
UT
9 months ago
122,821 mi
listed for $2,188
CO
a year ago
103,569 mi
listed for $3,950
NV
2 years ago
85,493 mi
listed for $4,995
AZ
3 years ago
85,493 mi
listed for $4,995
AZ
3 years ago
169,077 mi
listed for $1,800
GA
3 years ago
169,077 mi
listed for $1,800
GA
3 years ago
181,461 mi
listed for $998
OR
3 years ago

157,375 mi
listed for $3,999
OH
3 years ago
234,132 mi
listed for $2,699
AL
3 years ago
89,411 mi
listed for $2,000
NJ
4 years ago
Features and options
We've collected all possible options and features that you may find in sales listings for 1999 HYUNDAI SONATA and organized it in two lists.
- LEATHER
- SUN ROOF
- SUNROOF/MOONROOF
- WOOD TRIM
- 5 PASSENGER
- ABS
- ADJUSTABLE STEERING WHEEL
- AIR BAG
- AIR CONDITIONING
- AIRBAG FRONT LEFT
- AIRBAG FRONT RIGHT
- AM/FM/CD
- AM\FM\CASSETTE
- CD IN DASH
- CLOTH SEATS
- CRUISE CONTROL
- DUAL AIR BAGS
- ELECTRIC MIRRORS
- FOG LIGHTS
- HARD TOP
- HEATED MIRRORS
- JACK ASSEMBLY
- LF SIDE AIRBAG
- POWER BRAKES
- POWER DRIVER SEAT
- POWER LOCKS
- POWER MIRRORS
- POWER STEERING
- POWER WINDOWS
- REAR DEFOGGER
- REMOTE START
- RF SIDE AIRBAG
- ROOF TYPE: SUNROOF
- SEAT NONE
- SEAT TYPE - BUCKET
- SIDE FRONT AIR BAGS
- TILT WHEEL
- VINYL SEATS
- WARRANTY BOOK
Other years of HYUNDAI SONATA
1998 HYUNDAI SONATA
10+ sales records
2003 HYUNDAI SONATA
$4,150 average used price
1,500+ sales records
2005 HYUNDAI SONATA
$4,995 average used price
2,500+ sales records

2012 HYUNDAI SONATA
$8,495 average used price
52,100+ sales records

2013 HYUNDAI SONATA
$9,463 average used price
90,200+ sales records

2016 HYUNDAI SONATA
$12,158 average used price
104,900+ sales records
Similar Models
1998 HYUNDAI ELANTRA
$20,800 MSRP
30+ sales records
1999 HYUNDAI TIBURON
$8,790 MSRP
20+ sales records
1999 HYUNDAI ELANTRA
$20,800 MSRP
100+ sales records

2000 HYUNDAI TIBURON
$8,790 MSRP
90+ sales records

2001 HYUNDAI TIBURON
$8,790 MSRP
110+ sales records

2001 HYUNDAI XG
$8,900 MSRP
130+ sales records
Frequently asked questions
Some models may depreciate faster due to factors like lower demand, higher maintenance costs, or outdated technology compared to newer versions.
Crashed status, if reported, details past accidents and collisions, essential for evaluating the operational history and current state of the vehicle.
The last known odometer reading, if recorded, is noted in our reports, providing a snapshot of the vehicle's usage up to that point.
Mileage verification may confirm the vehicle's odometer reading, helping to check for fraud or tampering which can affect its value and performance, if data is accurate and complete.
Yes, in many cases, you can determine the type of drivetrain a vehicle has from its VIN if the manufacturer encodes this information within the VIN.
The parts content information on a window sticker shows the percentage of vehicle components sourced from specific countries, important for consumers interested in the origin of their vehicle's parts.
The report may provide details about regular maintenance and services performed on the vehicle vehicle, which is crucial for assessing its current condition, if such information is recorded.
Safety Recalls
With over 738,000 Hyundais sold annually in the U.S., up to 25% may have unaddressed safety recalls. A VIN check reveals any open recalls.
Accident History
Decoding the VIN uncovers any previous accident damage, flood damage, or other issues that could affect the safety and value of a used Hyundai.
Warranty Coverage
A VIN check confirms the original warranty details and remaining coverage, which is crucial for Hyundais known for their long warranties.


