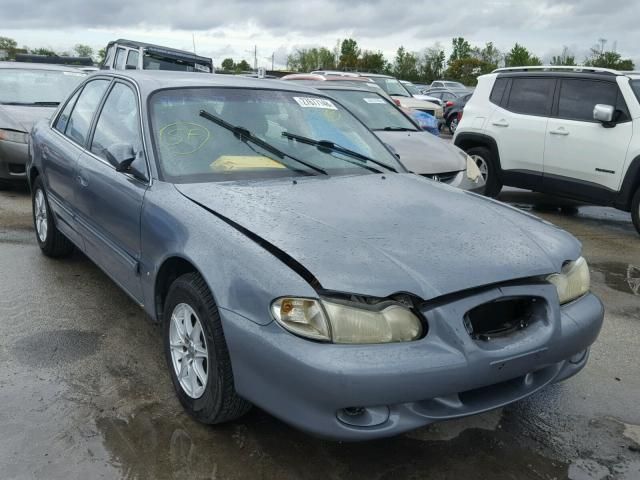
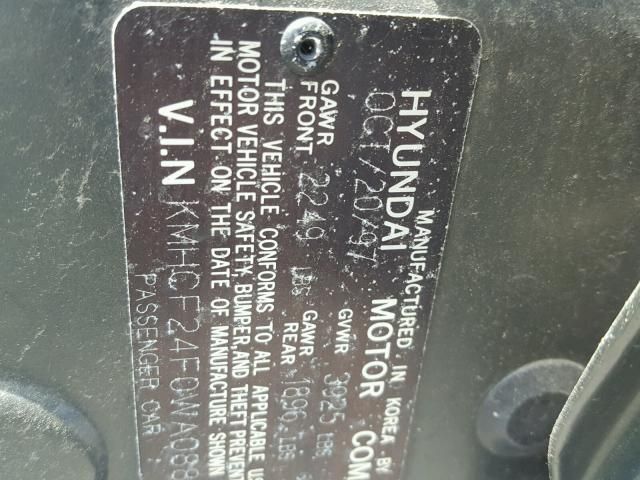
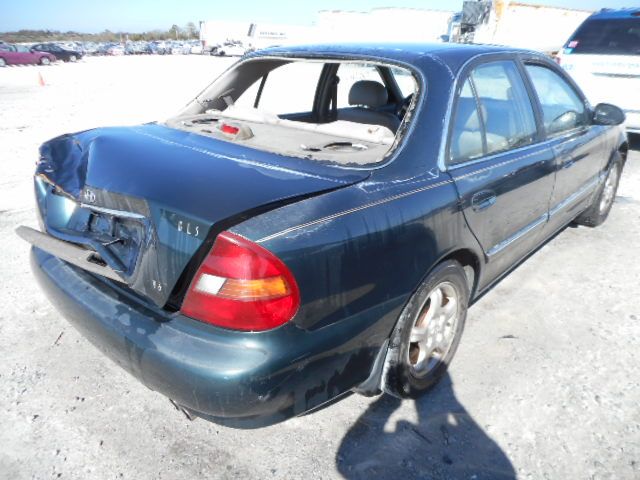
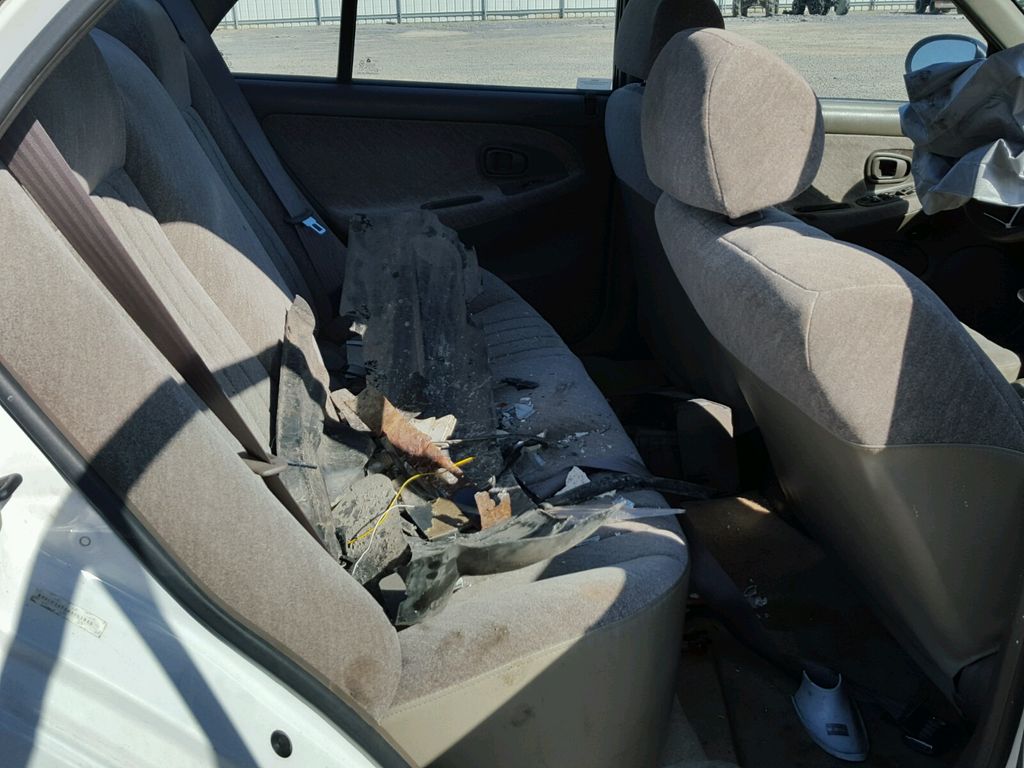
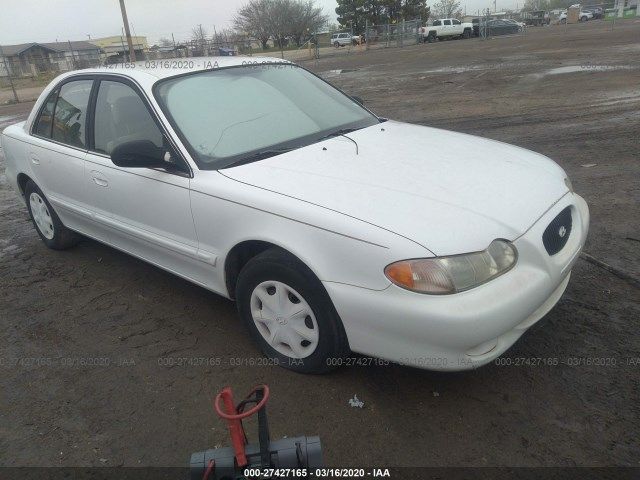
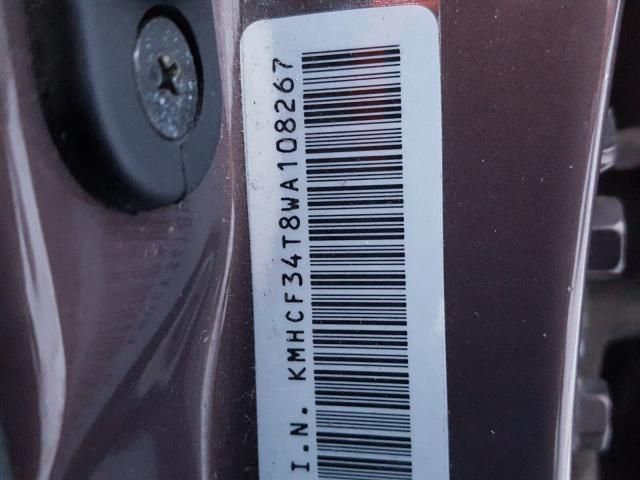
Photos
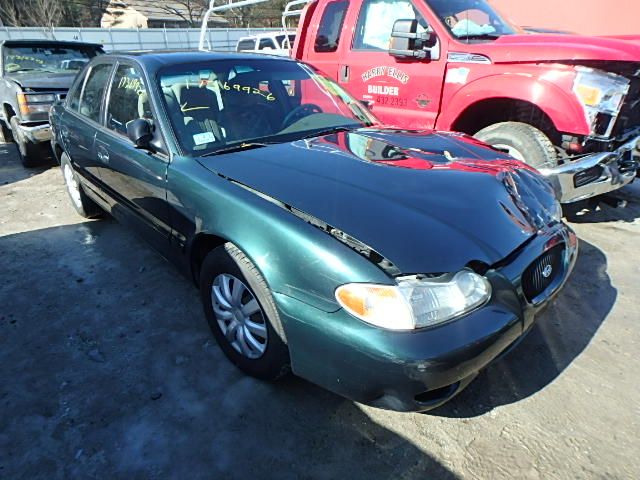
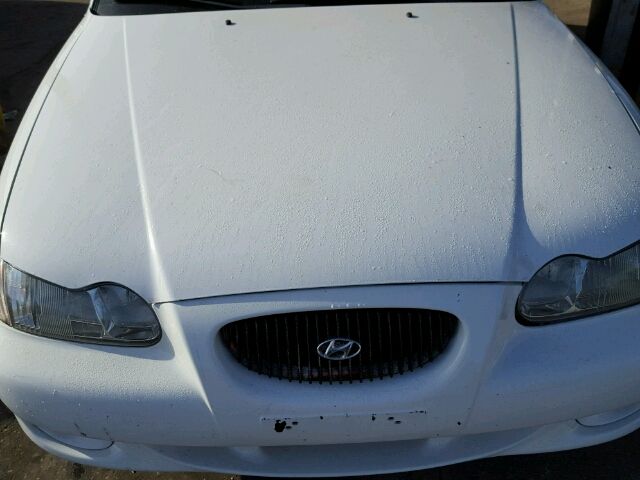
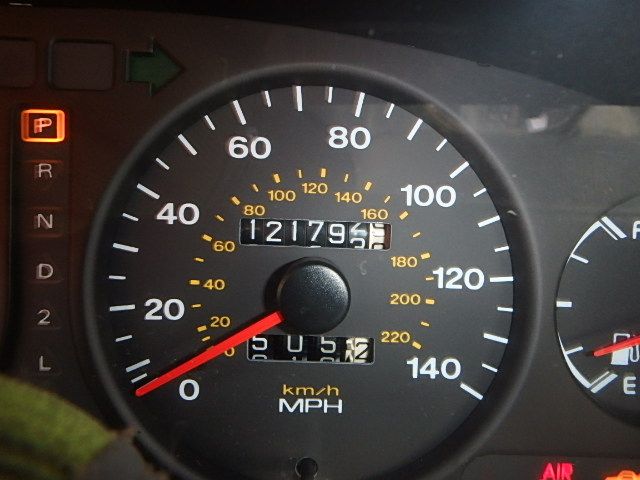
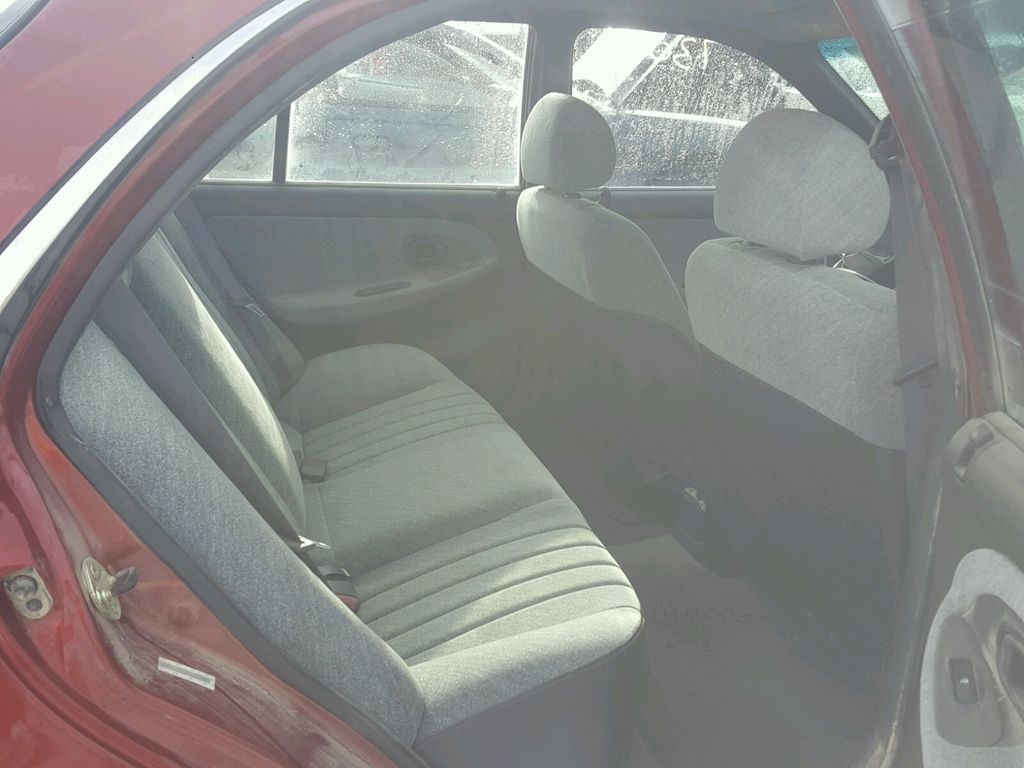
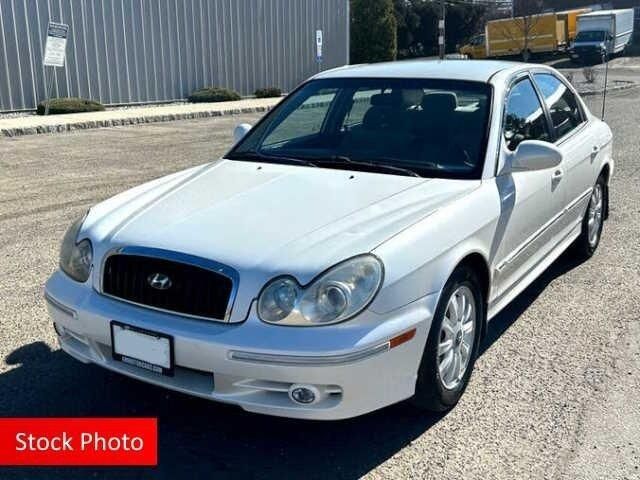
Pictures below are not fancy pictures from manufacturer catalog. It's all photos of real vehicles that were on sale on United States market. You can click on any picture to see specific vehicle and its VIN report.


The graph below is a depreciation curve for 1998 HYUNDAI SONATA. It shows how much this model looses per year in price. This analytics is calculated using sales records from BADVIN database.
The table below shows average price for used 1998 HYUNDAI SONATA in each year since the year of manufacturing, current year price and projected price in the future years.
You can scroll the table horizontally to see all columns.
| Year | Average Mileage | Average Price | % Left | % Lost | ||
|---|---|---|---|---|---|---|
| 1998 MSRP | 0 mi | $25,559 | — | — | 100% | 0% |
| 1998 | 10,286 mi | $29,626 | −$4,067 | −15.91% | 115.91% | -15.91% |
| 1999 | 20,572 mi | $23,943 | +$5,683 | +19.18% | 93.68% | 6.32% |
| 2000 | 30,858 mi | $23,395 | +$548 | +2.29% | 91.53% | 8.47% |
| 2001 | 41,144 mi | $20,999 | +$2,396 | +10.24% | 82.16% | 17.84% |
| 2002 | 51,430 mi | $20,267 | +$732 | +3.49% | 79.29% | 20.71% |
| → Visit 1998 HYUNDAI SONATA depreciation page to see full data. | ||||||
The graph below shows how mileage affects the price for 1998 HYUNDAI SONATA. This data was calculated using sales records from BADVIN database.
The table below shows average price for used 1998 HYUNDAI SONATA by mileage and number of sales.
You can scroll the table horizontally to see all columns.
| Mileage | Average Price | Sample Size |
|---|---|---|
| → Visit 1998 HYUNDAI SONATA depreciation page to see full data. | ||
Recent sales
BADVIN contain information about more than 10 sold 1998 HYUNDAI SONATA on US market. Below you may find some of recent sales with exact mileage and prices.
What's the difference between auctions and classifieds?Dealer and insurance auctions
119,909 mi
sold for $300
CA
5 years ago
Classifieds
108,731 mi
listed for $2,988
CO
20 days ago
Features and options
We've collected all possible options and features that you may find in sales listings for 1998 HYUNDAI SONATA and organized it in two lists.
- SUN ROOF
- 5 PASSENGER
- AIR CONDITIONING
- AIRBAG FRONT LEFT
- AIRBAG FRONT RIGHT
- AM\FM\CASS\CD
- CLOTH SEATS
- CRUISE CONTROL
- DUAL AIR BAGS
- POWER LOCKS
- POWER MIRRORS
- POWER STEERING
- POWER WINDOWS
- ROOF TYPE: SUNROOF
- TILT WHEEL
Other years of HYUNDAI SONATA

2001 HYUNDAI SONATA
240+ sales records

2013 HYUNDAI SONATA
$9,463 average used price
90,200+ sales records

2014 HYUNDAI SONATA
$9,999 average used price
49,500+ sales records

2015 HYUNDAI SONATA
$11,744 average used price
118,300+ sales records

2018 HYUNDAI SONATA
$14,998 average used price
102,700+ sales records

2019 HYUNDAI SONATA
$16,800 average used price
84,300+ sales records
Similar Models
1995 HYUNDAI ACCENT
$17,215 MSRP
20+ sales records
1996 HYUNDAI ACCENT
$17,215 MSRP
20+ sales records
1997 HYUNDAI TIBURON
$8,790 MSRP
20+ sales records

1997 HYUNDAI ELANTRA
$20,800 MSRP
20+ sales records

2001 HYUNDAI XG
$8,900 MSRP
130+ sales records

2001 HYUNDAI ELANTRA
$20,800 MSRP
$3,495 average used price
650+ sales records
Frequently asked questions
A VIN decoder is generally reliable for confirming the transmission type, as this information is encoded within the VIN by most manufacturers.
Accident reports might detail the occurrence, damage severity, and repairs, offering insights into the operational history of the vehicle, if such data is documented.
Mileage is considered a major factor in the depreciation of vehicles because it directly correlates with the amount of use and potential wear and tear the vehicle has undergone.
Factory warranty information, if available, covers drive train and safety systems as reported by vehicle, detailing the protection available for key vehicle components.
To find the correct VIN, check multiple locations where it is typically displayed, such as the dashboard, driver's door jamb, and vehicle registration documents, ensuring all instances match exactly.
The market value of a vehicle is calculated based on its historical depreciation trends, current condition, mileage, and market trends.
Refurbished status, if recorded, is detailed with information on parts replaced and upgrades made, affecting the resale value and reliability of the vehicle.
Safety Recalls
With over 738,000 Hyundais sold annually in the U.S., up to 25% may have unaddressed safety recalls. A VIN check reveals any open recalls.
Accident History
Decoding the VIN uncovers any previous accident damage, flood damage, or other issues that could affect the safety and value of a used Hyundai.
Warranty Coverage
A VIN check confirms the original warranty details and remaining coverage, which is crucial for Hyundais known for their long warranties.


