
BADVIN vehicle history report for
2013 HYUNDAI ELANTRAVIN: KMHDH4AE7DU906913
Get FULL ACCESS to the vehicle history report and see all blurred info.
⭐ Read 205+ reviews from our customers who used BADVIN to avoid buying junk vehicles.
Historical Records
events
Photos
10 images
Sales History
1 records
Market report
Price analytics
Historical Records
Historical records may include service and maintenance records, title status (clean, junk, salvage), insurance records, number of owners, registration events and states, and other information.
You can find more information about historical records in BADVIN reports and see more examples here.
Available historical records for VIN KMHDH4AE7DU906913
Latest reported mileage: 470 mi
Below you can see some examples of what these records could look like.
2022-12-01
2 years ago
123,611 mi
Vehicle serviced
Outer tie rod(s) replaced
Alignment performed
Outer tie rod(s) replaced
Alignment performed
2021-10-21
3 years ago
21,428 mi
Vehicle sold
MILEAGE INCONSISTENCY
MILEAGE INCONSISTENCY
2021-01-26
3 years ago
45,756 mi
Damage reported
Damage to front
Damage to front
Sale Record
| Year | 2013 |
| Title | Hidden text (Hidden text) |
| ODO | 4616 mi (Hidden text) |
| Damage | Hidden text |
| Estimated Retail Value | $7419 |
| Estimated Repair Cost | $3861 (487%) |
| Location | Ocala, FL, USA, 34470 |
| Date | ended 2 months ago |
| Sale Website Type | salvage or insurance auction |
sale information provided by user #829351


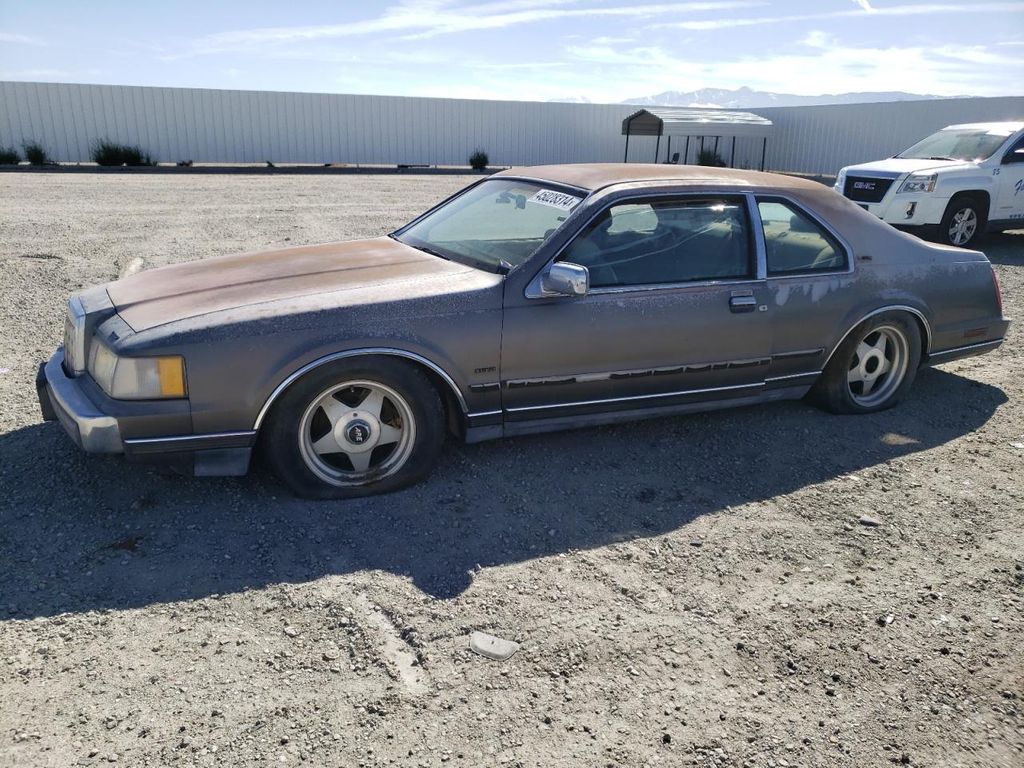
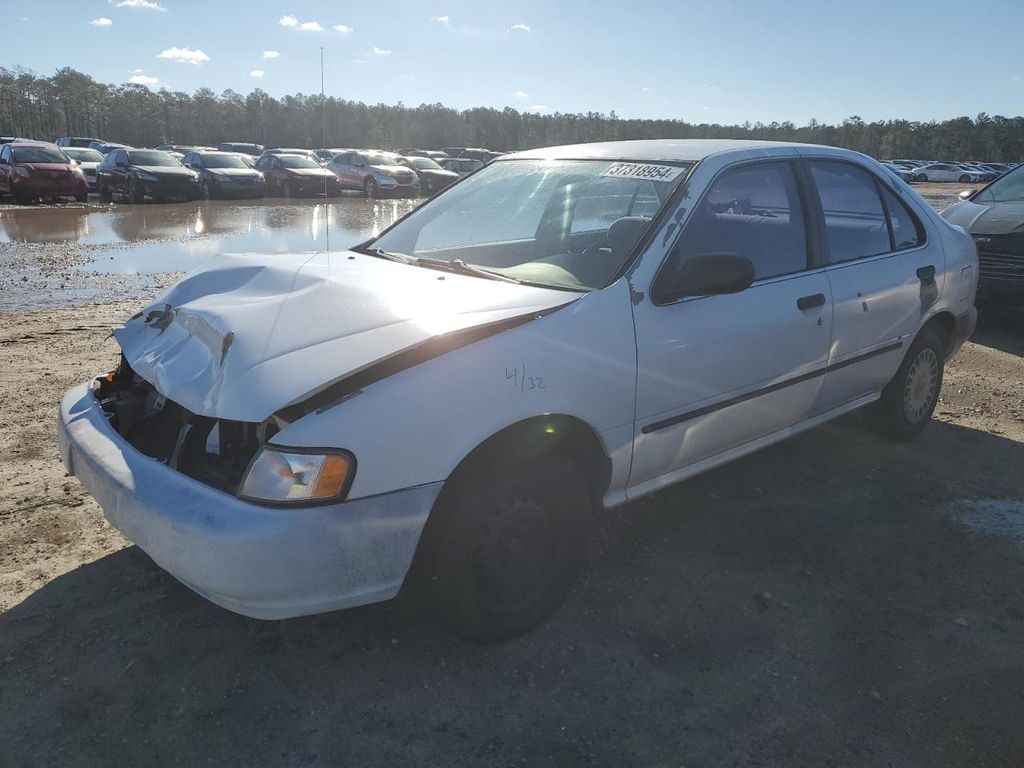
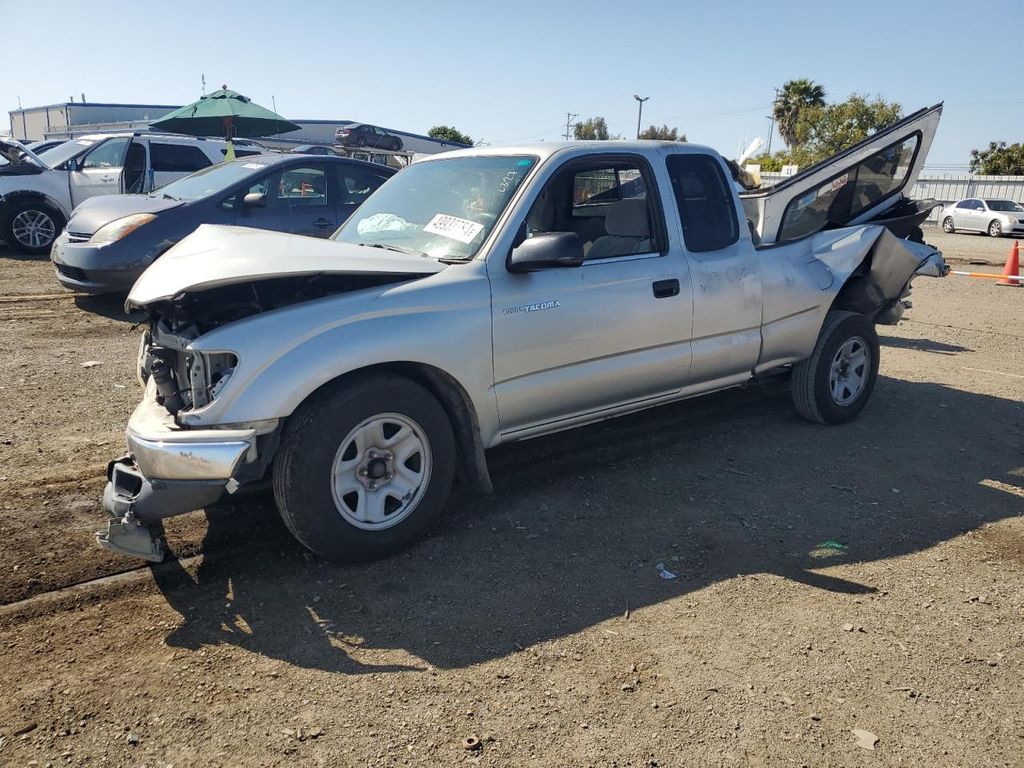
All photos above are REAL and display ACTUAL car. After you get the report you will see full resolution photos.
Tech Specs
| Color | SILVER |
| Transmission | AUTOMATIC |
| Engine | 1.8L |
| Cylinders | 4 |
| Drive | Front-wheel Drive |
| Fuel Type | GAS |
Model Analytics & Market Report
We've analyzed more than 114,200 sales records of this model and here are some numbers.
The average price for new (MSRP) 2013 HYUNDAI ELANTRA in 2013 was $20,800.
The average price for used 2013 HYUNDAI ELANTRA nowadays in 2024 is $8,991 which is 43% from the original price.
Estimated mileage driven per year is 10,128 miles.
For this model we also have depreciation curve, photos, list of features and options, and other analytics.
Take a look at 2013 HYUNDAI ELANTRA model page in BADVIN vehicles catalog.
Depreciation
The graph below is a depreciation curve for 2013 HYUNDAI ELANTRA. It shows how much this model looses per year in price. This analytics is calculated using sales records from BADVIN database.
The table below shows average price for used 2013 HYUNDAI ELANTRA in each year since the year of manufacturing, current year price and projected price in the future years.
You can scroll the table horizontally to see all columns.
| Year | Average Mileage | Average Price | % Left | % Lost | ||
|---|---|---|---|---|---|---|
| 2013 MSRP | 0 mi | $20,800 | — | — | 100% | 0% |
| 2013 | 10,128 mi | $22,990 | −$2,190 | −10.53% | 110.53% | -10.53% |
| 2014 | 20,256 mi | $21,675 | +$1,315 | +5.72% | 104.21% | -4.21% |
| 2015 | 30,384 mi | $19,998 | +$1,677 | +7.74% | 96.14% | 3.86% |
| 2016 | 40,512 mi | $18,987 | +$1,011 | +5.06% | 91.28% | 8.72% |
| 2017 | 50,640 mi | $15,988 | +$2,999 | +15.8% | 76.87% | 23.13% |
| → Visit 2013 HYUNDAI ELANTRA depreciation page to see full data. | ||||||
Price vs Mileage
The graph below shows how mileage affects the price for 2013 HYUNDAI ELANTRA. This data was calculated using sales records from BADVIN database.
The table below shows average price for used 2013 HYUNDAI ELANTRA by mileage and number of sales.
You can scroll the table horizontally to see all columns.
| Mileage | Average Price | Sample Size |
|---|---|---|
| 15,000 mi | $13,098 | 11 sales |
| 20,000 mi | $14,998 | 31 sales |
| 25,000 mi | $13,597 | 42 sales |
| 30,000 mi | $11,701 | 41 sales |
| 35,000 mi | $11,395 | 51 sales |
| 40,000 mi | $12,888 | 97 sales |
| → Visit 2013 HYUNDAI ELANTRA depreciation page to see full data. | ||
Get FULL ACCESS to the vehicle history report and see all blurred info.
⭐ Read 205+ reviews from our customers who used BADVIN to avoid buying junk vehicles.
Testimonials from our customers
I almost bought a 2019 Malibu that seemed like a great deal - low miles and price. But the badvin report showed it used to be a rental fleet vehicle, which the seller didn't disclose. Glad I found out before buying someone else's abused rental!

Benjamin Torres
verified on Trustpilot
I always rely on badvin to check out any used car before I buy. It gives such a complete history, including past accidents, service records, recalls and much more. Feel so much more confident as a used car shopper having this info.
Sofia Garcia
verified on Trustpilot
Bad Vin's vehicle history report showed that the 2018 Audi A4 I was about to buy had been in a major accident that was not disclosed by the seller. The severity analysis helped me avoid a bad purchase. Great service!
Sophie Dubois
verified on Trustpilot
Report showed a car I was considering had a prior salvage title from a major accident, even though carfax listed it as clean. Messaged seller asking about it and they made shady excuses. Def avoided a scam thanks to badvin!
Mia Johnson
verified on Trustpilot
Compare to other 2013 HYUNDAI ELANTRA


2020 HYUNDAI ELANTRA
in 5 days, 56,878 mi
est retail value $17,717
buy now price $4,900
VIN KMHD84LF2LU905494


2015 HYUNDAI ELANTRA
16 days ago, 79,876 mi
est retail value $12,213
buy now price $1,000
VIN 5NPDH4AE0FH621620


2020 HYUNDAI ELANTRA
18 days ago, 50,492 mi
est retail value $22,198
buy now price $2,250
VIN 5NPD84LF3LH557722
Other vehicles sales records


2017 FORD F-150
2 months ago, 85,536 mi
est retail value $23,777
buy now price $5,900
VIN 1FTEW1C82HKD32842


Frequently asked questions
A VIN alone does not typically provide fuel economy details directly; however, it can identify the vehicle model and engine type, which you can cross-reference with fuel economy data from other sources.
Our reports might include a service history, from oil changes to major overhauls, which can help you gauge the upkeep and condition of the 2013 HYUNDAI ELANTRA, depending on the records available.
Our reports may include photos from previous sales, offering a visual history that helps assess the 2013 HYUNDAI vehicle’s condition over time, if such photos are available.
Results and dates of safety inspections performed may be included in our reports, ensuring you know the safety status of the 2013 HYUNDAI vehicle, if inspections have been reported.
Frame damage can indicate severe impacts and is critical to the structural integrity and safety of the 2013 HYUNDAI vehicle, if such damage is documented.
The frequency of oil changes, a crucial aspect of vehicle maintenance, might be documented in the service history section of our reports, if records are available.
In 2013 HYUNDAI vehicles, the part of the VIN that provides information about the engine type is typically one of the middle characters, which varies by manufacturer.
A 'clean title' generally indicates that the vehicle has not been significantly damaged in the past and has no history of major incidents such as salvage or theft, if such information is documented.
New vehicles often depreciate quickly due to rapid advancements in technology and consumer preference for the latest features, which make older models less desirable.


