
BADVIN vehicle history report for
2013 HYUNDAI ELANTRAVIN: KMHDH4AE6DU742022
Get FULL ACCESS to the vehicle history report and see all blurred info.
⭐ Read 206+ reviews from our customers who used BADVIN to avoid buying junk vehicles.
Historical Records
events
Photos
8 images
Sales History
1 records
Sale Prices
1 records
Market report
Price analytics
Historical Records
Historical records may include service and maintenance records, title status (clean, junk, salvage), insurance records, number of owners, registration events and states, and other information.
You can find more information about historical records in BADVIN reports and see more examples here.
Available historical records for VIN KMHDH4AE6DU742022
Latest reported mileage: 232 mi
Below you can see some examples of what these records could look like.
2022-10-24
2 years ago
56,448 mi
Vehicle sold
MILEAGE INCONSISTENCY
MILEAGE INCONSISTENCY
2022-07-14
2 years ago
10,103 mi
REBUILT TITLE ISSUED
2019-12-06
5 years ago
41,609 mi
TOTAL LOSS VEHICLE
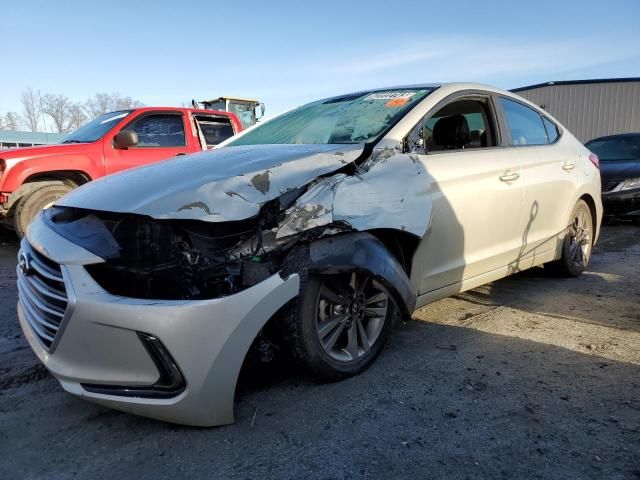
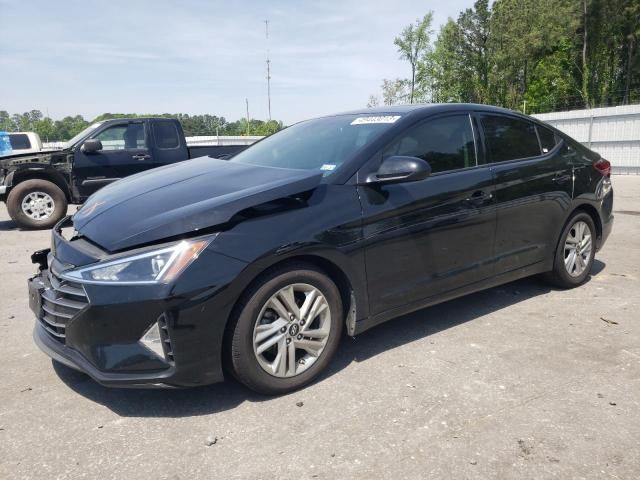
Collision damage reported
Collision damage reported
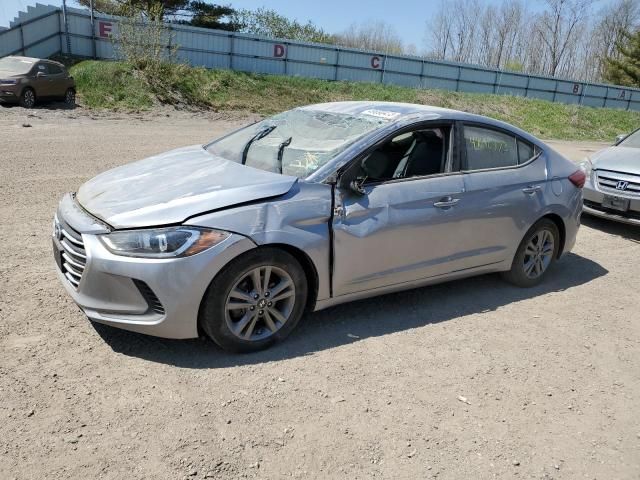
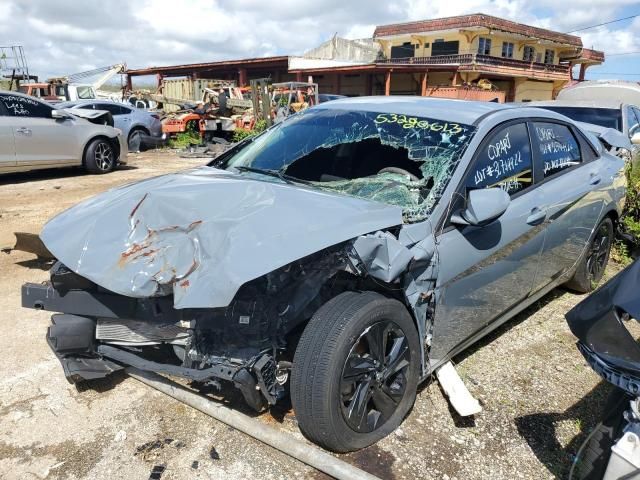
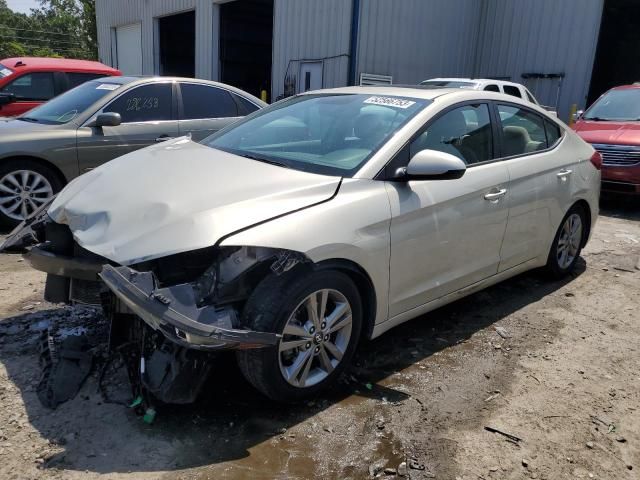
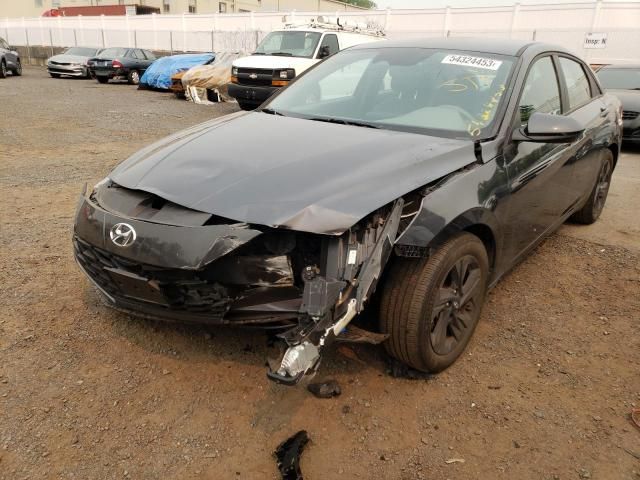
2013 HYUNDAI ELANTRA GLS
sold
| Year | 2013 |
| Title | Hidden text (Hidden text) |
| ODO | 4725 mi (Hidden text) |
| Damage | Hidden text, Hidden text |
| Estimated Retail Value | $9630 |
| Estimated Repair Cost | $9328 (925%) |
| Location | Abilene, TX, 79605 |
| Date | ended 2 years ago |
| Sale Website Type | salvage or insurance auction |
| Notes | |
| Hidden text | |
sale information provided by user #65057


All photos above are REAL and display ACTUAL car. After you get the report you will see full resolution photos.
Tech Specs
| Color | SILVER |
| Transmission | AUTOMATIC |
| Engine | 1.8L 4 |
| Drive | Front-wheel Drive |
| Fuel Type | GAS |
Model Analytics & Market Report
We've analyzed more than 114,200 sales records of this model and here are some numbers.
The average price for new (MSRP) 2013 HYUNDAI ELANTRA in 2013 was $20,800.
The average price for used 2013 HYUNDAI ELANTRA nowadays in 2024 is $8,991 which is 43% from the original price.
Estimated mileage driven per year is 10,128 miles.
For this model we also have depreciation curve, photos, list of features and options, and other analytics.
Take a look at 2013 HYUNDAI ELANTRA model page in BADVIN vehicles catalog.
Depreciation
The graph below is a depreciation curve for 2013 HYUNDAI ELANTRA. It shows how much this model looses per year in price. This analytics is calculated using sales records from BADVIN database.
The table below shows average price for used 2013 HYUNDAI ELANTRA in each year since the year of manufacturing, current year price and projected price in the future years.
You can scroll the table horizontally to see all columns.
| Year | Average Mileage | Average Price | % Left | % Lost | ||
|---|---|---|---|---|---|---|
| 2013 MSRP | 0 mi | $20,800 | — | — | 100% | 0% |
| 2013 | 10,128 mi | $22,990 | −$2,190 | −10.53% | 110.53% | -10.53% |
| 2014 | 20,256 mi | $21,675 | +$1,315 | +5.72% | 104.21% | -4.21% |
| 2015 | 30,384 mi | $19,998 | +$1,677 | +7.74% | 96.14% | 3.86% |
| 2016 | 40,512 mi | $18,987 | +$1,011 | +5.06% | 91.28% | 8.72% |
| 2017 | 50,640 mi | $15,988 | +$2,999 | +15.8% | 76.87% | 23.13% |
| → Visit 2013 HYUNDAI ELANTRA depreciation page to see full data. | ||||||
Price vs Mileage
The graph below shows how mileage affects the price for 2013 HYUNDAI ELANTRA. This data was calculated using sales records from BADVIN database.
The table below shows average price for used 2013 HYUNDAI ELANTRA by mileage and number of sales.
You can scroll the table horizontally to see all columns.
| Mileage | Average Price | Sample Size |
|---|---|---|
| 15,000 mi | $13,098 | 11 sales |
| 20,000 mi | $14,998 | 31 sales |
| 25,000 mi | $13,597 | 42 sales |
| 30,000 mi | $11,701 | 41 sales |
| 35,000 mi | $11,395 | 51 sales |
| 40,000 mi | $12,888 | 97 sales |
| → Visit 2013 HYUNDAI ELANTRA depreciation page to see full data. | ||
Get FULL ACCESS to the vehicle history report and see all blurred info.
⭐ Read 206+ reviews from our customers who used BADVIN to avoid buying junk vehicles.
Testimonials from our customers
As a car dealer importing vehicles from the US to Mexico, I rely on badvin for comprehensive history reports before bidding at auctions. Their info has helped me avoid several salvage vehicles and is more thorough than carfax. A must-have service!

Javier Ramirez
verified on Trustpilot
I've tried a bunch of different vehicle history reports over the years and badvin.org has been the most comprehensive by far. Stuff like service records, ownership history, lien and repo info that I haven't found elsewhere. Def go-to resource when shopping for used vehicles now.
Levi Johnson
verified on Trustpilot
I always rely on badvin to check out any used car before I buy. It gives such a complete history, including past accidents, service records, recalls and much more. Feel so much more confident as a used car shopper having this info.
Sofia Garcia
verified on Trustpilot
Purchased a badvin report before buying a used Lexus RX 350. It revealed a minor accident the seller hadn't mentioned. I still bought the car but used the info to negotiate a lower price. Well worth the cost for the leverage it gave me!
Aiden Patel
verified on Trustpilot
Compare to other 2013 HYUNDAI ELANTRA

2016 HYUNDAI ELANTRA
in 3 days, 92,653 mi
est retail value $10,463
buy now price $2,400
VIN 5NPDH4AE0GH776220


Other vehicles sales records

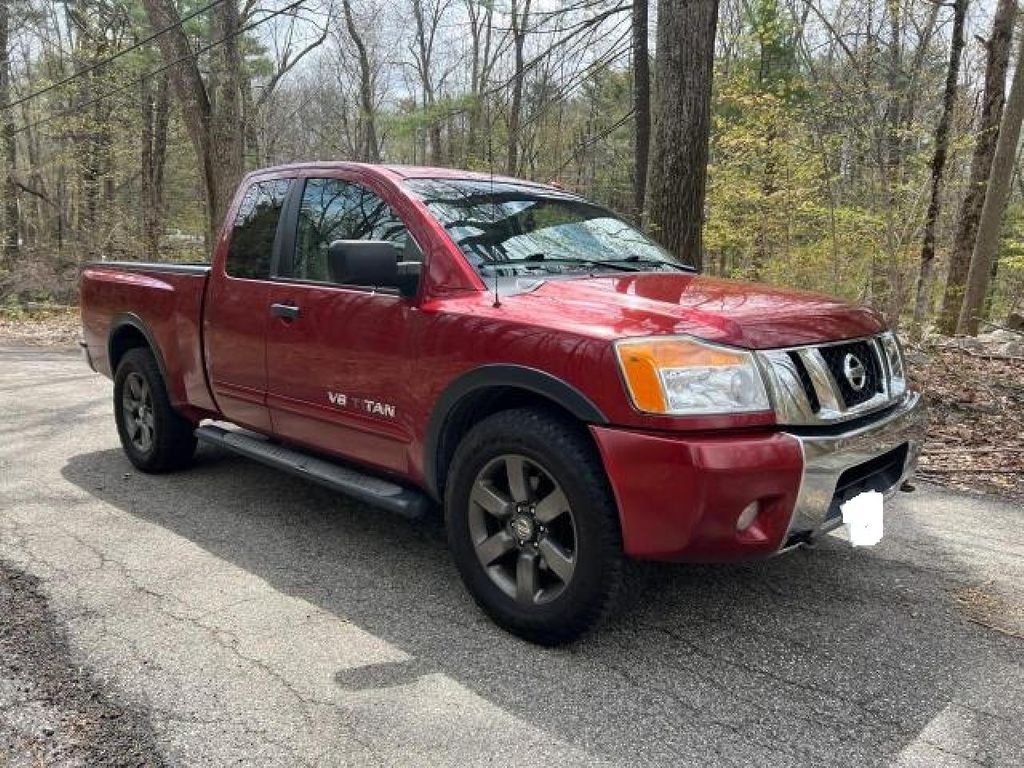

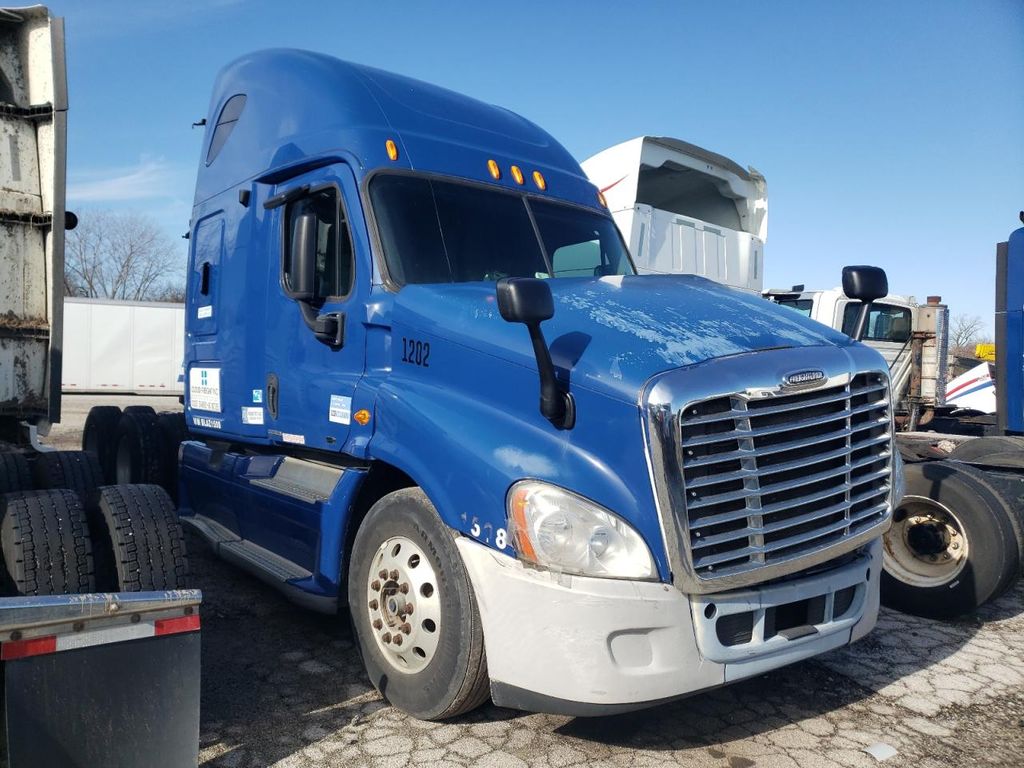
2011 FREIGHTLINER ALL OTHER
in 2 days, 668,674 mi
est retail value $26,875
buy now price $3,950
VIN 1FUJGLDR6BLAZ1508


2021 TESLA MODEL 3
in 2 days, 160,186 mi
est retail value $31,422
buy now price $12,700
VIN 5YJ3E1EA2MF973930
Frequently asked questions
Understanding depreciation is important for car owners to manage financial expectations and make informed decisions about selling or trading in their vehicles at the right time.
Car depreciation is the decrease in value of a vehicle over time. It's a crucial factor to consider when calculating the total cost of vehicle ownership.
On average, a new car can depreciate by approximately 23% after the first year, reflecting the premium paid for new technology and immediate depreciation once it's considered used.
The last six digits of a VIN are the vehicle's unique serial number, which identifies the specific unit among others from the same model and production line.
The expected depreciation of a vehicle after three years can vary, but generally, cars lose a significant portion of their value within the first few years.
Our reports may track major service milestones such as brake rotor replacements, detailing when and how often they have occurred, if this information is recorded.


