BADVIN vehicle history report for
2013 HYUNDAI ELANTRAVIN: KMHDH4AE0DU889694
Get FULL ACCESS to the vehicle history report and see all blurred info.
⭐ Read 205+ reviews from our customers who used BADVIN to avoid buying junk vehicles.
Historical Records
events
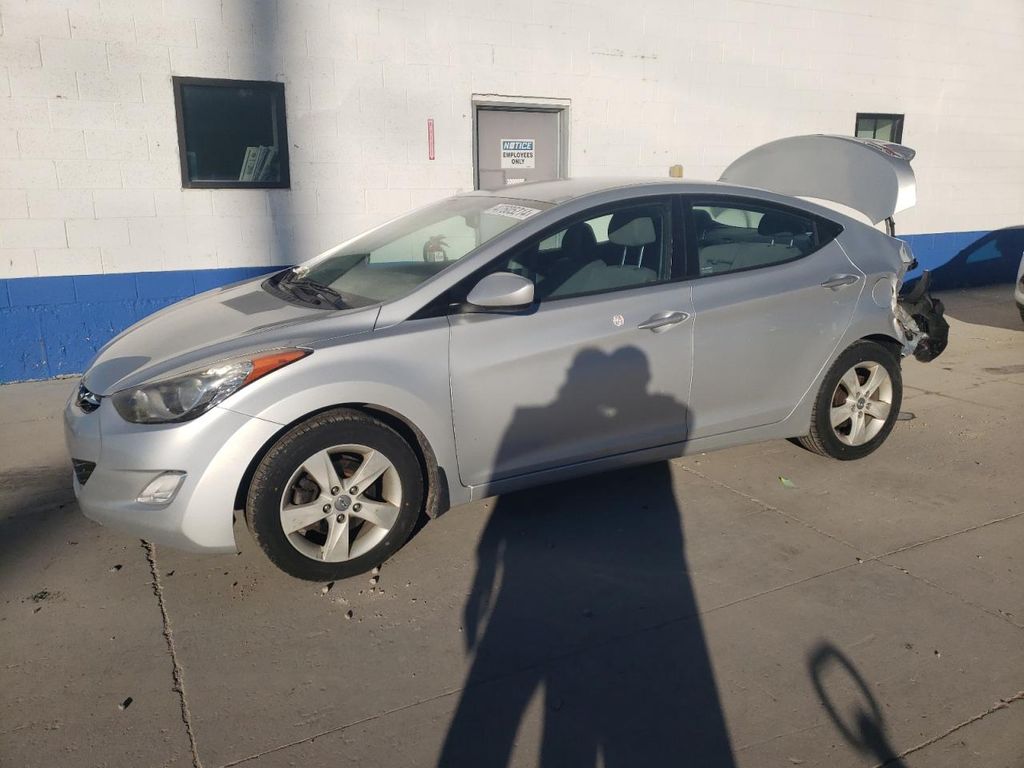
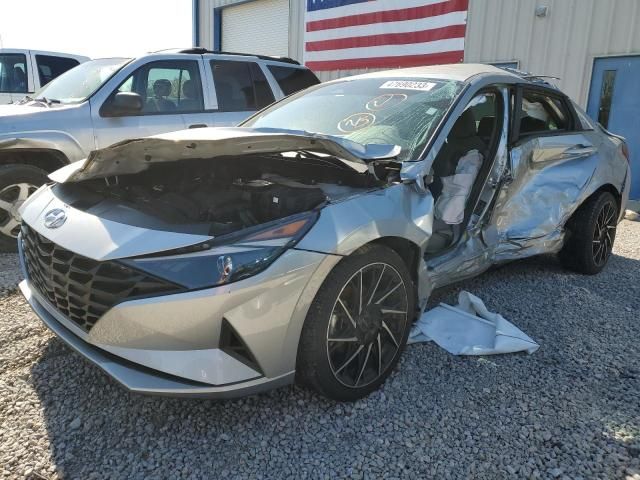
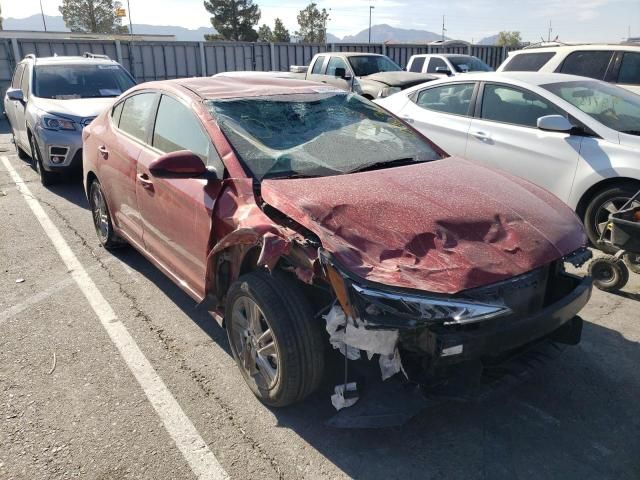
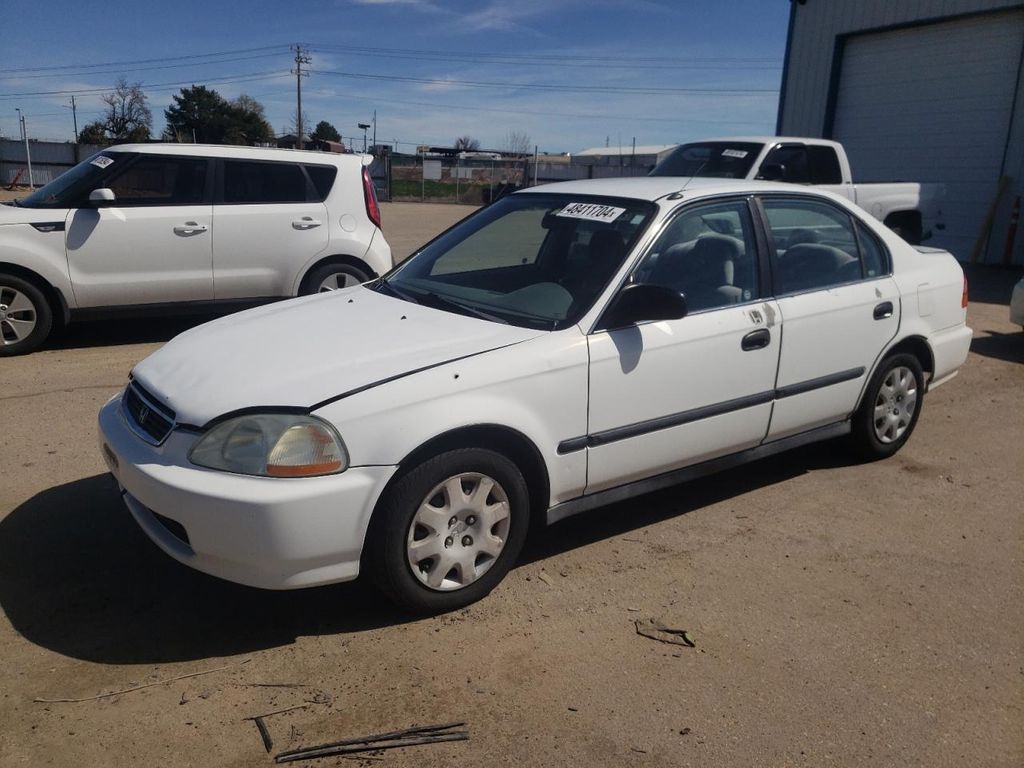
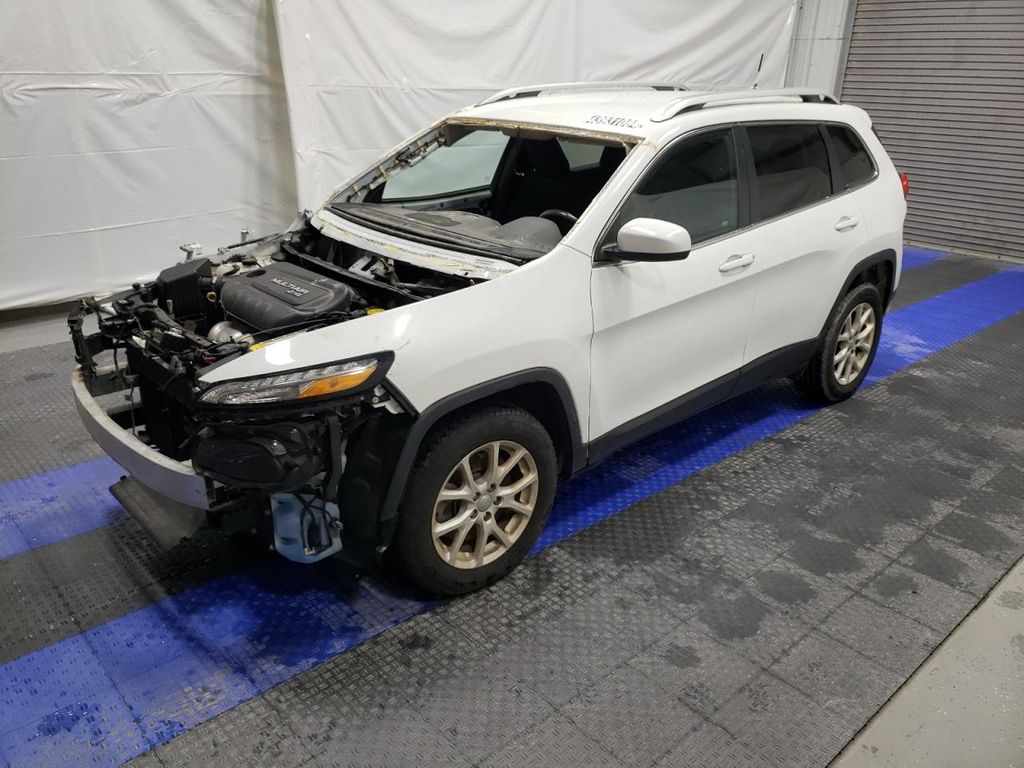
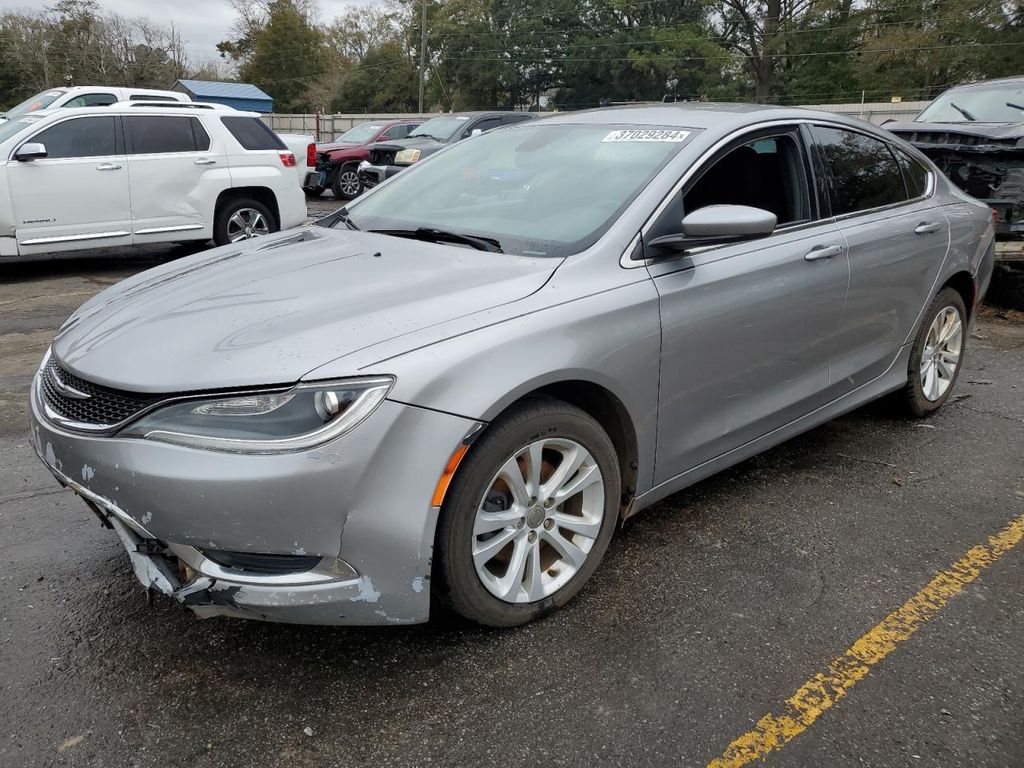
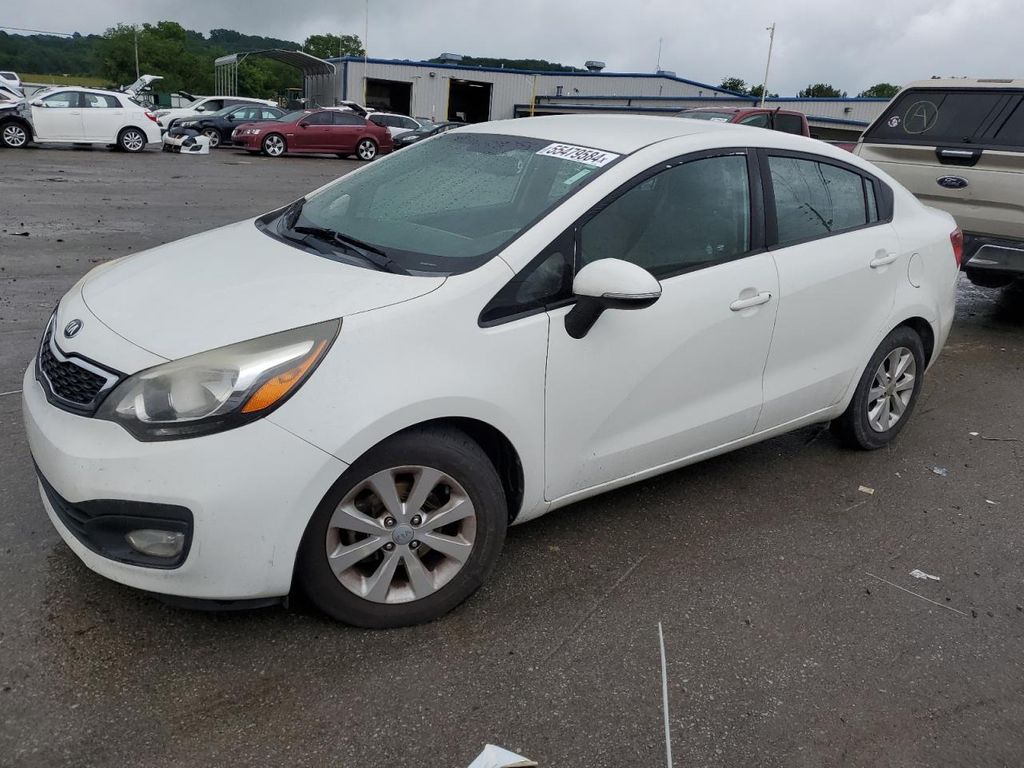
Photos
10 images
Sales History
1 records
Market report
Price analytics
Historical Records
Historical records may include service and maintenance records, title status (clean, junk, salvage), insurance records, number of owners, registration events and states, and other information.
You can find more information about historical records in BADVIN reports and see more examples here.
Available historical records for VIN KMHDH4AE0DU889694
Latest reported mileage: 619 mi
Below you can see some examples of what these records could look like.
2023-07-17
a year ago
46,539 mi
Damage reported
Damage to front
Damage to front
2022-04-04
2 years ago
22,194 mi
REBUILT TITLE ISSUED
2021-08-24
3 years ago
45,623 mi
Duplicate title issued
REBUILT TITLE ISSUED
REBUILT TITLE ISSUED
Sale Record
| Year | 2013 |
| Title | Hidden text (Hidden text) |
| ODO | 3643 mi (Hidden text) |
| Damage | Hidden text |
| Estimated Retail Value | $6675 |
| Location | FARR WEST, UT, USA |
| Date | ended 15 days ago |
| Sale Website Type | salvage or insurance auction |
sale information provided by user #425714


All photos above are REAL and display ACTUAL car. After you get the report you will see full resolution photos.
Tech Specs
| Color | SILVER |
| Transmission | AUTOMATIC |
| Engine | 1.8L |
| Cylinders | 4 |
| Drive | Front-wheel Drive |
| Fuel Type | GAS |
Model Analytics & Market Report
We've analyzed more than 114,200 sales records of this model and here are some numbers.
The average price for new (MSRP) 2013 HYUNDAI ELANTRA in 2013 was $20,800.
The average price for used 2013 HYUNDAI ELANTRA nowadays in 2024 is $8,991 which is 43% from the original price.
Estimated mileage driven per year is 10,128 miles.
For this model we also have depreciation curve, photos, list of features and options, and other analytics.
Take a look at 2013 HYUNDAI ELANTRA model page in BADVIN vehicles catalog.
Depreciation
The graph below is a depreciation curve for 2013 HYUNDAI ELANTRA. It shows how much this model looses per year in price. This analytics is calculated using sales records from BADVIN database.
The table below shows average price for used 2013 HYUNDAI ELANTRA in each year since the year of manufacturing, current year price and projected price in the future years.
You can scroll the table horizontally to see all columns.
| Year | Average Mileage | Average Price | % Left | % Lost | ||
|---|---|---|---|---|---|---|
| 2013 MSRP | 0 mi | $20,800 | — | — | 100% | 0% |
| 2013 | 10,128 mi | $22,990 | −$2,190 | −10.53% | 110.53% | -10.53% |
| 2014 | 20,256 mi | $21,675 | +$1,315 | +5.72% | 104.21% | -4.21% |
| 2015 | 30,384 mi | $19,998 | +$1,677 | +7.74% | 96.14% | 3.86% |
| 2016 | 40,512 mi | $18,987 | +$1,011 | +5.06% | 91.28% | 8.72% |
| 2017 | 50,640 mi | $15,988 | +$2,999 | +15.8% | 76.87% | 23.13% |
| → Visit 2013 HYUNDAI ELANTRA depreciation page to see full data. | ||||||
Price vs Mileage
The graph below shows how mileage affects the price for 2013 HYUNDAI ELANTRA. This data was calculated using sales records from BADVIN database.
The table below shows average price for used 2013 HYUNDAI ELANTRA by mileage and number of sales.
You can scroll the table horizontally to see all columns.
| Mileage | Average Price | Sample Size |
|---|---|---|
| 15,000 mi | $13,098 | 11 sales |
| 20,000 mi | $14,998 | 31 sales |
| 25,000 mi | $13,597 | 42 sales |
| 30,000 mi | $11,701 | 41 sales |
| 35,000 mi | $11,395 | 51 sales |
| 40,000 mi | $12,888 | 97 sales |
| → Visit 2013 HYUNDAI ELANTRA depreciation page to see full data. | ||
Get FULL ACCESS to the vehicle history report and see all blurred info.
⭐ Read 205+ reviews from our customers who used BADVIN to avoid buying junk vehicles.
Testimonials from our customers
BadVin's vehicle history report is a must-have before buying any used vehicle. It's saved me from a few lemons over the years - cars that looked great on the surface but had hidden issues like accidents or title problems. Well worth the price.

Camila Santos
verified on Trustpilot
I've tried a bunch of different vehicle history reports over the years and badvin.org has been the most comprehensive by far. Stuff like service records, ownership history, lien and repo info that I haven't found elsewhere. Def go-to resource when shopping for used vehicles now.
Levi Johnson
verified on Trustpilot
Was shopping for a used Range Rover and found one that seemed suspiciously cheap. The badVIN report revealed it had been in a major front end collision, with photos showing the damage. Steered clear of that one and saved myself a ton of headaches!!
Ava Patel
verified on Trustpilot
I almost bought a 2019 Malibu that seemed like a great deal - low miles and price. But the badvin report showed it used to be a rental fleet vehicle, which the seller didn't disclose. Glad I found out before buying someone else's abused rental!
Benjamin Torres
verified on Trustpilot
Compare to other 2013 HYUNDAI ELANTRA


2020 HYUNDAI ELANTRA
in 5 days, 56,878 mi
est retail value $17,717
buy now price $4,900
VIN KMHD84LF2LU905494


2020 HYUNDAI ELANTRA
18 days ago, 50,492 mi
est retail value $22,198
buy now price $2,250
VIN 5NPD84LF3LH557722


2019 HYUNDAI ELANTRA
in 6 days, 30,301 mi
est retail value $21,846
buy now price $3,000
VIN 5NPD84LFXKH497257

Other vehicles sales records
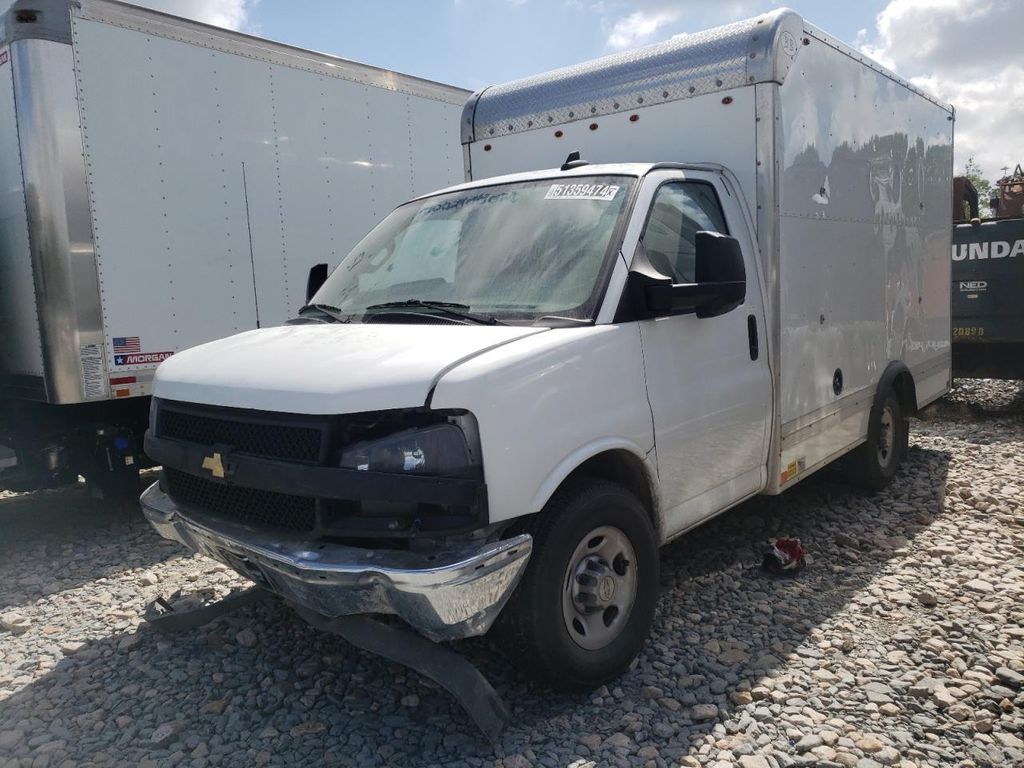
2022 CHEVROLET EXPRESS
in 3 days, 38,477 mi
est retail value $37,100
buy now price $15,000
VIN 1GB0GRF71N1219611

2012 FORD F450
in 2 days, 224,953 mi
est retail value $19,340
buy now price $1,600
VIN 1FDUF4HY2CED10705

2016 CHRYSLER 200
in 2 days, 174,212 mi
est retail value $7,106
buy now price $750
VIN 1C3CCCAB4GN154847


2022 CHEVROLET EXPRESS
in 2 days, 1 mi
est retail value $23,250
buy now price $3,700
VIN 1GCWGAFP7N1243788

2012 GMC SIERRA
in 2 days, 248,277 mi
est retail value $7,692
buy now price $1,500
VIN 1GTR1VE03CZ126962

Frequently asked questions
The manufacturing location can be interpreted from the first character of the VIN, which indicates the country of assembly, and sometimes more specific location details are included in the first few characters.
Our reports may include information on any past recalls issued for 2013 HYUNDAI vehicles, detailing the nature of the recall and whether it was addressed, if data is available.
Our reports may identify vehicles used for commercial purposes, detailing the extent of such use and its impact on the 2013 HYUNDAI's condition, if such records are available.
Total loss status, if documented, is reported along with the circumstances and damage type, critical for assessing whether the 2013 HYUNDAI vehicle has been substantially compromised.
Mileage data, collected over time, helps verify the actual use and condition of the 2013 HYUNDAI vehicle, indicating wear and potential issues, if accurately recorded.
Yes, it is generally safe to share your VIN online for decoding, as the VIN is a public figure and does not contain sensitive personal information.
If the 2013 HYUNDAI was used as a taxi, this information may be noted in the vehicle history report, including the duration and any relevant details affecting its wear and tear, if reported.
The 9th character in a VIN is the check digit, which is used to verify the authenticity of the VIN itself through a specific calculation.
Saltwater damage, if documented, is specifically noted due to its corrosive impact on the 2013 HYUNDAI vehicle's mechanical and electrical systems.


