BADVIN vehicle history report for
2017 HYUNDAI ELANTRAVIN: KMHD84LF3HU172475
Get FULL ACCESS to the vehicle history report and see all blurred info.
⭐ Read 205+ reviews from our customers who used BADVIN to avoid buying junk vehicles.
Historical Records
events
Photos
12 images
Sales History
1 records
Sale Prices
1 records
Market report
Price analytics
Historical Records
Historical records may include service and maintenance records, title status (clean, junk, salvage), insurance records, number of owners, registration events and states, and other information.
You can find more information about historical records in BADVIN reports and see more examples here.
Available historical records for VIN KMHD84LF3HU172475
Latest reported mileage: 761 mi
Below you can see some examples of what these records could look like.
2023-04-11
a year ago
143,487 mi
REBUILT TITLE ISSUED
2022-07-04
2 years ago
11,012 mi
Damage reported: minor to moderate damage
Damage to right rear
Damage to rear
Damage to right rear
Damage to rear
2019-11-21
5 years ago
44,561 mi
Damage reported: very minor damage
Damage to rear
Damage to rear
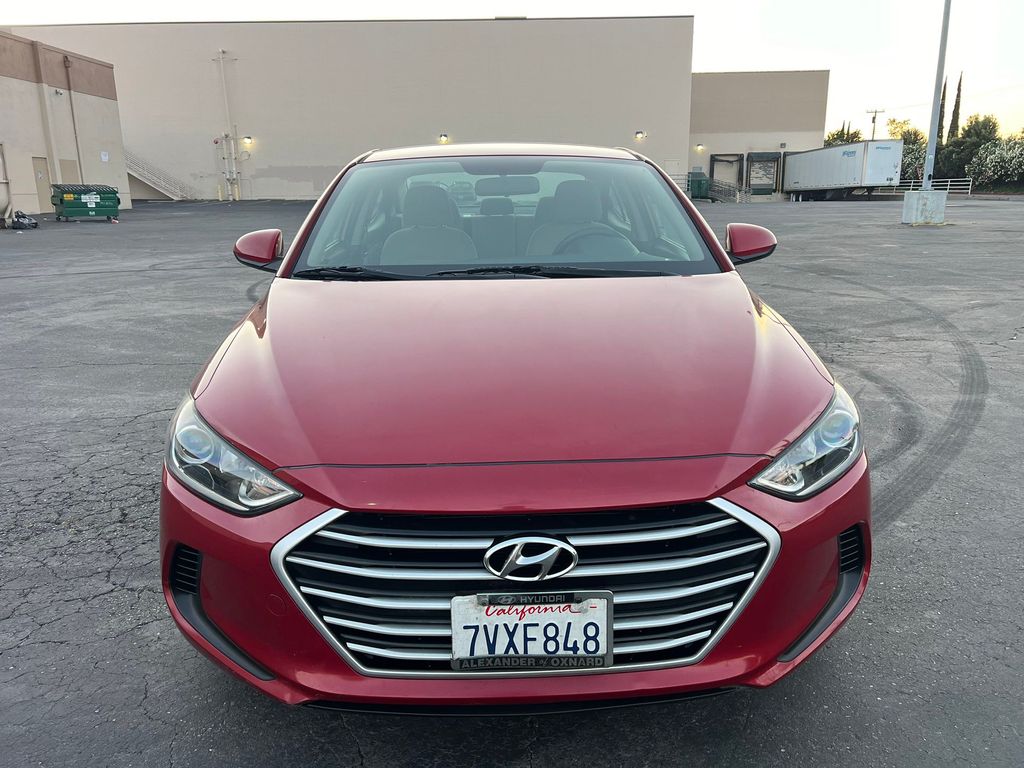
2017 Hyundai Elantra
| Year | 2017 |
| ODO | 8067 mi |
| Seller | Hidden text (Hidden text) |
| Location | Sacramento, CA, 95842 |
| Date | appeared 2 days ago latest price $3613 |
| Sale Website Type | classifieds |
| Notes | |
| 7564 | |
sale information provided by user #617546


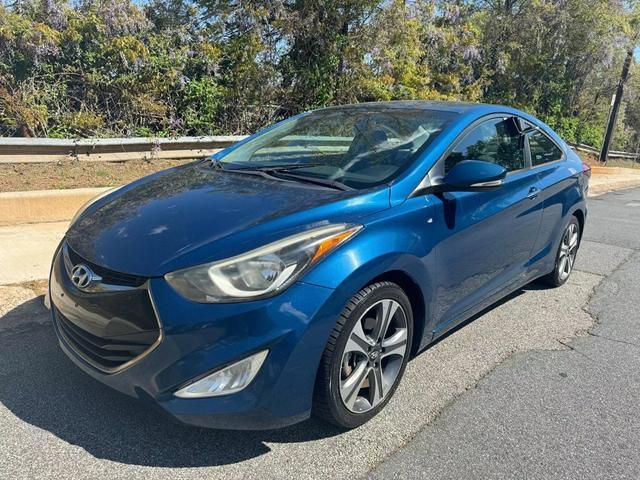
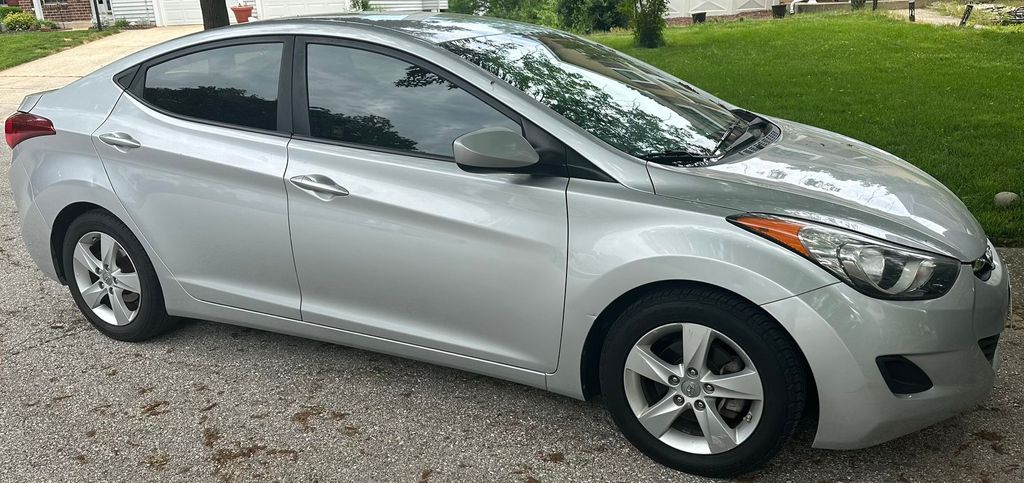
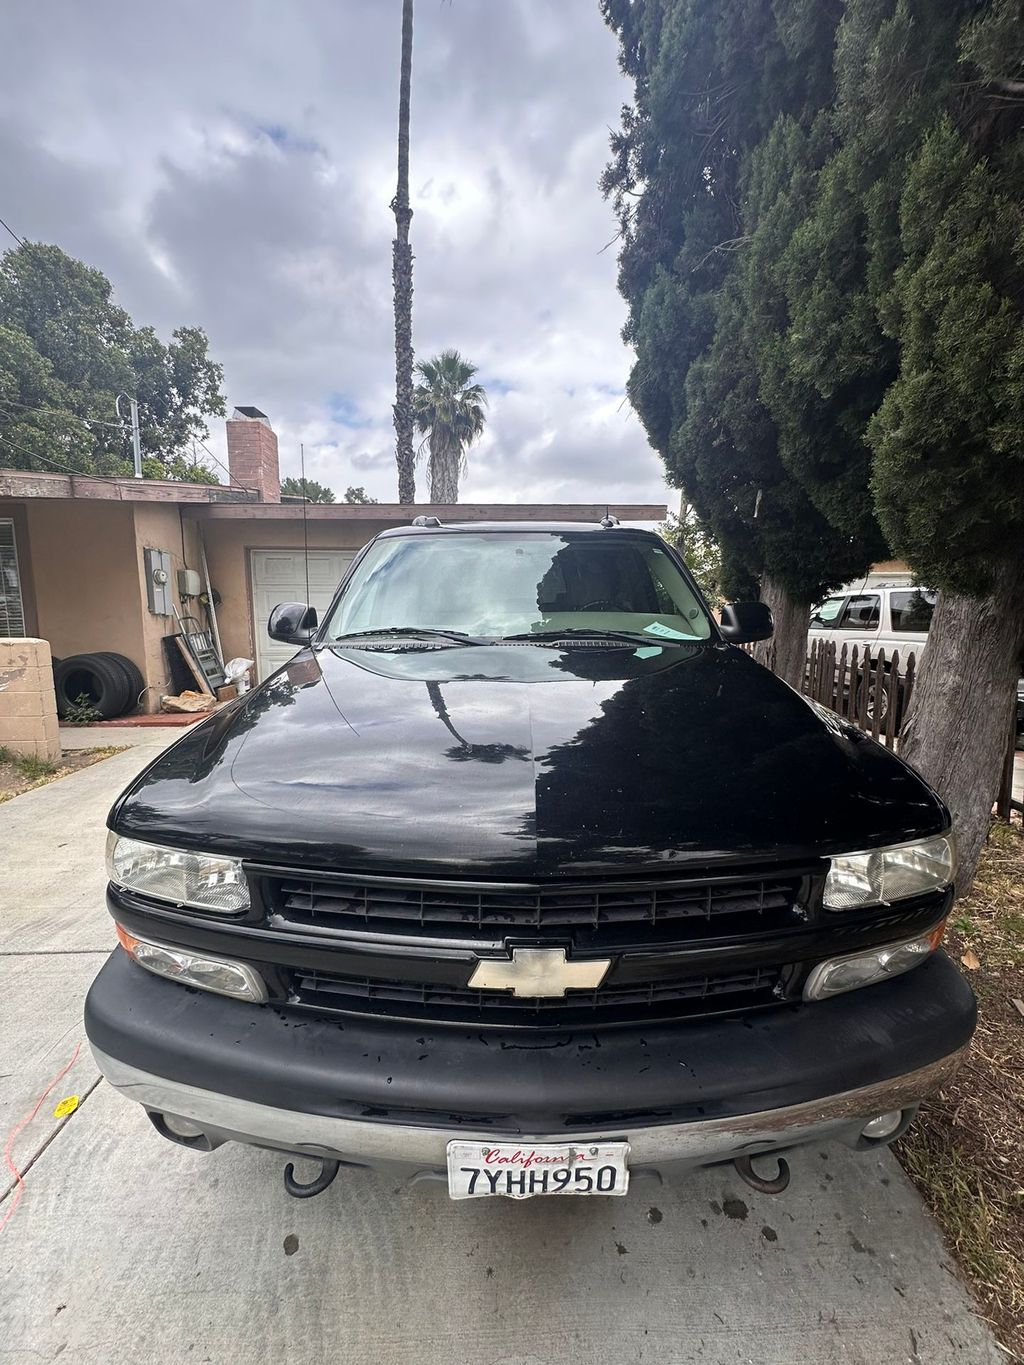
All photos above are REAL and display ACTUAL car. After you get the report you will see full resolution photos.
Tech Specs
| Color | red |
Model Analytics & Market Report
We've analyzed more than 203,800 sales records of this model and here are some numbers.
The average price for new (MSRP) 2017 HYUNDAI ELANTRA in 2017 was $20,800.
The average price for used 2017 HYUNDAI ELANTRA nowadays in 2024 is $12,305 which is 59% from the original price.
Estimated mileage driven per year is 10,128 miles.
For this model we also have depreciation curve, photos, list of features and options, and other analytics.
Take a look at 2017 HYUNDAI ELANTRA model page in BADVIN vehicles catalog.
Depreciation
The graph below is a depreciation curve for 2017 HYUNDAI ELANTRA. It shows how much this model looses per year in price. This analytics is calculated using sales records from BADVIN database.
The table below shows average price for used 2017 HYUNDAI ELANTRA in each year since the year of manufacturing, current year price and projected price in the future years.
You can scroll the table horizontally to see all columns.
| Year | Average Mileage | Average Price | % Left | % Lost | ||
|---|---|---|---|---|---|---|
| 2017 MSRP | 0 mi | $20,800 | — | — | 100% | 0% |
| 2017 | 10,128 mi | $22,990 | −$2,190 | −10.53% | 110.53% | -10.53% |
| 2018 | 20,256 mi | $21,675 | +$1,315 | +5.72% | 104.21% | -4.21% |
| 2019 | 30,384 mi | $19,998 | +$1,677 | +7.74% | 96.14% | 3.86% |
| 2020 | 40,512 mi | $18,987 | +$1,011 | +5.06% | 91.28% | 8.72% |
| 2021 | 50,640 mi | $15,988 | +$2,999 | +15.8% | 76.87% | 23.13% |
| → Visit 2017 HYUNDAI ELANTRA depreciation page to see full data. | ||||||
Price vs Mileage
The graph below shows how mileage affects the price for 2017 HYUNDAI ELANTRA. This data was calculated using sales records from BADVIN database.
The table below shows average price for used 2017 HYUNDAI ELANTRA by mileage and number of sales.
You can scroll the table horizontally to see all columns.
| Mileage | Average Price | Sample Size |
|---|---|---|
| 10,000 mi | $15,945 | 16 sales |
| 15,000 mi | $15,982 | 19 sales |
| 20,000 mi | $15,965 | 45 sales |
| 25,000 mi | $15,000 | 47 sales |
| 30,000 mi | $15,998 | 63 sales |
| 35,000 mi | $15,999 | 70 sales |
| → Visit 2017 HYUNDAI ELANTRA depreciation page to see full data. | ||
Get FULL ACCESS to the vehicle history report and see all blurred info.
⭐ Read 205+ reviews from our customers who used BADVIN to avoid buying junk vehicles.
Testimonials from our customers
After a bad experience buying a used car that turned out to have major issues, I now use Bad VIN to thoroughly check every vehicle i consider. It costs a bit more than other services but the detailed records and photos of past sales are wotrh it for the added peace of mind.

Olivia Johnson
verified on Trustpilot
Was shopping for a used Range Rover and found one that seemed suspiciously cheap. The badVIN report revealed it had been in a major front end collision, with photos showing the damage. Steered clear of that one and saved myself a ton of headaches!!
Ava Patel
verified on Trustpilot
Bad Vin's vehicle history report showed that the 2018 Audi A4 I was about to buy had been in a major accident that was not disclosed by the seller. The severity analysis helped me avoid a bad purchase. Great service!
Sophie Dubois
verified on Trustpilot
As a used car dealer, I rely on badvin.org for checking every vehicle I'm considering purchasing at auction. The comprehensive reports give me peace of mind and help me avoid problem cars. Photos of past sales have saved me from overpaying many times. Worth every penny!
Misha
verified on Trustpilot
Compare to other 2017 HYUNDAI ELANTRA


Other vehicles sales records


Frequently asked questions
Recall information may reveal if the vehicle has had any manufacturer defects that needed correction, impacting its safety and market value, depending on the completeness of recall data.
Sales descriptions may provide detailed narratives of the 2017 HYUNDAI vehicle’s features and condition at the time of each sale, highlighting potential changes and upgrades, depending on available data.
Use as a police or taxi vehicle, if noted, indicates high-intensity use which may affect the 2017 HYUNDAI vehicle's condition and lifespan, if such use is documented.
The report may include a history of odometer readings recorded during sales, services, or inspections, helping you verify the 2017 HYUNDAI ELANTRA's actual mileage, if records are accessible.
The Monroney label helps you understand the added features on a 2017 HYUNDAI ELANTRA by listing optional equipment and packages included in the vehicle, along with their pricing.
Vehicles that have been flooded may have a specific flood title or watermark in the vehicle history report, indicating significant water damage, if such events are documented.
The window sticker details the destination charges for a 2017 HYUNDAI ELANTRA, which are the fees associated with delivering the vehicle from the manufacturer to the dealership.
Technology plays a significant role in the depreciation of vehicles, as models with outdated tech depreciate faster due to lower consumer demand for older features.


