
BADVIN vehicle history report for
2017 HYUNDAI ELANTRAVIN: KMHD74LF4HU121635
Get FULL ACCESS to the vehicle history report and see all blurred info.
⭐ Read 206+ reviews from our customers who used BADVIN to avoid buying junk vehicles.
Historical Records
10 events
Window Sticker
PDF found
Market report
Price analytics
Historical Records
Historical records may include service and maintenance records, title status (clean, junk, salvage), insurance records, number of owners, registration events and states, and other information.
You can find more information about historical records in BADVIN reports and see more examples here.
Available 10 historical records for VIN KMHD74LF4HU121635
Latest reported mileage: 144 mi
Below you can see some examples of what these records could look like.
2023-02-17
a year ago
32,734 mi
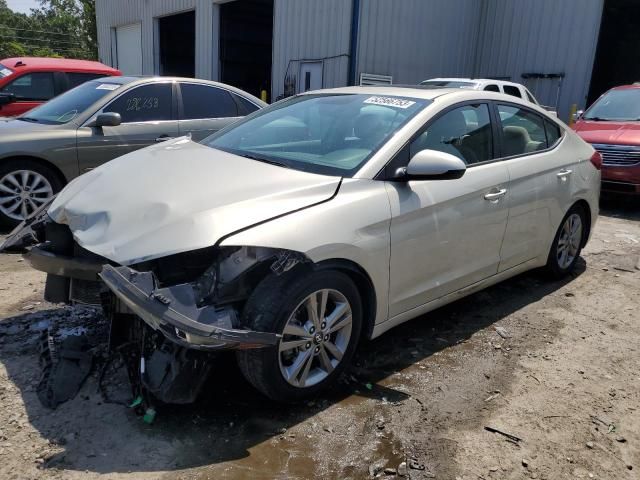
SALVAGE TITLE/CERTIFICATE ISSUED
2021-12-10
3 years ago
22,482 mi
Odometer reading reported
2021-01-21
3 years ago
28,705 mi
Vehicle serviced
Maintenance inspection completed
Maintenance inspection completed
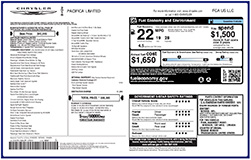
Window Sticker
A PDF of a window sticker is available for VIN KMHD74LF4HU121635.
Also called Monroney label, it's a label required in the United States to be displayed in all new automobiles.
It may include certain official information about the car such as:
- Manufacturer's Suggested Retail Price (MSRP)
- Engine and Transmission Specifications
- Equipment, Packages, and Extra Features
- Fuel Economy Rating
- Other Information
Read more about window stickers and see some examples here.
Model Analytics & Market Report
We've analyzed more than 203,800 sales records of this model and here are some numbers.
The average price for new (MSRP) 2017 HYUNDAI ELANTRA in 2017 was $20,800.
The average price for used 2017 HYUNDAI ELANTRA nowadays in 2024 is $12,305 which is 59% from the original price.
Estimated mileage driven per year is 10,128 miles.
For this model we also have depreciation curve, photos, list of features and options, and other analytics.
Take a look at 2017 HYUNDAI ELANTRA model page in BADVIN vehicles catalog.
Depreciation
The graph below is a depreciation curve for 2017 HYUNDAI ELANTRA. It shows how much this model looses per year in price. This analytics is calculated using sales records from BADVIN database.
The table below shows average price for used 2017 HYUNDAI ELANTRA in each year since the year of manufacturing, current year price and projected price in the future years.
You can scroll the table horizontally to see all columns.
| Year | Average Mileage | Average Price | % Left | % Lost | ||
|---|---|---|---|---|---|---|
| 2017 MSRP | 0 mi | $20,800 | — | — | 100% | 0% |
| 2017 | 10,128 mi | $22,990 | −$2,190 | −10.53% | 110.53% | -10.53% |
| 2018 | 20,256 mi | $21,675 | +$1,315 | +5.72% | 104.21% | -4.21% |
| 2019 | 30,384 mi | $19,998 | +$1,677 | +7.74% | 96.14% | 3.86% |
| 2020 | 40,512 mi | $18,987 | +$1,011 | +5.06% | 91.28% | 8.72% |
| 2021 | 50,640 mi | $15,988 | +$2,999 | +15.8% | 76.87% | 23.13% |
| → Visit 2017 HYUNDAI ELANTRA depreciation page to see full data. | ||||||
Price vs Mileage
The graph below shows how mileage affects the price for 2017 HYUNDAI ELANTRA. This data was calculated using sales records from BADVIN database.
The table below shows average price for used 2017 HYUNDAI ELANTRA by mileage and number of sales.
You can scroll the table horizontally to see all columns.
| Mileage | Average Price | Sample Size |
|---|---|---|
| 10,000 mi | $15,945 | 16 sales |
| 15,000 mi | $15,982 | 19 sales |
| 20,000 mi | $15,965 | 45 sales |
| 25,000 mi | $15,000 | 47 sales |
| 30,000 mi | $15,998 | 63 sales |
| 35,000 mi | $15,999 | 70 sales |
| → Visit 2017 HYUNDAI ELANTRA depreciation page to see full data. | ||
Get FULL ACCESS to the vehicle history report and see all blurred info.
⭐ Read 206+ reviews from our customers who used BADVIN to avoid buying junk vehicles.
Testimonials from our customers
Was shopping for a used Range Rover and found one that seemed suspiciously cheap. The badVIN report revealed it had been in a major front end collision, with photos showing the damage. Steered clear of that one and saved myself a ton of headaches!!

Ava Patel
verified on Trustpilot
As a first time used car buyer, I was nervous about getting ripped off. The vehicle report from badvin gave me so much more confidence - it confirmed the car had a clean history and the mileage lined up. Such a relief to have that peace of mind.
Chloe Martin
verified on Trustpilot
I always rely on badvin to check out any used car before I buy. It gives such a complete history, including past accidents, service records, recalls and much more. Feel so much more confident as a used car shopper having this info.
Sofia Garcia
verified on Trustpilot
Purchased a badvin report before buying a used Lexus RX 350. It revealed a minor accident the seller hadn't mentioned. I still bought the car but used the info to negotiate a lower price. Well worth the cost for the leverage it gave me!
Aiden Patel
verified on Trustpilot
Compare to other 2017 HYUNDAI ELANTRA


2016 HYUNDAI ELANTRA
in 3 days, 92,653 mi
est retail value $10,463
buy now price $2,400
VIN 5NPDH4AE0GH776220


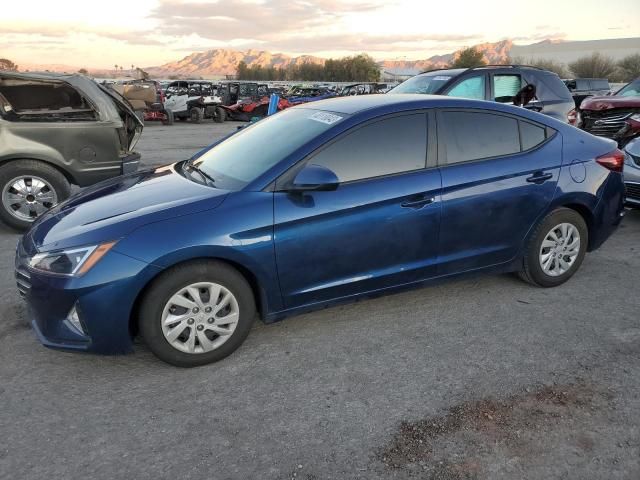
2019 HYUNDAI ELANTRA
a month ago, 71,101 mi
est retail value $13,402
buy now price $5,500
VIN 5NPD74LF4KH481672


Other vehicles sales records


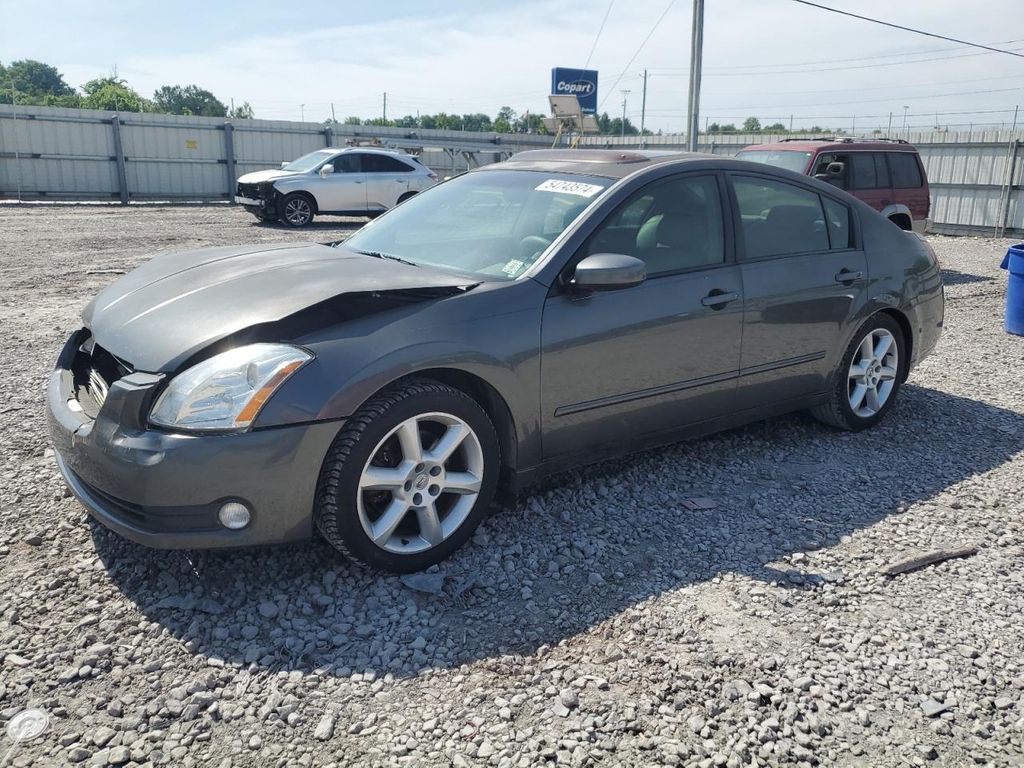
2006 NISSAN MAXIMA
in 3 days, 257,517 mi
est retail value $4,386
buy now price $400
VIN 1N4BA41E56C830896

2021 MAZDA CX-5
in 3 days, 50,266 mi
est retail value $22,036
buy now price $4,000
VIN JM3KFADM2M0480596


Frequently asked questions
Odometer issues such as rollbacks or malfunctions raise red flags about potential fraud or misuse in the 2017 HYUNDAI vehicle’s history, if such problems are recorded.
A VIN decoder can help you find compatible parts for a 2017 HYUNDAI vehicle by identifying the exact model, engine type, and other specifications crucial for parts compatibility.
To maximize value, consider buying a vehicle that is a few years old, as it has already undergone significant depreciation but likely remains reliable.
Documentation, if available, includes details of theft and vandalism incidents, showing the extent of damage and any recovery actions taken for the 2017 HYUNDAI vehicle.
Refurbished status, if recorded, is detailed with information on parts replaced and upgrades made, affecting the resale value and reliability of the 2017 HYUNDAI.
Total loss is usually determined when the cost of repairing the vehicle exceeds a certain percentage of its value before the damage occurred, as decided by the insurance company, if such data is recorded.
Vehicles that have been flooded may have a specific flood title or watermark in the vehicle history report, indicating significant water damage, if such events are documented.


