
BADVIN vehicle history report for
2019 HYUNDAI ELANTRAVIN: 5NPD74LF5KH420573
Get FULL ACCESS to the vehicle history report and see all blurred info.
⭐ Read 206+ reviews from our customers who used BADVIN to avoid buying junk vehicles.
Historical Records
11 events
Window Sticker
PDF found
Photos
10 images
Sales History
1 records
Sale Prices
1 records
Market report
Price analytics
Historical Records
Historical records may include service and maintenance records, title status (clean, junk, salvage), insurance records, number of owners, registration events and states, and other information.
You can find more information about historical records in BADVIN reports and see more examples here.
Available 11 historical records for VIN 5NPD74LF5KH420573
Latest reported mileage: 849 mi
Below you can see some examples of what these records could look like.
2023-06-04
a year ago
124,026 mi
SALVAGE TITLE/CERTIFICATE ISSUED
2021-12-11
3 years ago
18,234 mi
Accident reported
Vehicle involved in a sideswipe collision with another motor vehicle
Airbag deployed
Vehicle involved in a sideswipe collision with another motor vehicle
Airbag deployed
2020-03-06
4 years ago
33,385 mi
Damage reported: very minor damage
Damage to rear
Damage to rear
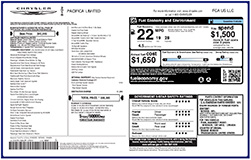
Window Sticker
A PDF of a window sticker is available for VIN 5NPD74LF5KH420573.
Also called Monroney label, it's a label required in the United States to be displayed in all new automobiles.
It may include certain official information about the car such as:
- Manufacturer's Suggested Retail Price (MSRP)
- Engine and Transmission Specifications
- Equipment, Packages, and Extra Features
- Fuel Economy Rating
- Other Information
Read more about window stickers and see some examples here.
Sale Record
2019 HYUNDAI ELANTRA SE
sold
| Year | 2019 |
| Title | Hidden text (Hidden text) |
| ODO | — (Hidden text) |
| Damage | Hidden text, Hidden text |
| Estimated Retail Value | $1305 |
| Location | Oklahoma City, OK, 73160 |
| Date | ended 3 years ago |
| Sale Website Type | salvage or insurance auction |
sale information provided by user #543268


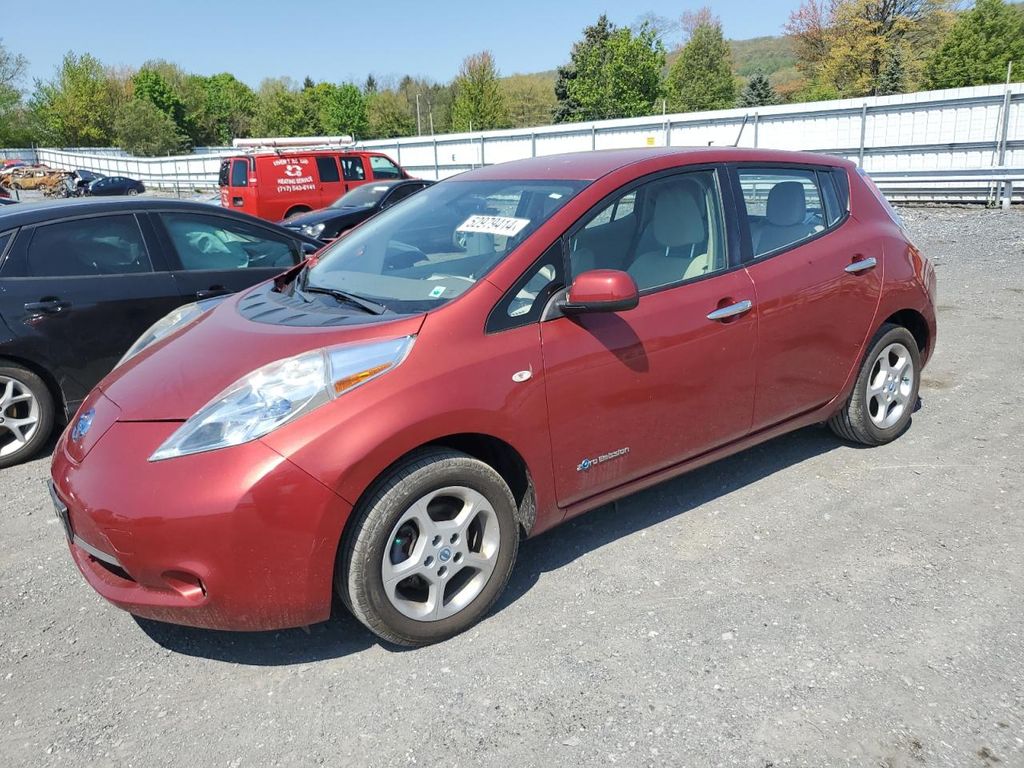
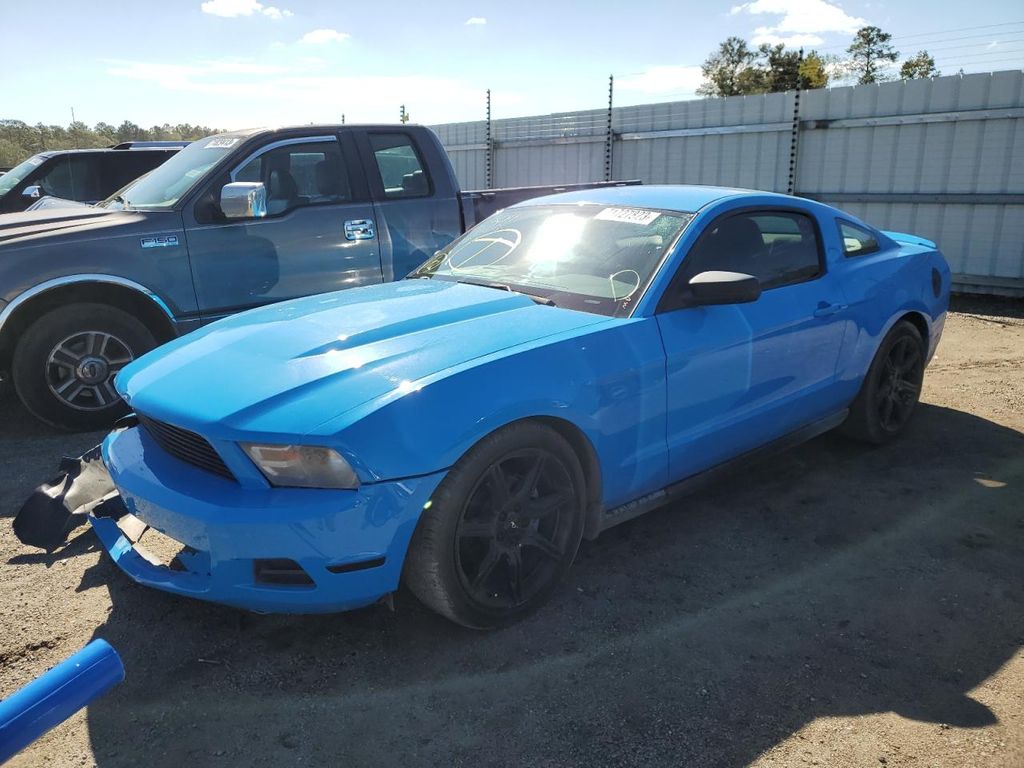
All photos above are REAL and display ACTUAL car. After you get the report you will see full resolution photos.
Tech Specs
| Body Style | SEDAN 4D |
| Color | BLACK |
| Engine | 2.0L 4 |
| Drive | Front-wheel Drive |
| Fuel Type | GAS |
Sales & Winner Bids
This car appeared in sales 799 times.
| Location | Date | Highest Bid |
|---|---|---|
| Hidden text | 2020-06-15 | $9616 (NJ, USA) 197+ bids in total |
| Hidden text | 2021-10-28 | $1847 starting bid |
| Hidden text | 2019-06-19 | $6621 (TN, USA) 143+ bids in total |
| Hidden text | 2023-04-20 | $2248 starting bid |
| Hidden text | 2022-03-26 | $6746 starting bid |
| Hidden text | 2022-01-29 | $9773 starting bid |
| Hidden text | 2023-12-17 | $8643 starting bid |
| Hidden text | 2023-10-31 | $4410 starting bid |
| Hidden text | 2020-04-27 | $6022 (GA, USA) 534+ bids in total |
Model Analytics & Market Report
We've analyzed more than 124,600 sales records of this model and here are some numbers.
The average price for new (MSRP) 2019 HYUNDAI ELANTRA in 2019 was $20,800.
The average price for used 2019 HYUNDAI ELANTRA nowadays in 2024 is $14,989 which is 72% from the original price.
Estimated mileage driven per year is 10,128 miles.
For this model we also have depreciation curve, photos, list of features and options, and other analytics.
Take a look at 2019 HYUNDAI ELANTRA model page in BADVIN vehicles catalog.
Depreciation
The graph below is a depreciation curve for 2019 HYUNDAI ELANTRA. It shows how much this model looses per year in price. This analytics is calculated using sales records from BADVIN database.
The table below shows average price for used 2019 HYUNDAI ELANTRA in each year since the year of manufacturing, current year price and projected price in the future years.
You can scroll the table horizontally to see all columns.
| Year | Average Mileage | Average Price | % Left | % Lost | ||
|---|---|---|---|---|---|---|
| 2019 MSRP | 0 mi | $20,800 | — | — | 100% | 0% |
| 2019 | 10,128 mi | $22,990 | −$2,190 | −10.53% | 110.53% | -10.53% |
| 2020 | 20,256 mi | $21,675 | +$1,315 | +5.72% | 104.21% | -4.21% |
| 2021 | 30,384 mi | $19,998 | +$1,677 | +7.74% | 96.14% | 3.86% |
| 2022 | 40,512 mi | $18,987 | +$1,011 | +5.06% | 91.28% | 8.72% |
| 2023 | 50,640 mi | $15,988 | +$2,999 | +15.8% | 76.87% | 23.13% |
| → Visit 2019 HYUNDAI ELANTRA depreciation page to see full data. | ||||||
Price vs Mileage
The graph below shows how mileage affects the price for 2019 HYUNDAI ELANTRA. This data was calculated using sales records from BADVIN database.
The table below shows average price for used 2019 HYUNDAI ELANTRA by mileage and number of sales.
You can scroll the table horizontally to see all columns.
| Mileage | Average Price | Sample Size |
|---|---|---|
| 5,000 mi | $17,879 | 18 sales |
| 10,000 mi | $17,991 | 35 sales |
| 15,000 mi | $17,378 | 56 sales |
| 20,000 mi | $17,989 | 119 sales |
| 25,000 mi | $17,192 | 157 sales |
| 30,000 mi | $16,990 | 201 sales |
| → Visit 2019 HYUNDAI ELANTRA depreciation page to see full data. | ||
Get FULL ACCESS to the vehicle history report and see all blurred info.
⭐ Read 206+ reviews from our customers who used BADVIN to avoid buying junk vehicles.
Testimonials from our customers
As a used car dealer, I rely on badvin.org for checking every vehicle I'm considering purchasing at auction. The comprehensive reports give me peace of mind and help me avoid problem cars. Photos of past sales have saved me from overpaying many times. Worth every penny!

Misha
verified on Trustpilot
BadVin's vehicle history report is a must-have before buying any used vehicle. It's saved me from a few lemons over the years - cars that looked great on the surface but had hidden issues like accidents or title problems. Well worth the price.
Camila Santos
verified on Trustpilot
I almost bought a 2019 Malibu that seemed like a great deal - low miles and price. But the badvin report showed it used to be a rental fleet vehicle, which the seller didn't disclose. Glad I found out before buying someone else's abused rental!
Benjamin Torres
verified on Trustpilot
As a broke college kid I almost settled for a sketchy 2005 Altima cuz it was cheap. but splurged on the report from badvin 1st. soooo glad I did - turned out it had been totalled and rebuilt. spending a little saved me from wasting $1000s!
Sophie
verified on Trustpilot
Compare to other 2019 HYUNDAI ELANTRA


2015 HYUNDAI ELANTRA
22 days ago, 79,876 mi
est retail value $12,213
buy now price $1,000
VIN 5NPDH4AE0FH621620


2016 HYUNDAI ELANTRA
in 4 days, 92,653 mi
est retail value $10,463
buy now price $2,400
VIN 5NPDH4AE0GH776220


Other vehicles sales records


2021 IC CORPORATION 3000 CE
in 3 days,
est retail value $77,500
buy now price $6,875
VIN 4DRBUC8P4MB273836


2012 FORD F450
4 days ago, 224,953 mi
est retail value $19,340
buy now price $1,600
VIN 1FDUF4HY2CED10705


Frequently asked questions
Federal highway inspection data for 2019 HYUNDAI vehicles may include inspection dates and details on safety, driver, and hazardous materials violations, if such inspections have been documented.
Our reports may provide information on any open recalls affecting the 2019 HYUNDAI ELANTRA, detailing the nature of the recall and recommended actions, if such records exist.
Transmission replacement history, if applicable, might be detailed in our reports, providing insights into major repairs and vehicle reliability, if available.
Total loss status, if documented, is reported along with the circumstances and damage type, critical for assessing whether the 2019 HYUNDAI vehicle has been substantially compromised.
Market value is generally estimated based on the 2019 HYUNDAI vehicle’s history, condition, and comparable sales, helping to provide a guideline for buyers and sellers, though specific values can vary.
Fire damage, if reported, is detailed with specifics on affected areas and severity, important for assessing the repair quality and safety of the 2019 HYUNDAI.


