
BADVIN vehicle history report for
2013 HYUNDAI ELANTRAVIN: KMHDH4AE0DU850927
Get FULL ACCESS to the vehicle history report and see all blurred info.
⭐ Read 206+ reviews from our customers who used BADVIN to avoid buying junk vehicles.
Historical Records
events
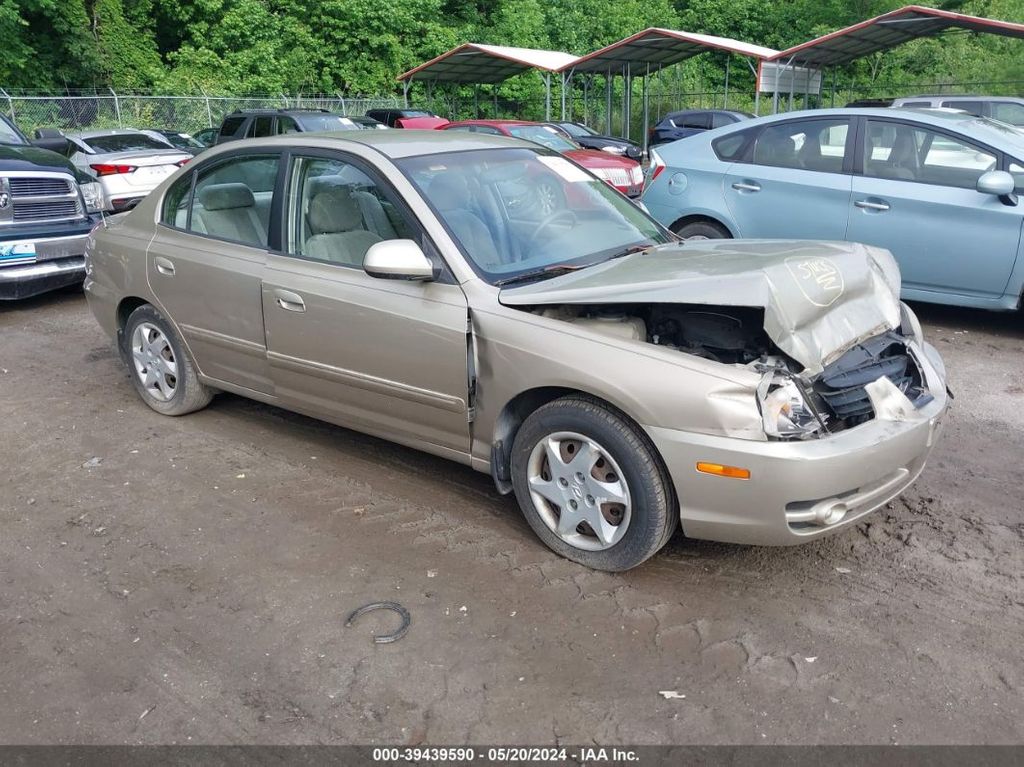
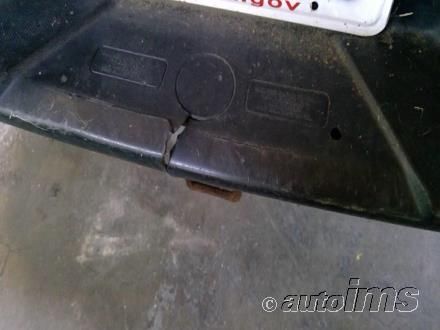
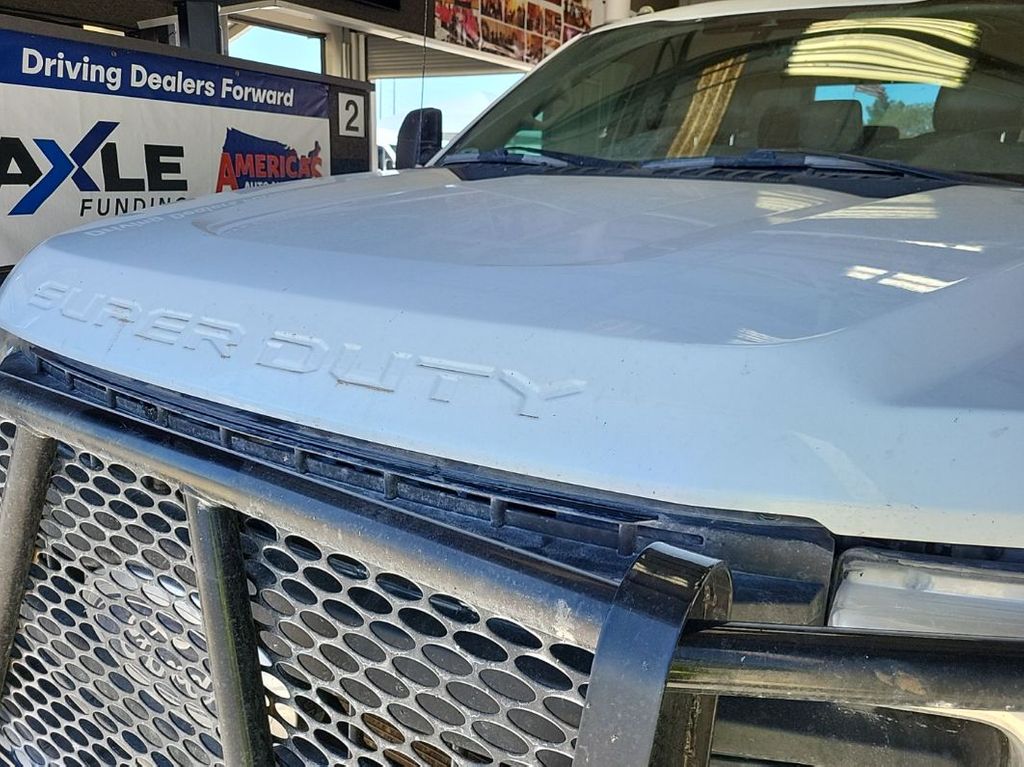
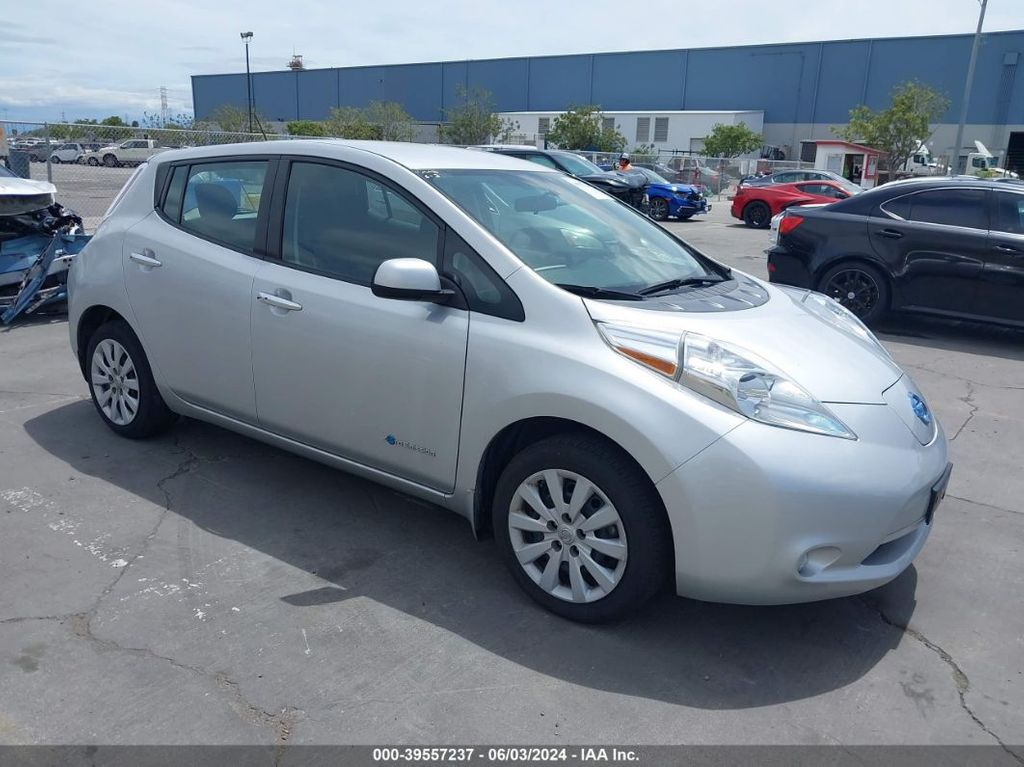
Photos
11 images
Sales History
1 records
Market report
Price analytics
Historical Records
Historical records may include service and maintenance records, title status (clean, junk, salvage), insurance records, number of owners, registration events and states, and other information.
You can find more information about historical records in BADVIN reports and see more examples here.
Available historical records for VIN KMHDH4AE0DU850927
Latest reported mileage: 827 mi
Below you can see some examples of what these records could look like.
2023-12-29
6 months ago
88,276 mi
REBUILT TITLE ISSUED
2022-07-23
2 years ago
6,112 mi
SALVAGE TITLE/CERTIFICATE ISSUED
2021-03-26
3 years ago
40,546 mi
Vehicle serviced
Maintenance inspection completed
Maintenance inspection completed
Sale Record
| Year | 2013 |
| Title | Hidden text |
| ODO | 6059 mi (Hidden text) |
| Loss | Hidden text |
| Damage | Hidden text |
| Estimated Retail Value | $9227 |
| Estimated Repair Cost | $1193 (899%) |
| Seller | Hidden text |
| Location | Central New Jersey, NJ |
| Date | ended 3 years ago |
| Sale Website Type | salvage or insurance auction |
sale information provided by user #15599


All photos above are REAL and display ACTUAL car. After you get the report you will see full resolution photos.
Tech Specs
| Transmission | Automatic Transmission |
| Engine | 1.8L DOHC MPFI D-CVVT |
| Cylinders | 4 Cylinders |
| Drive | Front Wheel Drive |
| Fuel Type | Gasoline |
Model Analytics & Market Report
We've analyzed more than 114,200 sales records of this model and here are some numbers.
The average price for new (MSRP) 2013 HYUNDAI ELANTRA in 2013 was $20,800.
The average price for used 2013 HYUNDAI ELANTRA nowadays in 2024 is $8,991 which is 43% from the original price.
Estimated mileage driven per year is 10,128 miles.
For this model we also have depreciation curve, photos, list of features and options, and other analytics.
Take a look at 2013 HYUNDAI ELANTRA model page in BADVIN vehicles catalog.
Depreciation
The graph below is a depreciation curve for 2013 HYUNDAI ELANTRA. It shows how much this model looses per year in price. This analytics is calculated using sales records from BADVIN database.
The table below shows average price for used 2013 HYUNDAI ELANTRA in each year since the year of manufacturing, current year price and projected price in the future years.
You can scroll the table horizontally to see all columns.
| Year | Average Mileage | Average Price | % Left | % Lost | ||
|---|---|---|---|---|---|---|
| 2013 MSRP | 0 mi | $20,800 | — | — | 100% | 0% |
| 2013 | 10,128 mi | $22,990 | −$2,190 | −10.53% | 110.53% | -10.53% |
| 2014 | 20,256 mi | $21,675 | +$1,315 | +5.72% | 104.21% | -4.21% |
| 2015 | 30,384 mi | $19,998 | +$1,677 | +7.74% | 96.14% | 3.86% |
| 2016 | 40,512 mi | $18,987 | +$1,011 | +5.06% | 91.28% | 8.72% |
| 2017 | 50,640 mi | $15,988 | +$2,999 | +15.8% | 76.87% | 23.13% |
| → Visit 2013 HYUNDAI ELANTRA depreciation page to see full data. | ||||||
Price vs Mileage
The graph below shows how mileage affects the price for 2013 HYUNDAI ELANTRA. This data was calculated using sales records from BADVIN database.
The table below shows average price for used 2013 HYUNDAI ELANTRA by mileage and number of sales.
You can scroll the table horizontally to see all columns.
| Mileage | Average Price | Sample Size |
|---|---|---|
| 15,000 mi | $13,098 | 11 sales |
| 20,000 mi | $14,998 | 31 sales |
| 25,000 mi | $13,597 | 42 sales |
| 30,000 mi | $11,701 | 41 sales |
| 35,000 mi | $11,395 | 51 sales |
| 40,000 mi | $12,888 | 97 sales |
| → Visit 2013 HYUNDAI ELANTRA depreciation page to see full data. | ||
Get FULL ACCESS to the vehicle history report and see all blurred info.
⭐ Read 206+ reviews from our customers who used BADVIN to avoid buying junk vehicles.
Testimonials from our customers
Bad Vin's vehicle history report showed that the 2018 Audi A4 I was about to buy had been in a major accident that was not disclosed by the seller. The severity analysis helped me avoid a bad purchase. Great service!

Sophie Dubois
verified on Trustpilot
As a first time used car buyer, I was nervous about getting ripped off. The vehicle report from badvin gave me so much more confidence - it confirmed the car had a clean history and the mileage lined up. Such a relief to have that peace of mind.
Chloe Martin
verified on Trustpilot
Was about to buy a used 2016 Camry but decided to get the badvin report first. Turns out the car had been in a serious crash and was declared a total loss by insurance, even tho carfax showed it as clean! Dodged a bullet on that one. ty badvin
Jessica Nguyen
verified on Trustpilot
Can't believe what badvin found on a used 2012 chevy silverado I almost bought - odometer had been rolled back 50k miles according to the mileage history! Carfax didnt show nething bout that. So glad I checked here first b4 handing over my hard earned $$
Jackson
verified on Trustpilot
Compare to other 2013 HYUNDAI ELANTRA


Other vehicles sales records


Frequently asked questions
The manufacturing location can be interpreted from the first character of the VIN, which indicates the country of assembly, and sometimes more specific location details are included in the first few characters.
Recall information may reveal if the vehicle has had any manufacturer defects that needed correction, impacting its safety and market value, depending on the completeness of recall data.
You can find your vehicle's VIN on the dashboard on the driver's side, visible through the windshield, and on your vehicle's registration documents.
The window sticker plays a crucial role in the car buying process by ensuring transparency about the vehicle's features, costs, and certifications, aiding consumers in making informed purchasing decisions.
Sales descriptions may provide detailed narratives of the 2013 HYUNDAI vehicle’s features and condition at the time of each sale, highlighting potential changes and upgrades, depending on available data.
A VIN alone does not typically provide fuel economy details directly; however, it can identify the vehicle model and engine type, which you can cross-reference with fuel economy data from other sources.
On average, a new car can depreciate by approximately 23% after the first year, reflecting the premium paid for new technology and immediate depreciation once it's considered used.


