
BADVIN vehicle history report for
2010 HYUNDAI ELANTRAVIN: KMHDB8AE9AU069487
Get FULL ACCESS to the vehicle history report and see all blurred info.
⭐ Read 206+ reviews from our customers who used BADVIN to avoid buying junk vehicles.
Historical Records
47 events
Market report
Price analytics
Historical Records
Historical records may include service and maintenance records, title status (clean, junk, salvage), insurance records, number of owners, registration events and states, and other information.
You can find more information about historical records in BADVIN reports and see more examples here.
Available 47 historical records for VIN KMHDB8AE9AU069487
Latest reported mileage: 679 mi
Below you can see some examples of what these records could look like.
2023-07-09
a year ago
35,484 mi
NOT ACTUAL MILEAGE TITLE ISSUED
Titled or registered as lease vehicle
Titled or registered as lease vehicle
2022-08-16
2 years ago
18,625 mi
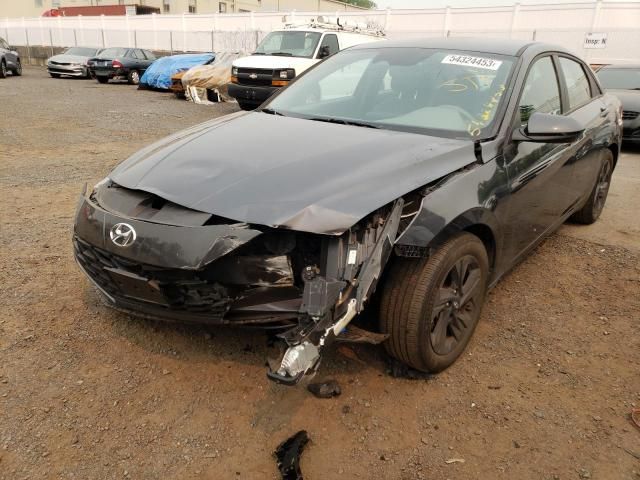
Damage reported: very minor damage
Damage to rear
Damage to rear
2019-12-21
5 years ago
28,203 mi
Passed emissions inspection
Model Analytics & Market Report
We've analyzed more than 20,900 sales records of this model and here are some numbers.
The average price for new (MSRP) 2010 HYUNDAI ELANTRA in 2010 was $20,800.
The average price for used 2010 HYUNDAI ELANTRA nowadays in 2024 is $5,995 which is 29% from the original price.
Estimated mileage driven per year is 10,128 miles.
For this model we also have depreciation curve, photos, list of features and options, and other analytics.
Take a look at 2010 HYUNDAI ELANTRA model page in BADVIN vehicles catalog.
Depreciation
The graph below is a depreciation curve for 2010 HYUNDAI ELANTRA. It shows how much this model looses per year in price. This analytics is calculated using sales records from BADVIN database.
The table below shows average price for used 2010 HYUNDAI ELANTRA in each year since the year of manufacturing, current year price and projected price in the future years.
You can scroll the table horizontally to see all columns.
| Year | Average Mileage | Average Price | % Left | % Lost | ||
|---|---|---|---|---|---|---|
| 2010 MSRP | 0 mi | $20,800 | — | — | 100% | 0% |
| 2010 | 10,128 mi | $22,990 | −$2,190 | −10.53% | 110.53% | -10.53% |
| 2011 | 20,256 mi | $21,675 | +$1,315 | +5.72% | 104.21% | -4.21% |
| 2012 | 30,384 mi | $19,998 | +$1,677 | +7.74% | 96.14% | 3.86% |
| 2013 | 40,512 mi | $18,987 | +$1,011 | +5.06% | 91.28% | 8.72% |
| 2014 | 50,640 mi | $15,988 | +$2,999 | +15.8% | 76.87% | 23.13% |
| → Visit 2010 HYUNDAI ELANTRA depreciation page to see full data. | ||||||
Price vs Mileage
The graph below shows how mileage affects the price for 2010 HYUNDAI ELANTRA. This data was calculated using sales records from BADVIN database.
The table below shows average price for used 2010 HYUNDAI ELANTRA by mileage and number of sales.
You can scroll the table horizontally to see all columns.
| Mileage | Average Price | Sample Size |
|---|---|---|
| 10,000 mi | $9,698 | 13 sales |
| 15,000 mi | $14,990 | 25 sales |
| 20,000 mi | $10,990 | 13 sales |
| 25,000 mi | $14,590 | 67 sales |
| 30,000 mi | $9,925 | 30 sales |
| 35,000 mi | $12,990 | 140 sales |
| → Visit 2010 HYUNDAI ELANTRA depreciation page to see full data. | ||
Testimonials from our customers
As a first time used car buyer, I was nervous about getting ripped off. The vehicle report from badvin gave me so much more confidence - it confirmed the car had a clean history and the mileage lined up. Such a relief to have that peace of mind.

Chloe Martin
verified on Trustpilot
I buy rebuilt title cars at copart to fix and resell. was hoping BadVin reports wud have more detail on damage history to help me value cars before bidding, Carfax is better for that. but for clean title vehicles it seems pretty useful
Fatima
verified on Trustpilot
I've tried a bunch of different vehicle history reports over the years and badvin.org has been the most comprehensive by far. Stuff like service records, ownership history, lien and repo info that I haven't found elsewhere. Def go-to resource when shopping for used vehicles now.
Levi Johnson
verified on Trustpilot
Ich hätte fast einen 2017 Mercedes-Benz C300 gekauft, bis der Bad Vin-Bericht zeigte, dass er als durch Überschwemmung beschädigt gemeldet wurde. Die detaillierten Schadensaufzeichnungen haben mich vor einem großen Fehler bewahrt!
Sophia Müller
verified on Trustpilot
Compare to other 2010 HYUNDAI ELANTRA
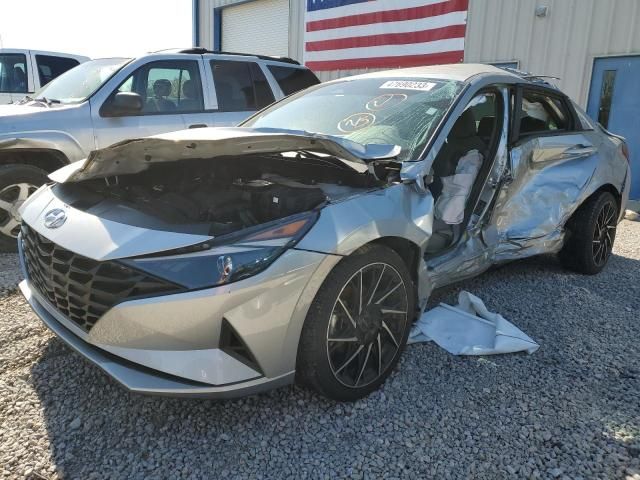
2021 HYUNDAI ELANTRA
in a day, 13,279 mi
est retail value $23,381
buy now price $6,400
VIN 5NPLM4AG1MH003356

2020 HYUNDAI ELANTRA
11 days ago, 56,878 mi
est retail value $17,717
buy now price $4,900
VIN KMHD84LF2LU905494


2017 HYUNDAI ELANTRA
in 3 days, 97,804 mi
est retail value $13,628
buy now price $2,500
VIN KMHD74LF5HU121689


Other vehicles sales records

2003 TOYOTA CAMRY
4 days ago, 159,234 mi
est retail value $4,010
buy now price $1,203
VIN 4T1BE32K13U125656


2014 MINI COUNTRYMAN
in a day, 102,505 mi
est retail value $8,900
buy now price $4,500
VIN WMWZC3C50EWP28409


2015 NISSAN ALTIMA
in a day, 129,108 mi
est retail value $8,631
buy now price $2,950
VIN 1N4AL3AP6FC258724


Frequently asked questions
To possibly get a vehicle history report by VIN, you can enter the VIN on our website's search tool; the availability and detail of the report will depend on the data accessible for that specific VIN.
The information in a vehicle history report, such as past accidents, salvage titles, and theft, may significantly affect the car's resale value, depending on what is documented.
A VIN decoder can confirm the safety features originally installed in a 2010 HYUNDAI ELANTRA, such as airbags, ABS, and stability control systems.
The window sticker details the destination charges for a 2010 HYUNDAI ELANTRA, which are the fees associated with delivering the vehicle from the manufacturer to the dealership.
Our vehicle history reports may specify if the 2010 HYUNDAI has been used as a rental vehicle, which might affect its condition and value, if such information is recorded.
Keeping your vehicle for about three to five years can optimize its resale value, balancing depreciation with usage and maintenance costs.
MSRP on a Monroney label stands for Manufacturer's Suggested Retail Price, which is the recommended selling price for a vehicle.
Total loss is usually determined when the cost of repairing the vehicle exceeds a certain percentage of its value before the damage occurred, as decided by the insurance company, if such data is recorded.


