
BADVIN vehicle history report for
2013 HYUNDAI ELANTRAVIN: 5NPDH4AE3DH332230
Get FULL ACCESS to the vehicle history report and see all blurred info.
⭐ Read 205+ reviews from our customers who used BADVIN to avoid buying junk vehicles.
Historical Records
events
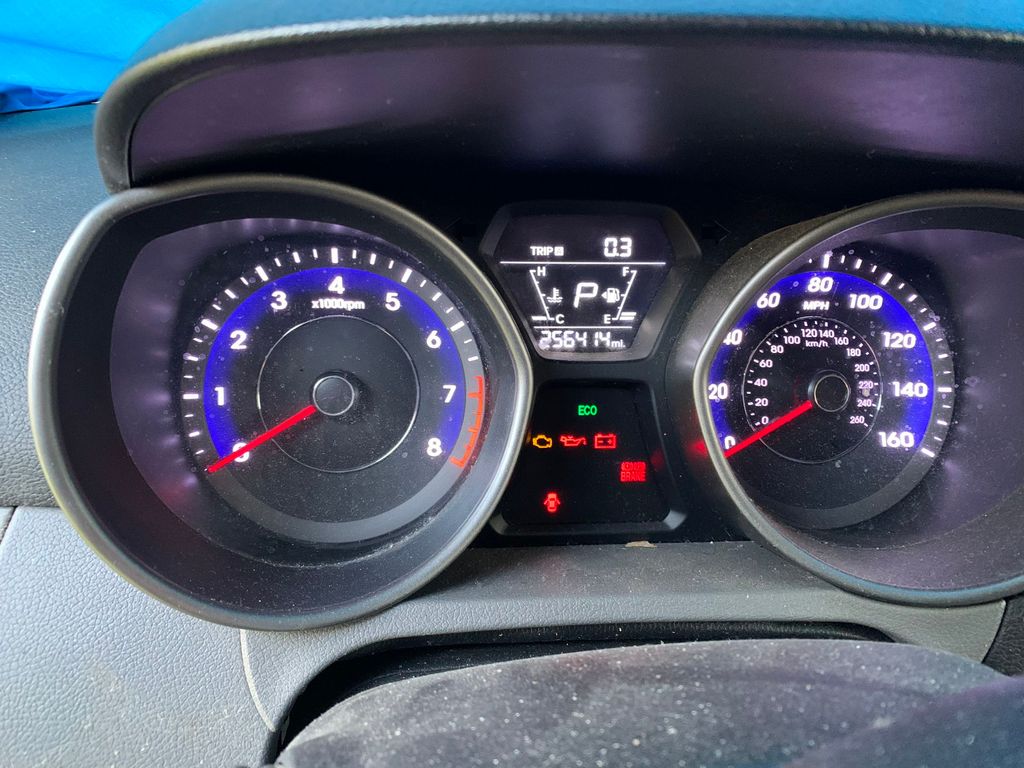
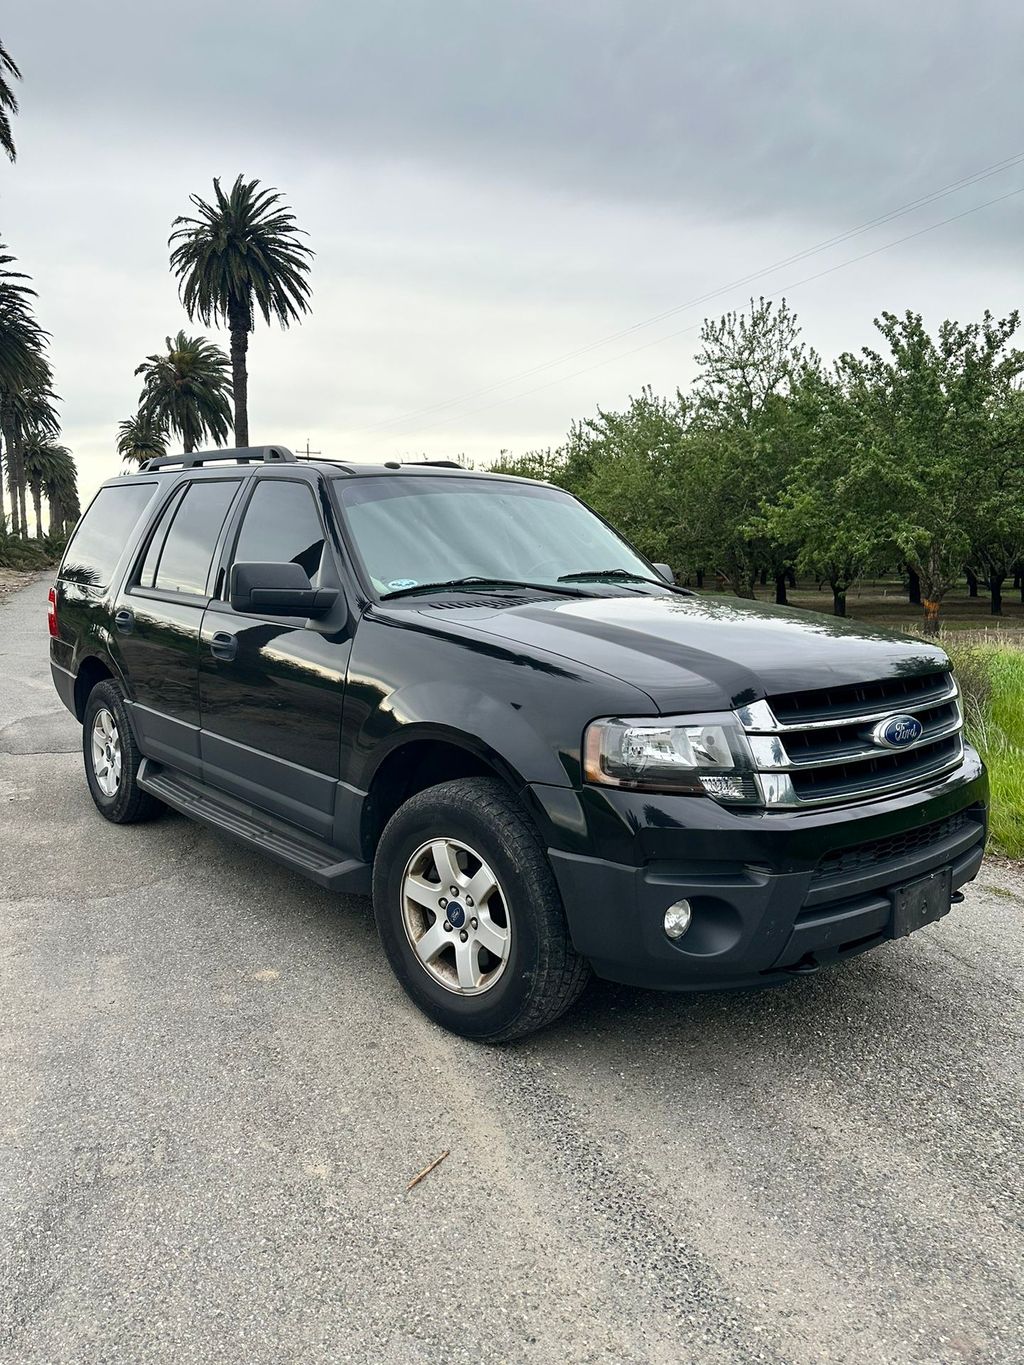
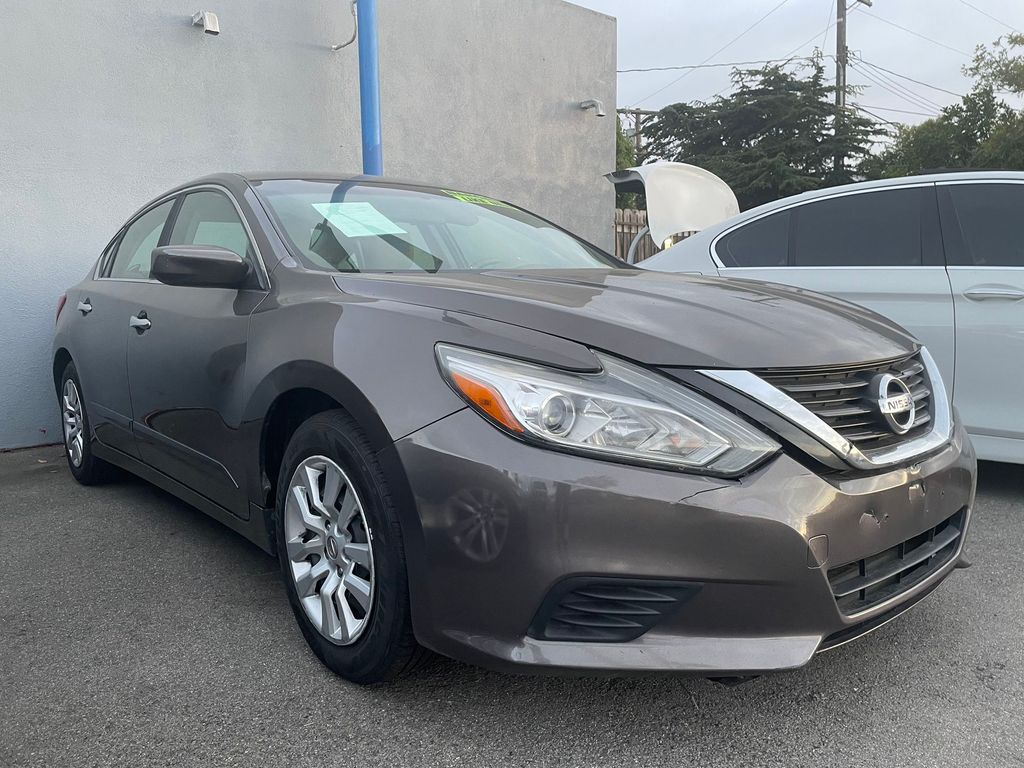
Photos
9 images
Sales History
1 records
Sale Prices
1 records
Market report
Price analytics
Historical Records
Historical records may include service and maintenance records, title status (clean, junk, salvage), insurance records, number of owners, registration events and states, and other information.
You can find more information about historical records in BADVIN reports and see more examples here.
Available historical records for VIN 5NPDH4AE3DH332230
Latest reported mileage: 443 mi
Below you can see some examples of what these records could look like.
2023-04-27
a year ago
126,839 mi
Vehicle sold
MILEAGE INCONSISTENCY
MILEAGE INCONSISTENCY
2022-07-14
2 years ago
10,004 mi
Duplicate title issued
REBUILT TITLE ISSUED
REBUILT TITLE ISSUED
2019-02-24
5 years ago
39,325 mi
Vehicle serviced
Maintenance inspection completed
Maintenance inspection completed
2013 Hyundai Elantra
| Year | 2013 |
| ODO | 7245 mi |
| Seller | Hidden text (Hidden text) |
| Location | Phoenix, AZ, 85008 |
| Date | appeared 3 days ago latest price $8911 |
| Sale Website Type | classifieds |
| Notes | |
| Hidden text | |
sale information provided by user #61196


All photos above are REAL and display ACTUAL car. After you get the report you will see full resolution photos.
Tech Specs
| Body Style | Sedan |
| Cylinders | 4 |
| Drive | FWD |
| Fuel Type | Gasoline |
Model Analytics & Market Report
We've analyzed more than 114,200 sales records of this model and here are some numbers.
The average price for new (MSRP) 2013 HYUNDAI ELANTRA in 2013 was $20,800.
The average price for used 2013 HYUNDAI ELANTRA nowadays in 2024 is $8,991 which is 43% from the original price.
Estimated mileage driven per year is 10,128 miles.
For this model we also have depreciation curve, photos, list of features and options, and other analytics.
Take a look at 2013 HYUNDAI ELANTRA model page in BADVIN vehicles catalog.
Depreciation
The graph below is a depreciation curve for 2013 HYUNDAI ELANTRA. It shows how much this model looses per year in price. This analytics is calculated using sales records from BADVIN database.
The table below shows average price for used 2013 HYUNDAI ELANTRA in each year since the year of manufacturing, current year price and projected price in the future years.
You can scroll the table horizontally to see all columns.
| Year | Average Mileage | Average Price | % Left | % Lost | ||
|---|---|---|---|---|---|---|
| 2013 MSRP | 0 mi | $20,800 | — | — | 100% | 0% |
| 2013 | 10,128 mi | $22,990 | −$2,190 | −10.53% | 110.53% | -10.53% |
| 2014 | 20,256 mi | $21,675 | +$1,315 | +5.72% | 104.21% | -4.21% |
| 2015 | 30,384 mi | $19,998 | +$1,677 | +7.74% | 96.14% | 3.86% |
| 2016 | 40,512 mi | $18,987 | +$1,011 | +5.06% | 91.28% | 8.72% |
| 2017 | 50,640 mi | $15,988 | +$2,999 | +15.8% | 76.87% | 23.13% |
| → Visit 2013 HYUNDAI ELANTRA depreciation page to see full data. | ||||||
Price vs Mileage
The graph below shows how mileage affects the price for 2013 HYUNDAI ELANTRA. This data was calculated using sales records from BADVIN database.
The table below shows average price for used 2013 HYUNDAI ELANTRA by mileage and number of sales.
You can scroll the table horizontally to see all columns.
| Mileage | Average Price | Sample Size |
|---|---|---|
| 15,000 mi | $13,098 | 11 sales |
| 20,000 mi | $14,998 | 31 sales |
| 25,000 mi | $13,597 | 42 sales |
| 30,000 mi | $11,701 | 41 sales |
| 35,000 mi | $11,395 | 51 sales |
| 40,000 mi | $12,888 | 97 sales |
| → Visit 2013 HYUNDAI ELANTRA depreciation page to see full data. | ||
Get FULL ACCESS to the vehicle history report and see all blurred info.
⭐ Read 205+ reviews from our customers who used BADVIN to avoid buying junk vehicles.
Testimonials from our customers
I always rely on badvin to check out any used car before I buy. It gives such a complete history, including past accidents, service records, recalls and much more. Feel so much more confident as a used car shopper having this info.

Sofia Garcia
verified on Trustpilot
As a broke college kid I almost settled for a sketchy 2005 Altima cuz it was cheap. but splurged on the report from badvin 1st. soooo glad I did - turned out it had been totalled and rebuilt. spending a little saved me from wasting $1000s!
Sophie
verified on Trustpilot
As a used car dealer, I rely on badvin.org for checking every vehicle I'm considering purchasing at auction. The comprehensive reports give me peace of mind and help me avoid problem cars. Photos of past sales have saved me from overpaying many times. Worth every penny!
Misha
verified on Trustpilot
I buy rebuilt title cars at copart to fix and resell. was hoping BadVin reports wud have more detail on damage history to help me value cars before bidding, Carfax is better for that. but for clean title vehicles it seems pretty useful
Fatima
verified on Trustpilot
Compare to other 2013 HYUNDAI ELANTRA


Other vehicles sales records


Frequently asked questions
Aftermarket modifications can affect the depreciation of 2013 HYUNDAI ELANTRA either positively, by enhancing appeal to certain buyers, or negatively, by deterring those who prefer stock condition.
Yes, in many cases, you can determine the type of drivetrain a 2013 HYUNDAI ELANTRA has from its VIN if the manufacturer encodes this information within the VIN.
A VIN alone does not typically provide fuel economy details directly; however, it can identify the vehicle model and engine type, which you can cross-reference with fuel economy data from other sources.
The duration each owner kept the 2013 HYUNDAI may provide insights into how the vehicle was valued and maintained over its lifetime, subject to record availability.
You can track the depreciation of your car by monitoring market trends, checking online valuation tools, and staying informed about new model releases.
To possibly get a vehicle history report by VIN, you can enter the VIN on our website's search tool; the availability and detail of the report will depend on the data accessible for that specific VIN.


