
BADVIN vehicle history report for
2013 HYUNDAI SONATAVIN: 5NPEB4AC3DH532268
Get FULL ACCESS to the vehicle history report and see all blurred info.
⭐ Read 206+ reviews from our customers who used BADVIN to avoid buying junk vehicles.
Historical Records
54 events
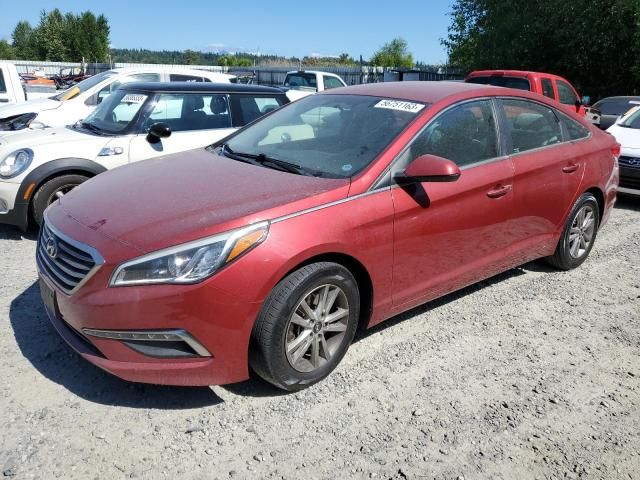
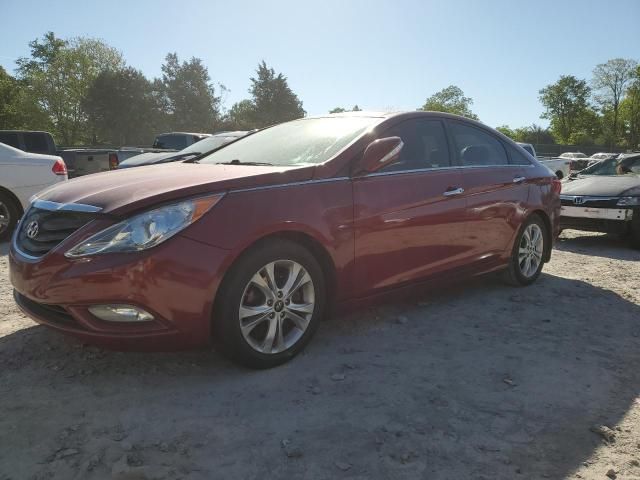
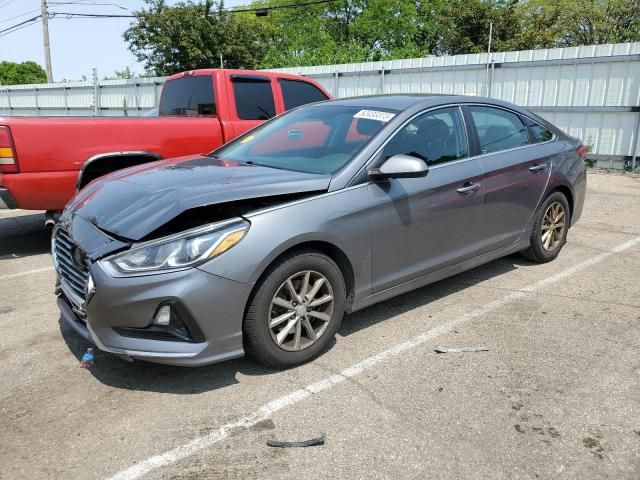
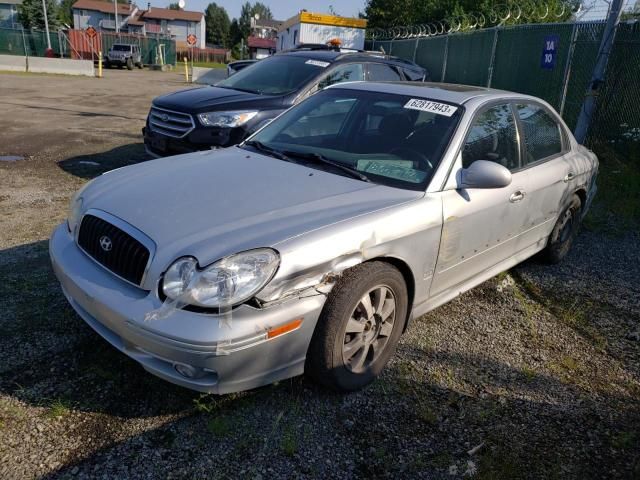
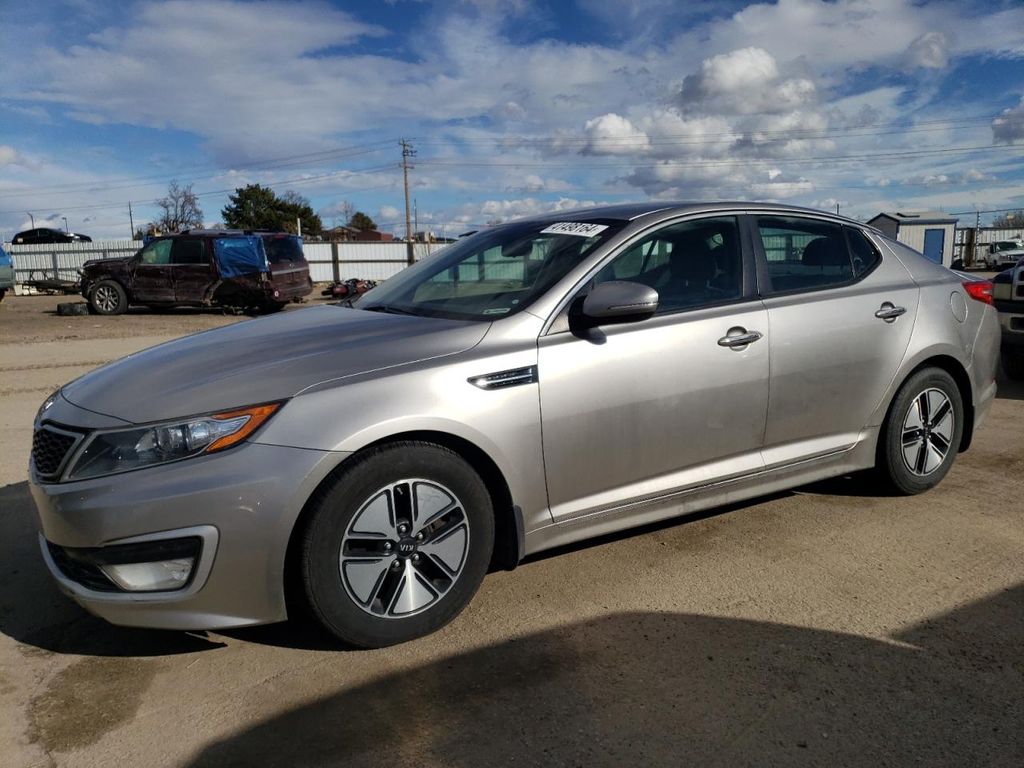
Photos
20 images
Sales History
2 records
Sale Prices
1 records
Market report
Price analytics
Historical Records
Historical records may include service and maintenance records, title status (clean, junk, salvage), insurance records, number of owners, registration events and states, and other information.
You can find more information about historical records in BADVIN reports and see more examples here.
Available 54 historical records for VIN 5NPEB4AC3DH532268
Latest reported mileage: 297 mi
Below you can see some examples of what these records could look like.
2022-09-17
2 years ago
53,704 mi
REBUILT TITLE ISSUED
2021-09-29
3 years ago
6,198 mi
Vehicle sold
MILEAGE INCONSISTENCY
MILEAGE INCONSISTENCY
2019-12-10
5 years ago
38,606 mi
Odometer reading reported
Sale Record
2013 HYUNDAI SONATA GLS
sold
| Year | 2013 |
| Title | Hidden text (Hidden text) |
| ODO | 5786 mi (Hidden text) |
| Damage | Hidden text, Hidden text |
| Location | Rancho Cucamonga, CA, 91730 |
| Date | ended 3 years ago |
| Sale Website Type | salvage or insurance auction |
sale information provided by user #112773


All photos above are REAL and display ACTUAL car. After you get the report you will see full resolution photos.
Tech Specs
| Color | BLACK |
| Transmission | AUTOMATIC |
| Engine | 2.4L 4 |
| Drive | Front-wheel Drive |
| Fuel Type | GAS |
Model Analytics & Market Report
We've analyzed more than 90,200 sales records of this model and here are some numbers.
The average price for new (MSRP) 2013 HYUNDAI SONATA in 2013 was $25,559.
The average price for used 2013 HYUNDAI SONATA nowadays in 2024 is $9,463 which is 37% from the original price.
Estimated mileage driven per year is 10,286 miles.
For this model we also have depreciation curve, photos, list of features and options, and other analytics.
Take a look at 2013 HYUNDAI SONATA model page in BADVIN vehicles catalog.
Depreciation
The graph below is a depreciation curve for 2013 HYUNDAI SONATA. It shows how much this model looses per year in price. This analytics is calculated using sales records from BADVIN database.
The table below shows average price for used 2013 HYUNDAI SONATA in each year since the year of manufacturing, current year price and projected price in the future years.
You can scroll the table horizontally to see all columns.
| Year | Average Mileage | Average Price | % Left | % Lost | ||
|---|---|---|---|---|---|---|
| 2013 MSRP | 0 mi | $25,559 | — | — | 100% | 0% |
| 2013 | 10,286 mi | $29,626 | −$4,067 | −15.91% | 115.91% | -15.91% |
| 2014 | 20,572 mi | $23,943 | +$5,683 | +19.18% | 93.68% | 6.32% |
| 2015 | 30,858 mi | $23,395 | +$548 | +2.29% | 91.53% | 8.47% |
| 2016 | 41,144 mi | $20,999 | +$2,396 | +10.24% | 82.16% | 17.84% |
| 2017 | 51,430 mi | $20,267 | +$732 | +3.49% | 79.29% | 20.71% |
| → Visit 2013 HYUNDAI SONATA depreciation page to see full data. | ||||||
Price vs Mileage
The graph below shows how mileage affects the price for 2013 HYUNDAI SONATA. This data was calculated using sales records from BADVIN database.
The table below shows average price for used 2013 HYUNDAI SONATA by mileage and number of sales.
You can scroll the table horizontally to see all columns.
| Mileage | Average Price | Sample Size |
|---|---|---|
| 20,000 mi | $15,997 | 20 sales |
| 25,000 mi | $13,420 | 19 sales |
| 30,000 mi | $12,287 | 20 sales |
| 35,000 mi | $13,162 | 44 sales |
| 40,000 mi | $12,995 | 56 sales |
| 45,000 mi | $12,499 | 67 sales |
| → Visit 2013 HYUNDAI SONATA depreciation page to see full data. | ||
Get FULL ACCESS to the vehicle history report and see all blurred info.
⭐ Read 206+ reviews from our customers who used BADVIN to avoid buying junk vehicles.
Testimonials from our customers
After a bad experience buying a used car that turned out to have major issues, I now use Bad VIN to thoroughly check every vehicle i consider. It costs a bit more than other services but the detailed records and photos of past sales are wotrh it for the added peace of mind.

Olivia Johnson
verified on Trustpilot
As a first time used car buyer, I was nervous about getting ripped off. The vehicle report from badvin gave me so much more confidence - it confirmed the car had a clean history and the mileage lined up. Such a relief to have that peace of mind.
Chloe Martin
verified on Trustpilot
Was shopping for a used Range Rover and found one that seemed suspiciously cheap. The badVIN report revealed it had been in a major front end collision, with photos showing the damage. Steered clear of that one and saved myself a ton of headaches!!
Ava Patel
verified on Trustpilot
I always rely on badvin to check out any used car before I buy. It gives such a complete history, including past accidents, service records, recalls and much more. Feel so much more confident as a used car shopper having this info.
Sofia Garcia
verified on Trustpilot
Compare to other 2013 HYUNDAI SONATA


2015 HYUNDAI SONATA
in 4 days, 83,695 mi
est retail value $15,310
buy now price $5,000
VIN 5NPE34AF1FH065233
Other vehicles sales records


2019 LAND ROVER RANGE ROVER VELAR
in 17 hours, 23,404 mi
est retail value $41,462
VIN SALYB2EX0KA215186


2014 HONDA CIVIC
in 4 days, 138,160 mi
est retail value $7,871
buy now price $1,250
VIN 2HGFB2F59EH504005

2009 MERCEDES-BENZ C-CLASS
in 2 days,
est retail value $10,588
buy now price $950
VIN WDDGF56X79R045028

Frequently asked questions
The Monroney label helps you understand the added features on a 2013 HYUNDAI SONATA by listing optional equipment and packages included in the vehicle, along with their pricing.
The window sticker benefits car dealers by providing a standardized set of information that aids in promoting transparency and trust with customers, facilitating a smoother sales process.
Dismantled status, if noted, shows the vehicle has been taken apart for parts or salvage, significantly impacting the 2013 HYUNDAI's value and functionality.
You can find your vehicle's VIN on the dashboard on the driver's side, visible through the windshield, and on your vehicle's registration documents.
The last six digits of a VIN are the vehicle's unique serial number, which identifies the specific unit among others from the same model and production line.
Total loss is usually determined when the cost of repairing the vehicle exceeds a certain percentage of its value before the damage occurred, as decided by the insurance company, if such data is recorded.


