
BADVIN vehicle history report for
2010 TOYOTA CAMRYVIN: 4T1BK3EK8AU602603
Get FULL ACCESS to the vehicle history report and see all blurred info.
⭐ Read 205+ reviews from our customers who used BADVIN to avoid buying junk vehicles.
Historical Records
events
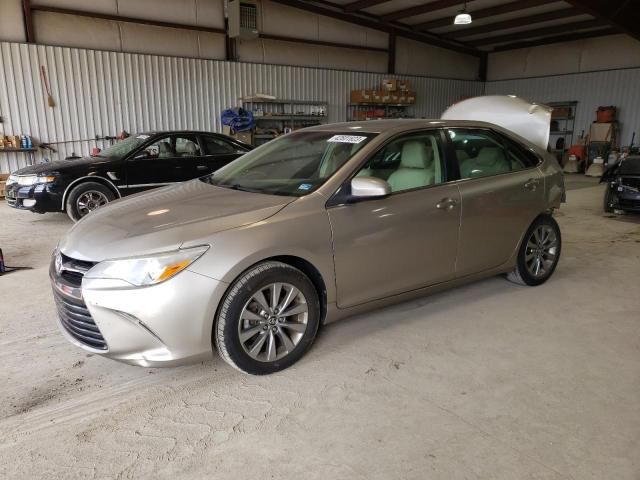
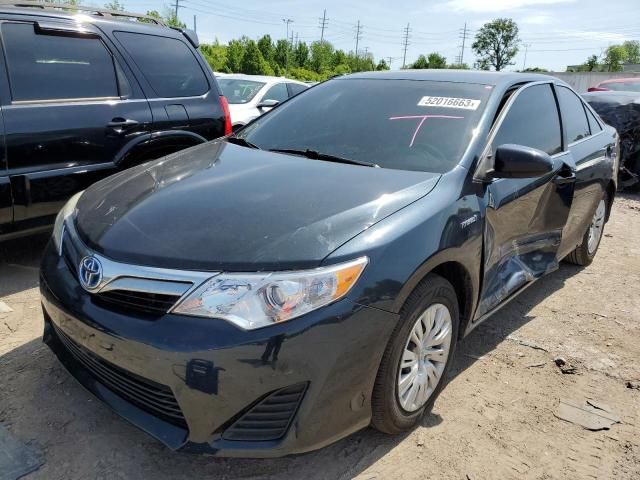
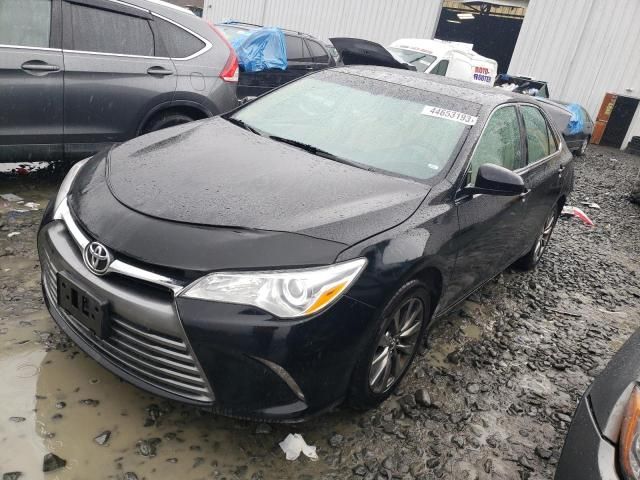
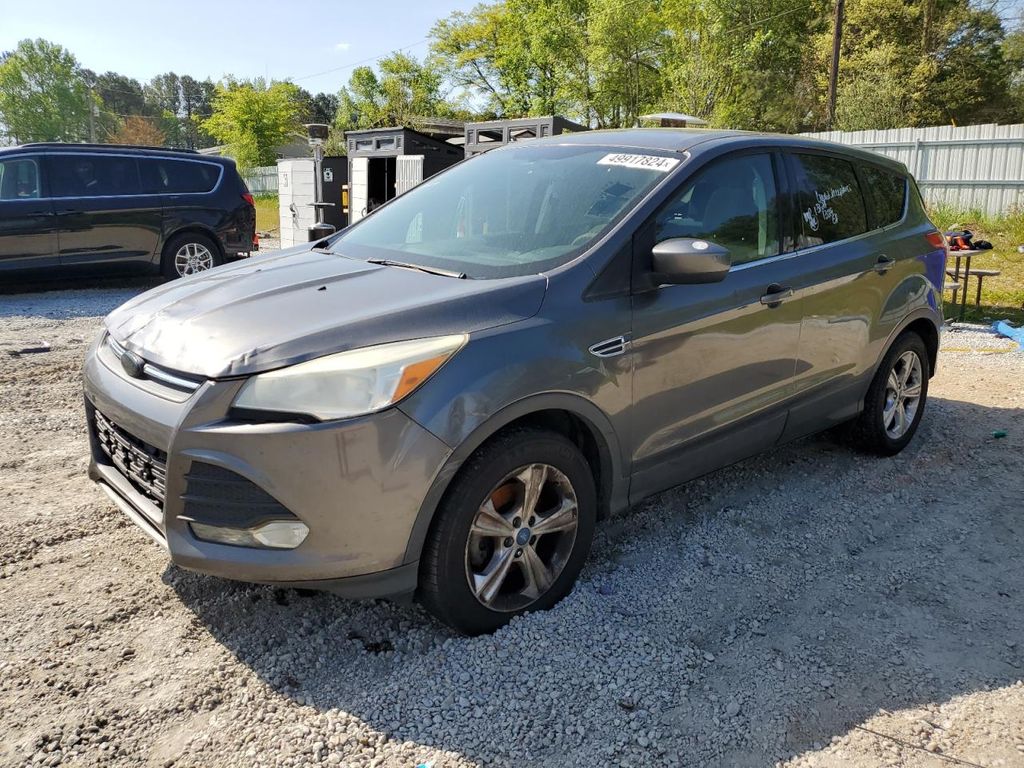
Photos
10 images
Sales History
1 records
Market report
Price analytics
Historical Records
Historical records may include service and maintenance records, title status (clean, junk, salvage), insurance records, number of owners, registration events and states, and other information.
You can find more information about historical records in BADVIN reports and see more examples here.
Available historical records for VIN 4T1BK3EK8AU602603
Latest reported mileage: 208 mi
Below you can see some examples of what these records could look like.
2023-04-20
a year ago
91,291 mi
Damage reported
Damage to front
Damage to front
2021-10-09
3 years ago
7,999 mi
Vehicle serviced
Maintenance inspection completed
Maintenance inspection completed
2020-05-11
4 years ago
31,813 mi
Accident reported: minor damage with another motor vehicle
Damage to rear
Damage to rear
Sale Record
Sale Date
2 years ago
Location
MILWAUKEE NORTH, WI, 53201
2010 TOYOTA CAMRY SE
sold
| Year | 2010 |
| ODO | — |
| Location | MILWAUKEE NORTH, WI, 53201 |
| Date | ended 2 years ago |
| Sale Website Type | salvage or insurance auction |
sale information provided by user #1031008


All photos above are REAL and display ACTUAL car. After you get the report you will see full resolution photos.
Tech Specs
Model Analytics & Market Report
We've analyzed more than 39,300 sales records of this model and here are some numbers.
The average price for new (MSRP) 2010 TOYOTA CAMRY in 2010 was $27,765.
The average price for used 2010 TOYOTA CAMRY nowadays in 2024 is $8,995 which is 32% from the original price.
Estimated mileage driven per year is 9,684 miles.
For this model we also have depreciation curve, photos, list of features and options, and other analytics.
Take a look at 2010 TOYOTA CAMRY model page in BADVIN vehicles catalog.
Depreciation
The graph below is a depreciation curve for 2010 TOYOTA CAMRY. It shows how much this model looses per year in price. This analytics is calculated using sales records from BADVIN database.
The table below shows average price for used 2010 TOYOTA CAMRY in each year since the year of manufacturing, current year price and projected price in the future years.
You can scroll the table horizontally to see all columns.
| Year | Average Mileage | Average Price | % Left | % Lost | ||
|---|---|---|---|---|---|---|
| 2010 MSRP | 0 mi | $27,765 | — | — | 100% | 0% |
| 2010 | 9,684 mi | $28,990 | −$1,225 | −4.41% | 104.41% | -4.41% |
| 2011 | 19,368 mi | $25,949 | +$3,041 | +10.49% | 93.46% | 6.54% |
| 2012 | 29,052 mi | $24,900 | +$1,049 | +4.04% | 89.68% | 10.32% |
| 2013 | 38,736 mi | $23,726 | +$1,174 | +4.71% | 85.45% | 14.55% |
| 2014 | 48,420 mi | $22,910 | +$816 | +3.44% | 82.51% | 17.49% |
| → Visit 2010 TOYOTA CAMRY depreciation page to see full data. | ||||||
Price vs Mileage
The graph below shows how mileage affects the price for 2010 TOYOTA CAMRY. This data was calculated using sales records from BADVIN database.
The table below shows average price for used 2010 TOYOTA CAMRY by mileage and number of sales.
You can scroll the table horizontally to see all columns.
| Mileage | Average Price | Sample Size |
|---|---|---|
| 35,000 mi | $14,500 | 27 sales |
| 40,000 mi | $12,996 | 23 sales |
| 45,000 mi | $13,245 | 23 sales |
| 50,000 mi | $12,988 | 39 sales |
| 55,000 mi | $12,400 | 53 sales |
| 60,000 mi | $12,900 | 76 sales |
| → Visit 2010 TOYOTA CAMRY depreciation page to see full data. | ||
Get FULL ACCESS to the vehicle history report and see all blurred info.
⭐ Read 205+ reviews from our customers who used BADVIN to avoid buying junk vehicles.
Testimonials from our customers
I've tried a bunch of different vehicle history reports over the years and badvin.org has been the most comprehensive by far. Stuff like service records, ownership history, lien and repo info that I haven't found elsewhere. Def go-to resource when shopping for used vehicles now.

Levi Johnson
verified on Trustpilot
After a bad experience buying a used car that turned out to have major issues, I now use Bad VIN to thoroughly check every vehicle i consider. It costs a bit more than other services but the detailed records and photos of past sales are wotrh it for the added peace of mind.
Olivia Johnson
verified on Trustpilot
As a car dealer importing vehicles from the US to Mexico, I rely on badvin for comprehensive history reports before bidding at auctions. Their info has helped me avoid several salvage vehicles and is more thorough than carfax. A must-have service!
Javier Ramirez
verified on Trustpilot
BadVin's vehicle history report is a must-have before buying any used vehicle. It's saved me from a few lemons over the years - cars that looked great on the surface but had hidden issues like accidents or title problems. Well worth the price.
Camila Santos
verified on Trustpilot
Compare to other 2010 TOYOTA CAMRY


2017 TOYOTA CAMRY
18 days ago, 114,569 mi
est retail value $14,677
buy now price $4,400
VIN 4T1BF1FK6HU395226


2018 TOYOTA CAMRY
18 days ago, 38,845 mi
est retail value $22,369
buy now price $3,500
VIN 4T1B11HK8JU587409


Other vehicles sales records


2015 FORD FUSION
in 16 days, 196,884 mi
est retail value $10,052
buy now price $1,650
VIN 3FA6P0HD8FR152748


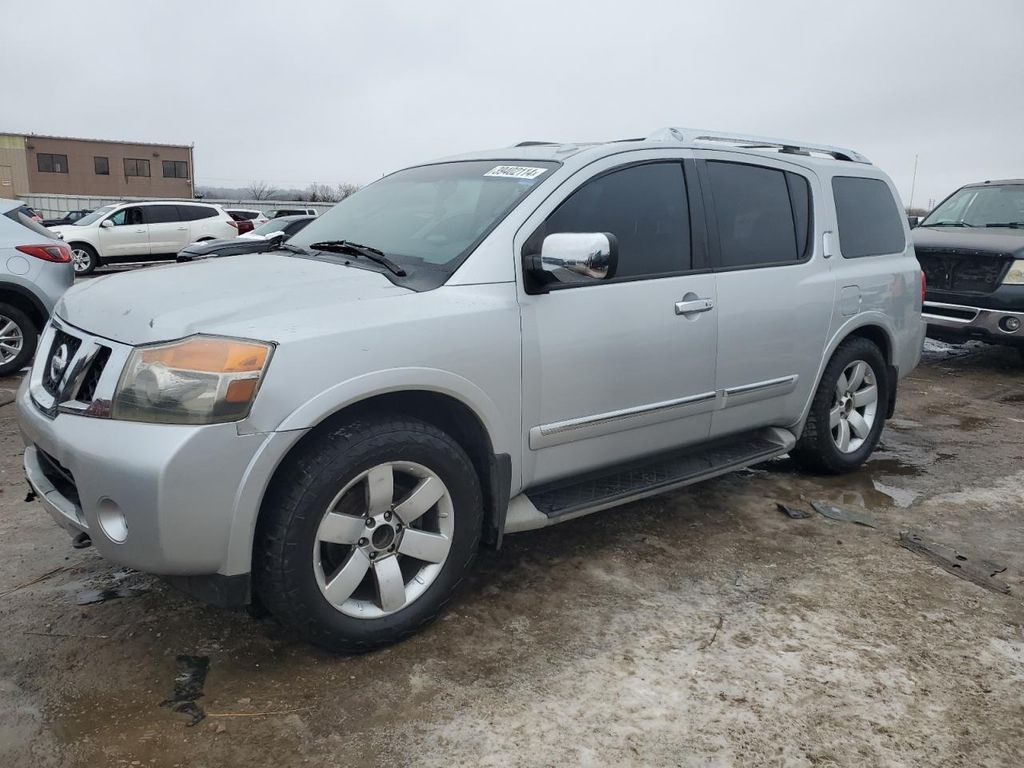
2012 NISSAN ARMADA
in 3 days, 210,540 mi
est retail value $11,200
buy now price $2,100
VIN 5N1BA0NDXCN613392

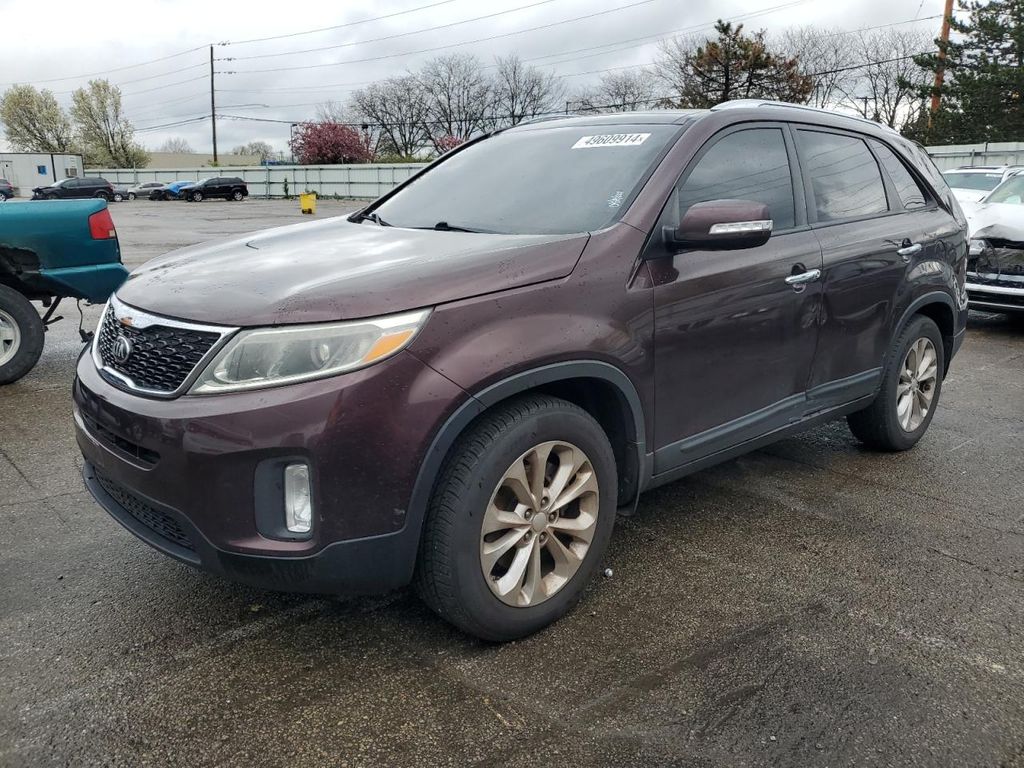
2015 KIA SORENTO
in 16 days, 164,093 mi
est retail value $12,490
buy now price $2,150
VIN 5XYKU4A76FG577313

2010 HONDA INSIGHT
in 3 days, 205,600 mi
est retail value $7,775
buy now price $1,300
VIN JHMZE2H79AS032360

Frequently asked questions
Yes, a VIN decoder can often determine if specific safety technologies are equipped on a 2010 TOYOTA CAMRY based on the trim and optional equipment codes within the VIN.
Taxes are not typically shown on the Monroney label for 2010 TOYOTA vehicles as they vary by location and are usually calculated and added at the time of purchase.
Our reports might specify the point of impact and damage location on the 2010 TOYOTA vehicle, offering a clearer understanding of the accident, if such details are available.
Proper maintenance and good condition can slow the depreciation of a 2010 TOYOTA CAMRY by making it more attractive to potential buyers, thereby preserving more of its value.
Reports might include collision data, crash ratings, vehicle specifications from VIN decode, and more, providing a detailed profile of the 2010 TOYOTA vehicle, depending on data availability.
Discrepancies between a window sticker and actual dealer pricing can occur due to additional dealer markup, optional add-ons not included in the sticker, or regional pricing differences.
The window sticker details the destination charges for a 2010 TOYOTA CAMRY, which are the fees associated with delivering the vehicle from the manufacturer to the dealership.
Factors to consider when estimating the future resale value include the car's historical depreciation rate, current market trends, overall vehicle condition, and mileage.
Registration information, if available, includes current and historical registration data, offering insights into the 2010 TOYOTA CAMRY's ownership timeline.
The Monroney label can indirectly reflect the resale value of 2010 TOYOTA vehicles by detailing features and specifications that are valued in the used car market.


