BADVIN vehicle history report for
2018 TOYOTA CAMRYVIN: 4T1B11HK0JU001947
Get FULL ACCESS to the vehicle history report and see all blurred info.
⭐ Read 205+ reviews from our customers who used BADVIN to avoid buying junk vehicles.
Historical Records
events
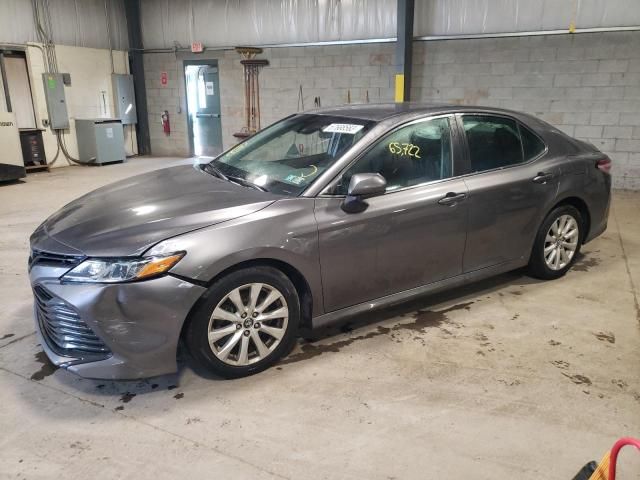
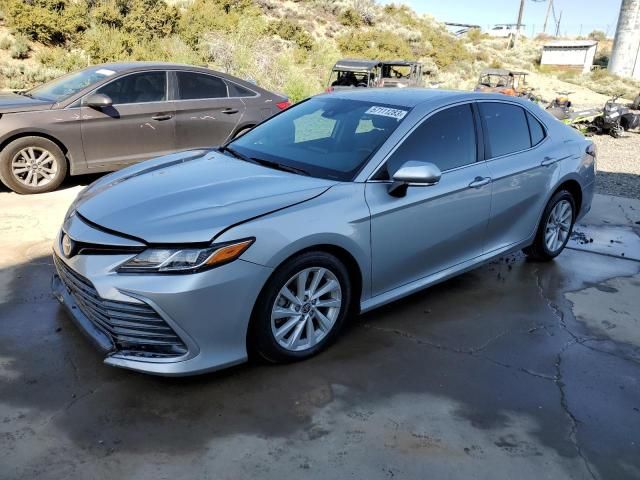
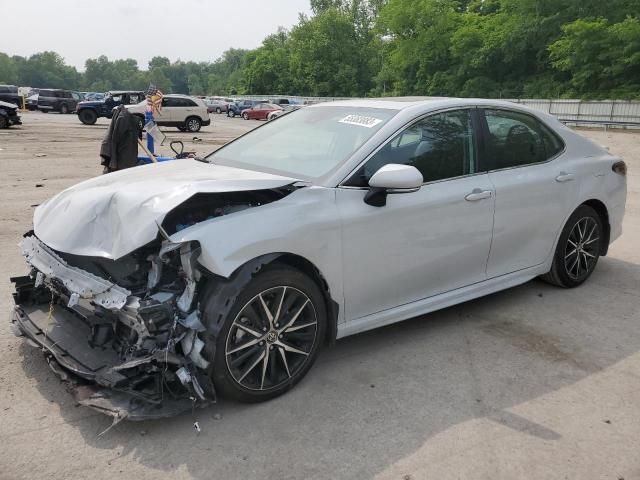
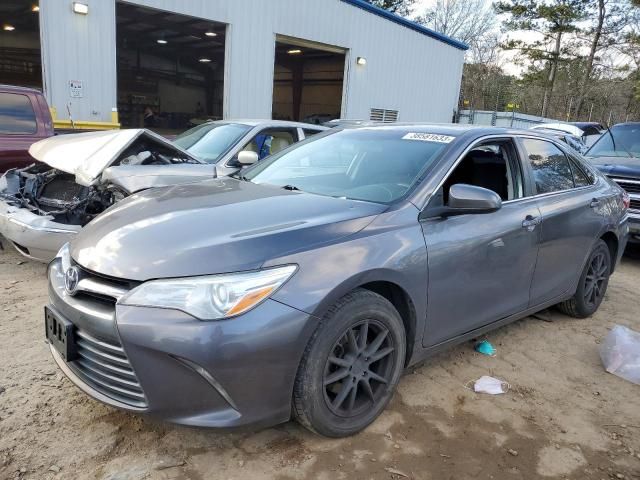
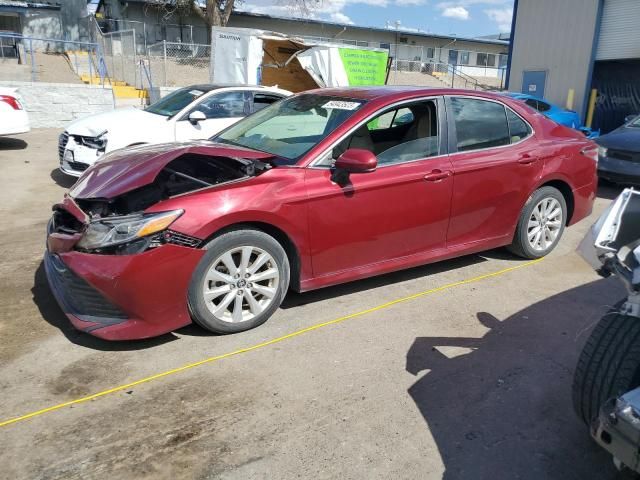
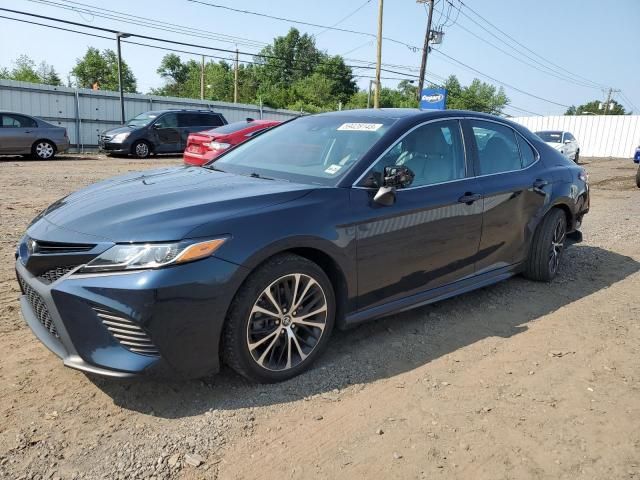
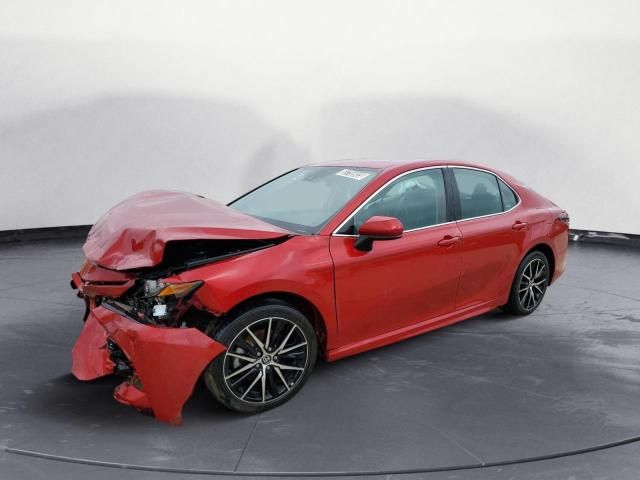
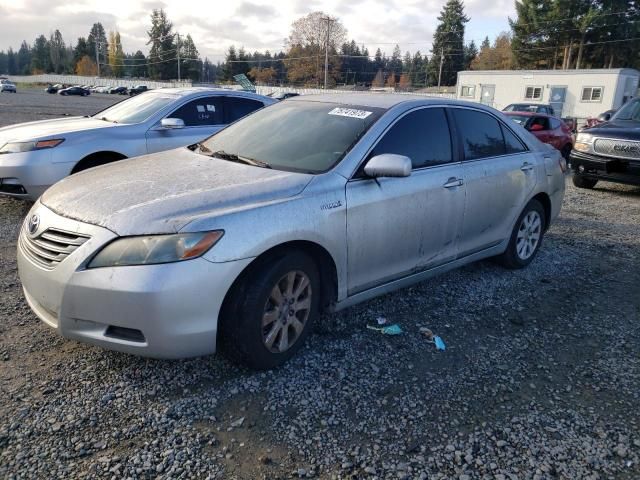
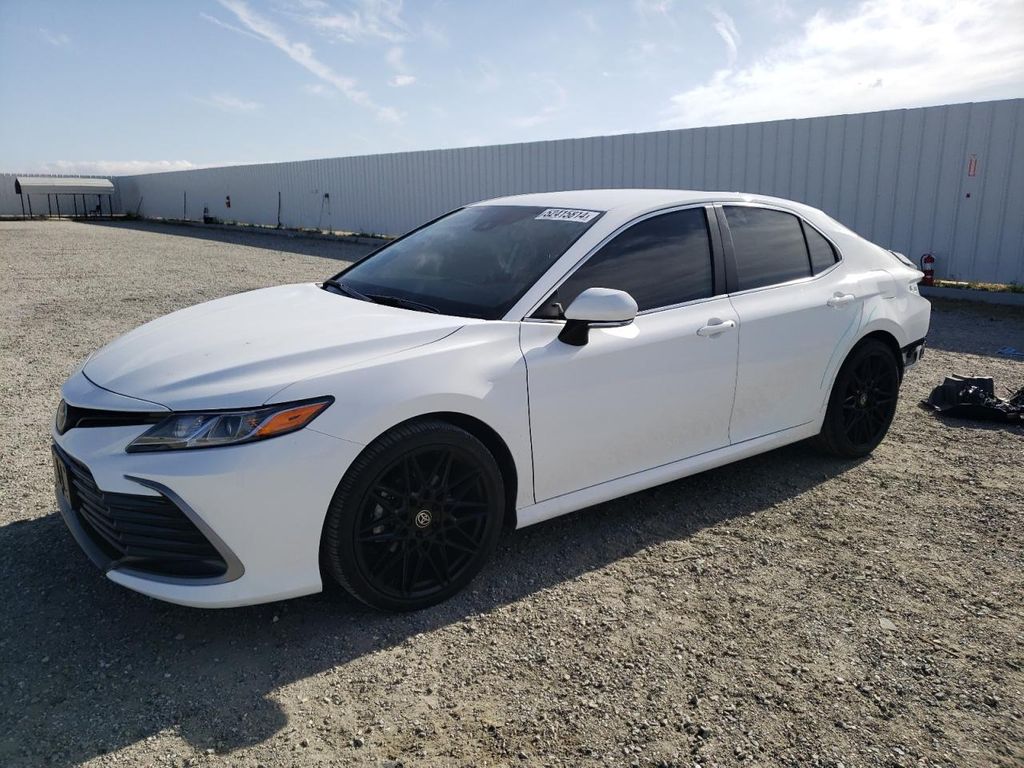
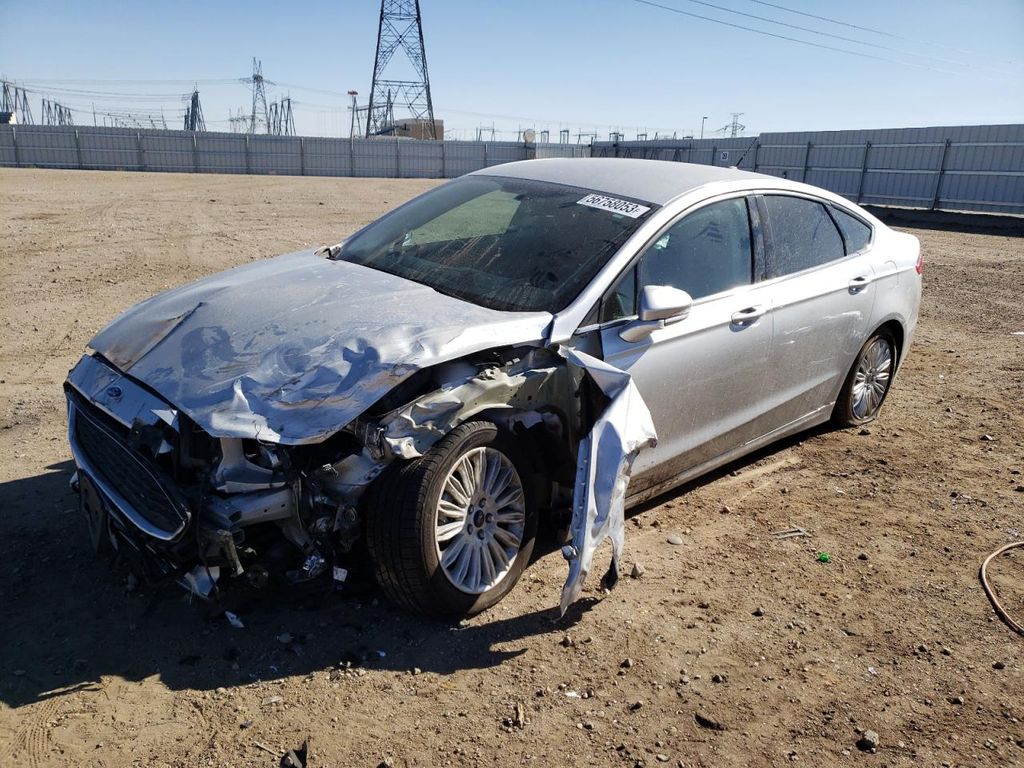
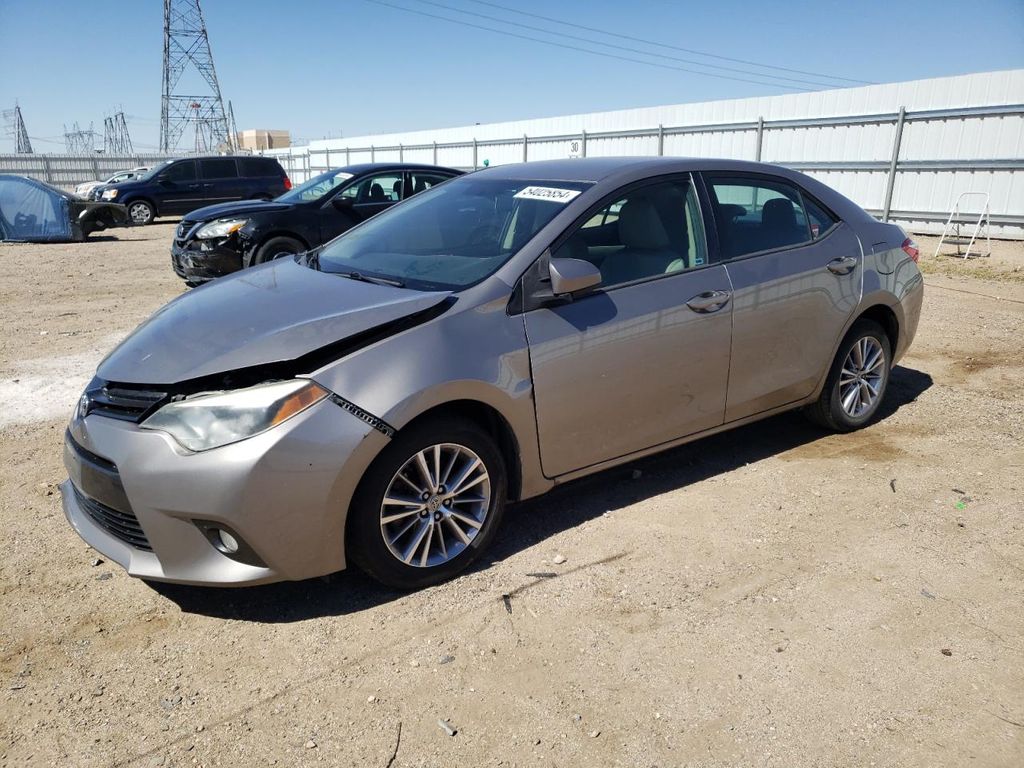
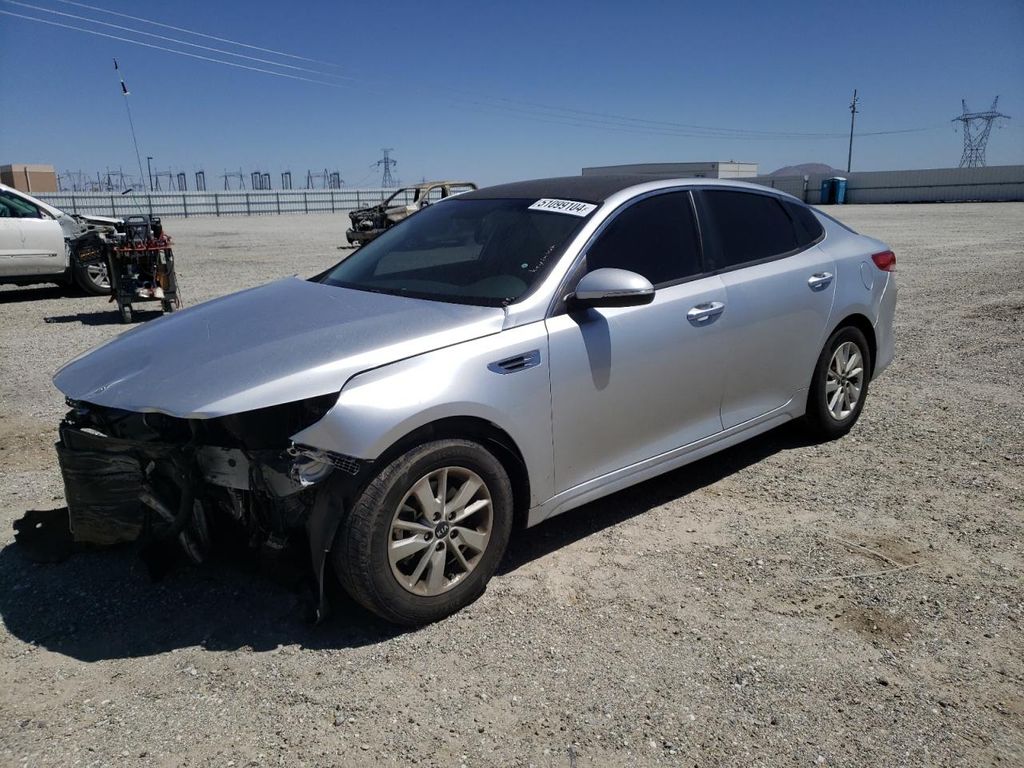
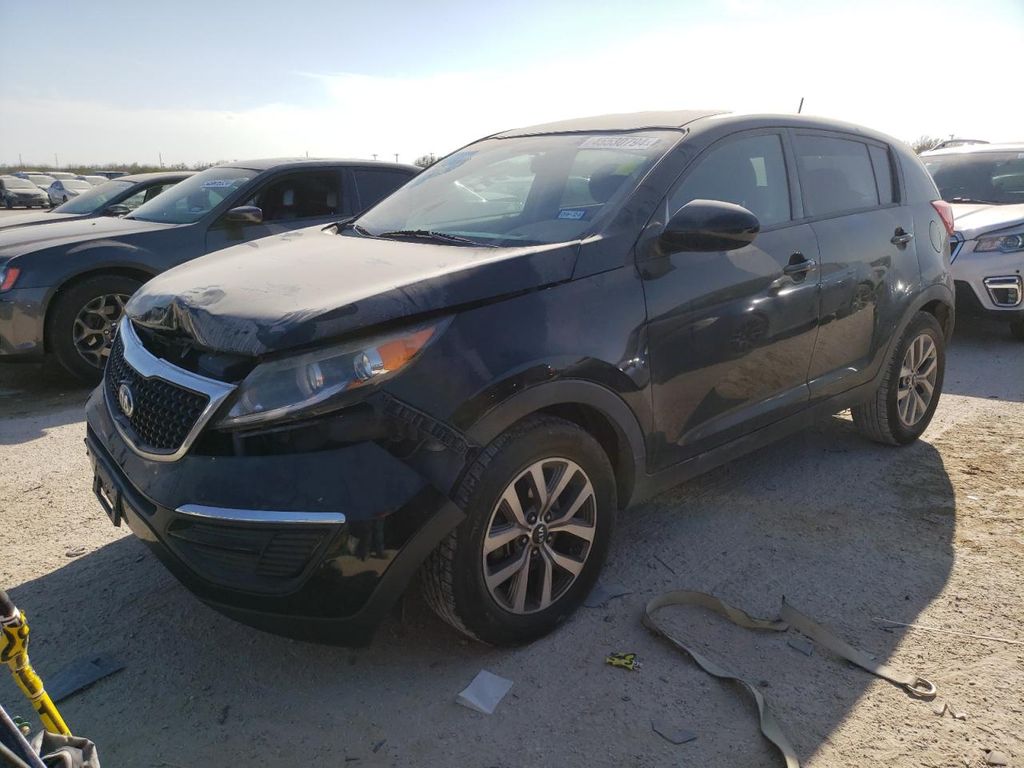
Photos
12 images
Sales History
1 records
Market report
Price analytics
Historical Records
Historical records may include service and maintenance records, title status (clean, junk, salvage), insurance records, number of owners, registration events and states, and other information.
You can find more information about historical records in BADVIN reports and see more examples here.
Available historical records for VIN 4T1B11HK0JU001947
Latest reported mileage: 445 mi
Below you can see some examples of what these records could look like.
2023-04-26
a year ago
140,052 mi
Vehicle serviced
Tire repaired
Tire repaired
2022-06-11
2 years ago
20,653 mi
Duplicate title issued
REBUILT TITLE ISSUED
REBUILT TITLE ISSUED
2019-10-13
5 years ago
38,857 mi
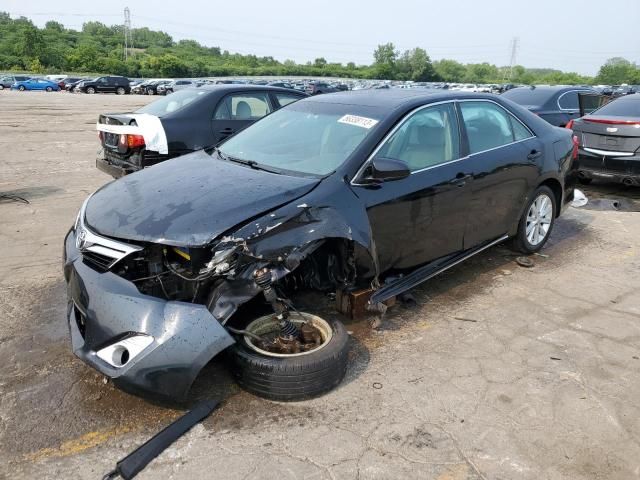
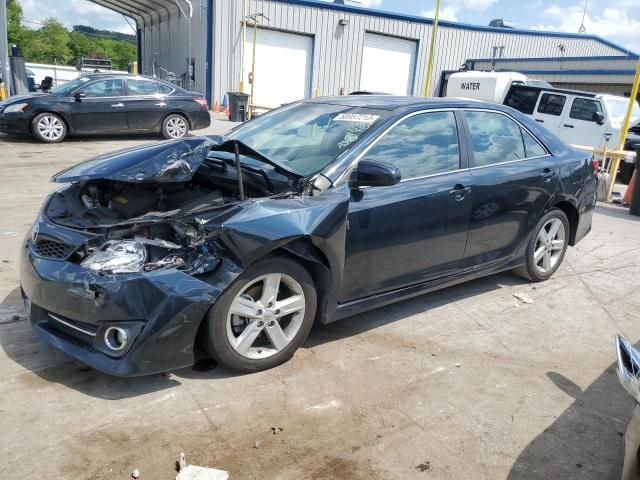
Damage reported
Damage to front
Damage to front
Sale Record
2018 TOYOTA CAMRY L
active
| Year | 2018 |
| Title | Hidden text (Hidden text) |
| ODO | 3020 mi (Hidden text) |
| Damage | Hidden text, Hidden text |
| Estimated Retail Value | $9930 |
| Estimated Repair Cost | $4071 (858%) |
| Seller | Hidden text |
| Location | Chalfont, PA, USA, 18914 |
| Date | ended 17 days ago |
| Sale Website Type | salvage or insurance auction |
sale information provided by user #400510


All photos above are REAL and display ACTUAL car. After you get the report you will see full resolution photos.
Tech Specs
| Color | GRAY |
| Transmission | AUTOMATIC |
| Engine | 2.5L |
| Cylinders | 4 |
| Drive | Front-wheel Drive |
| Fuel Type | GAS |
Model Analytics & Market Report
We've analyzed more than 279,300 sales records of this model and here are some numbers.
The average price for new (MSRP) 2018 TOYOTA CAMRY in 2018 was $27,765.
The average price for used 2018 TOYOTA CAMRY nowadays in 2024 is $19,988 which is 72% from the original price.
Estimated mileage driven per year is 9,684 miles.
For this model we also have depreciation curve, photos, list of features and options, and other analytics.
Take a look at 2018 TOYOTA CAMRY model page in BADVIN vehicles catalog.
Depreciation
The graph below is a depreciation curve for 2018 TOYOTA CAMRY. It shows how much this model looses per year in price. This analytics is calculated using sales records from BADVIN database.
The table below shows average price for used 2018 TOYOTA CAMRY in each year since the year of manufacturing, current year price and projected price in the future years.
You can scroll the table horizontally to see all columns.
| Year | Average Mileage | Average Price | % Left | % Lost | ||
|---|---|---|---|---|---|---|
| 2018 MSRP | 0 mi | $27,765 | — | — | 100% | 0% |
| 2018 | 9,684 mi | $28,990 | −$1,225 | −4.41% | 104.41% | -4.41% |
| 2019 | 19,368 mi | $25,949 | +$3,041 | +10.49% | 93.46% | 6.54% |
| 2020 | 29,052 mi | $24,900 | +$1,049 | +4.04% | 89.68% | 10.32% |
| 2021 | 38,736 mi | $23,726 | +$1,174 | +4.71% | 85.45% | 14.55% |
| 2022 | 48,420 mi | $22,910 | +$816 | +3.44% | 82.51% | 17.49% |
| → Visit 2018 TOYOTA CAMRY depreciation page to see full data. | ||||||
Price vs Mileage
The graph below shows how mileage affects the price for 2018 TOYOTA CAMRY. This data was calculated using sales records from BADVIN database.
The table below shows average price for used 2018 TOYOTA CAMRY by mileage and number of sales.
You can scroll the table horizontally to see all columns.
| Mileage | Average Price | Sample Size |
|---|---|---|
| 5,000 mi | $25,998 | 12 sales |
| 10,000 mi | $23,931 | 44 sales |
| 15,000 mi | $23,998 | 56 sales |
| 20,000 mi | $22,998 | 78 sales |
| 25,000 mi | $22,999 | 87 sales |
| 30,000 mi | $22,000 | 160 sales |
| → Visit 2018 TOYOTA CAMRY depreciation page to see full data. | ||
Get FULL ACCESS to the vehicle history report and see all blurred info.
⭐ Read 205+ reviews from our customers who used BADVIN to avoid buying junk vehicles.
Testimonials from our customers
Bad Vin's vehicle history report showed that the 2018 Audi A4 I was about to buy had been in a major accident that was not disclosed by the seller. The severity analysis helped me avoid a bad purchase. Great service!

Sophie Dubois
verified on Trustpilot
I almost bought a 2019 Malibu that seemed like a great deal - low miles and price. But the badvin report showed it used to be a rental fleet vehicle, which the seller didn't disclose. Glad I found out before buying someone else's abused rental!
Benjamin Torres
verified on Trustpilot
I import used luxury cars from US auctions to resell in Russia. The vehicle history reports from badVIN are essential for avoiding problem cars. For a BMW I was bidding on, it uncovered a salvage title from flood damage that other reports missed! That alone pays for the service.
Dmitry Volkov
verified on Trustpilot
Purchased a badvin report before buying a used Lexus RX 350. It revealed a minor accident the seller hadn't mentioned. I still bought the car but used the info to negotiate a lower price. Well worth the cost for the leverage it gave me!
Aiden Patel
verified on Trustpilot
Compare to other 2018 TOYOTA CAMRY
2021 TOYOTA CAMRY
in 5 days, 10,745 mi
est retail value $28,131
buy now price $9,900
VIN 4T1C11BK6MU040222

2018 TOYOTA CAMRY
in 5 days, 24,989 mi
est retail value $23,883
buy now price $7,400
VIN 4T1B11HK6JU542727


Other vehicles sales records
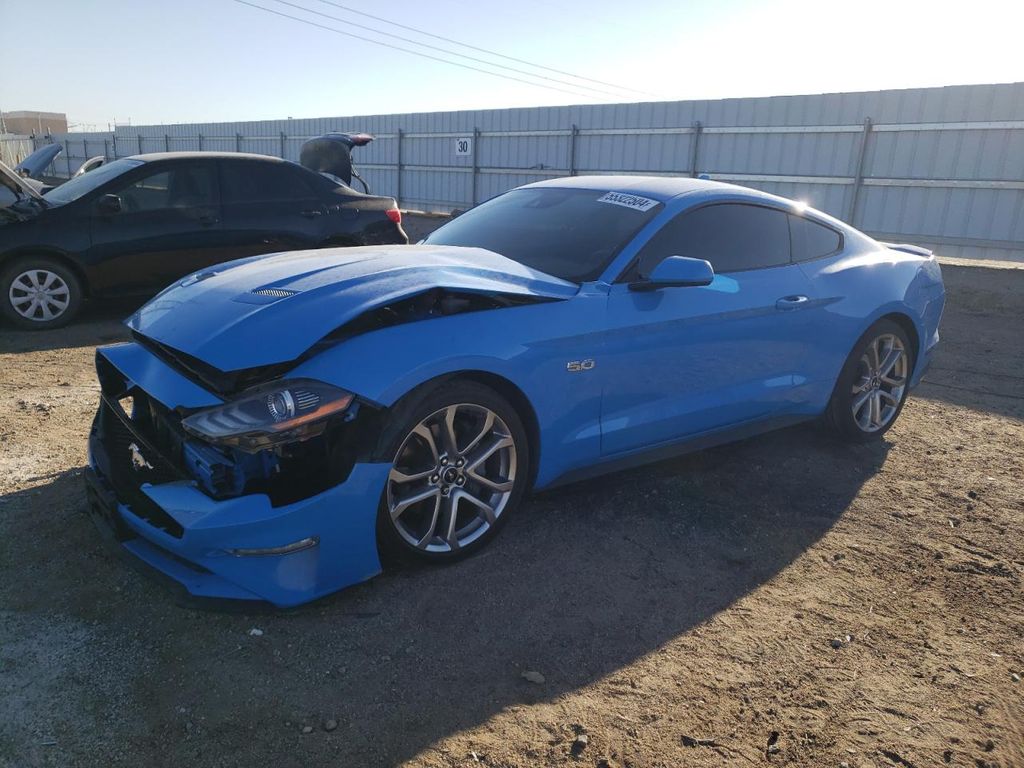
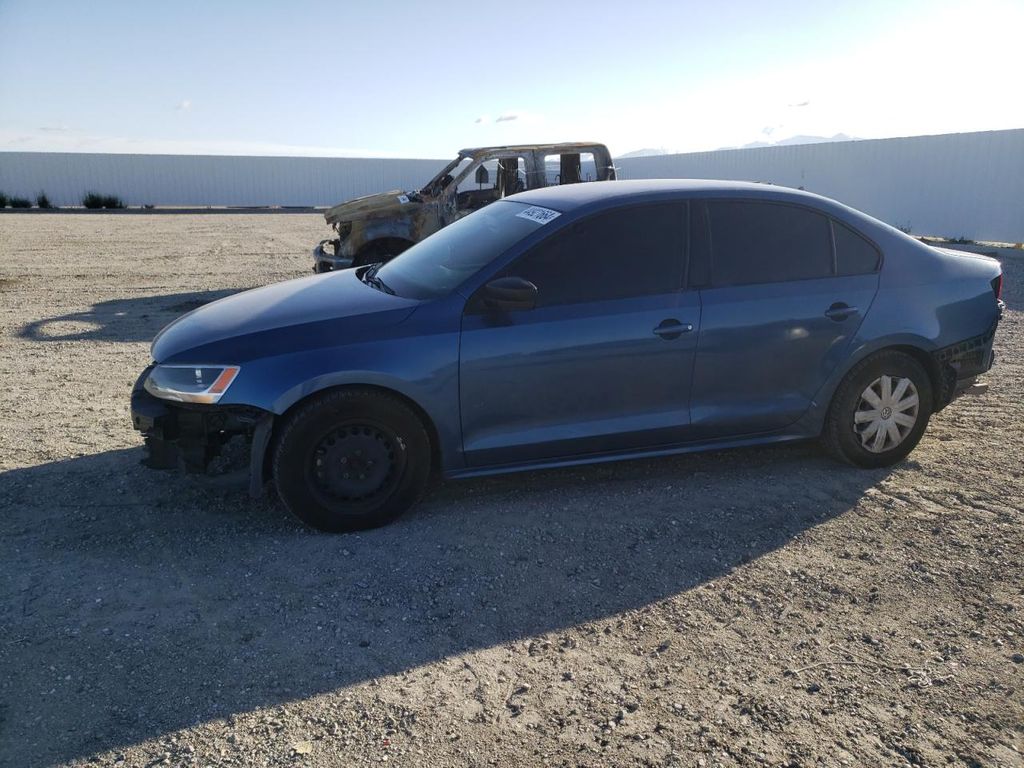
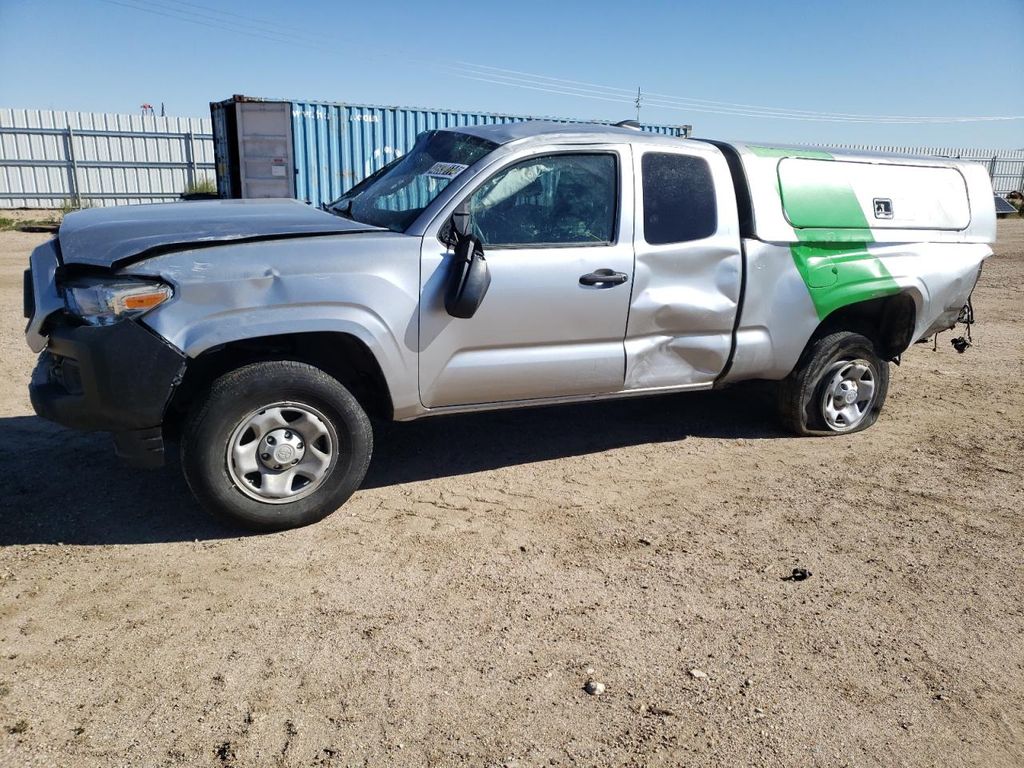
2022 TOYOTA TACOMA
in 2 days, 17,022 mi
est retail value $24,520
buy now price $18,000
VIN 3TYRX5GN2NT058377


Frequently asked questions
VIN decoding can prevent fraud in the sale of 2018 TOYOTA CAMRY vehicles by ensuring the vehicle's details match those recorded officially, thus confirming its identity and legality.
An insurance check can reveal past claims, typically related to accident damage, which might indicate underlying issues not apparent in a physical inspection, if such information is available.
The market value of a vehicle is calculated based on its historical depreciation trends, current condition, mileage, and market trends.
Depreciation directly affects the resale value of a 2018 TOYOTA CAMRY, with faster depreciating vehicles typically having lower resale values over time.
A Monroney label, commonly known as a window sticker, provides detailed information about a vehicle's specifications, features, and pricing when new.
Factors to consider when estimating the future resale value include the car's historical depreciation rate, current market trends, overall vehicle condition, and mileage.
The 'country of origin' in a VIN, indicated by the first one to three characters, tells you where the vehicle was built, which could influence parts availability and design standards.


