
BADVIN vehicle history report for
2009 FORD RANGERVIN: 1FTZR45E09PA06152
Get FULL ACCESS to the vehicle history report and see all blurred info.
⭐ Read 206+ reviews from our customers who used BADVIN to avoid buying junk vehicles.
Historical Records
events
Photos
19 images
Sales History
2 records
Sale Prices
1 records
Market report
Price analytics
Historical Records
Historical records may include service and maintenance records, title status (clean, junk, salvage), insurance records, number of owners, registration events and states, and other information.
You can find more information about historical records in BADVIN reports and see more examples here.
Available historical records for VIN 1FTZR45E09PA06152
Latest reported mileage: 142 mi
Below you can see some examples of what these records could look like.
2024-01-05
6 months ago
93,318 mi
NOT ACTUAL MILEAGE TITLE ISSUED
Titled or registered as lease vehicle
Titled or registered as lease vehicle
2021-12-11
3 years ago
22,577 mi
Duplicate title issued
REBUILT TITLE ISSUED
REBUILT TITLE ISSUED
2021-08-12
3 years ago
49,668 mi
TOTAL LOSS VEHICLE
Collision damage reported
Collision damage reported
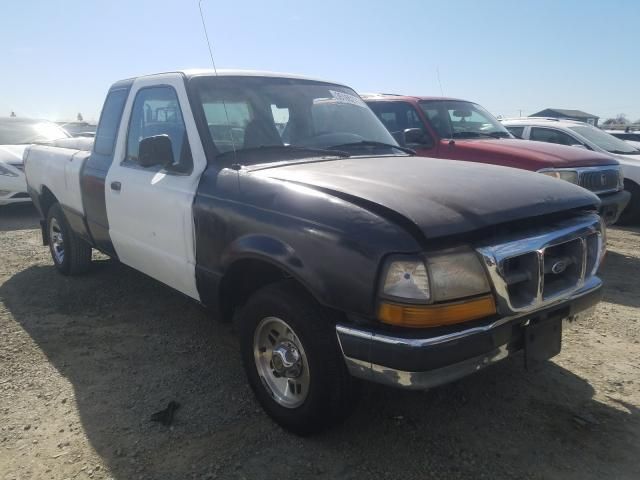
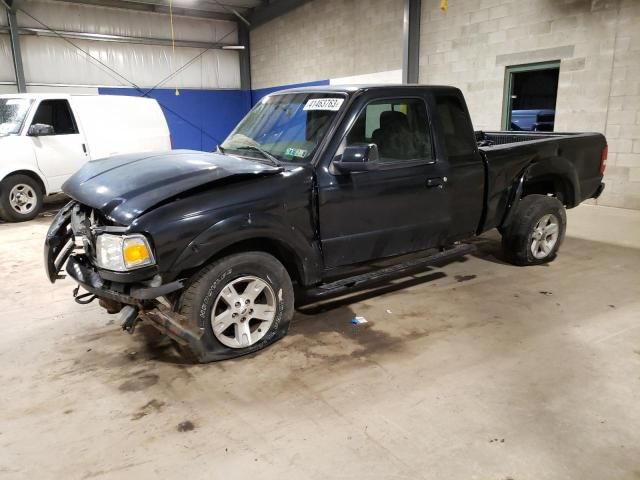
Sale Record
2009 FORD RANGER SUPER CAB
sold
| Year | 2009 |
| Title | Hidden text (Hidden text) |
| ODO | 8595 mi (Hidden text) |
| Damage | Hidden text |
| Estimated Retail Value | $8220 |
| Estimated Repair Cost | $6292 (154%) |
| Location | Mebane, NC, 27302 |
| Date | ended 3 years ago |
| Sale Website Type | salvage or insurance auction |
sale information provided by user #59447


All photos above are REAL and display ACTUAL car. After you get the report you will see full resolution photos.
Tech Specs
| Color | WHITE |
| Transmission | AUTOMATIC |
| Engine | 4.0L 6 |
| Drive | 4x4 w/Rear Wheel Drv |
| Fuel Type | GAS |
Model Analytics & Market Report
We've analyzed more than 7,900 sales records of this model and here are some numbers.
The average price for new (MSRP) 2009 FORD RANGER in 2009 was $38,035.
The average price for used 2009 FORD RANGER nowadays in 2024 is $11,593 which is 30% from the original price.
Estimated mileage driven per year is 7,704 miles.
For this model we also have depreciation curve, photos, list of features and options, and other analytics.
Take a look at 2009 FORD RANGER model page in BADVIN vehicles catalog.
Depreciation
The graph below is a depreciation curve for 2009 FORD RANGER. It shows how much this model looses per year in price. This analytics is calculated using sales records from BADVIN database.
The table below shows average price for used 2009 FORD RANGER in each year since the year of manufacturing, current year price and projected price in the future years.
You can scroll the table horizontally to see all columns.
| Year | Average Mileage | Average Price | % Left | % Lost | ||
|---|---|---|---|---|---|---|
| 2009 MSRP | 0 mi | $38,035 | — | — | 100% | 0% |
| 2009 | 7,704 mi | $55,746 | −$17,711 | −46.57% | 146.57% | -46.57% |
| 2010 | 15,408 mi | $37,992 | +$17,754 | +31.85% | 99.89% | 0.11% |
| 2011 | 23,112 mi | $35,039 | +$2,953 | +7.77% | 92.12% | 7.88% |
| 2012 | 30,816 mi | $32,500 | +$2,539 | +7.25% | 85.45% | 14.55% |
| 2013 | 38,520 mi | $29,990 | +$2,510 | +7.72% | 78.85% | 21.15% |
| → Visit 2009 FORD RANGER depreciation page to see full data. | ||||||
Price vs Mileage
The graph below shows how mileage affects the price for 2009 FORD RANGER. This data was calculated using sales records from BADVIN database.
The table below shows average price for used 2009 FORD RANGER by mileage and number of sales.
You can scroll the table horizontally to see all columns.
| Mileage | Average Price | Sample Size |
|---|---|---|
| 10,000 mi | $17,900 | 12 sales |
| 15,000 mi | $15,900 | 19 sales |
| 20,000 mi | $17,499 | 25 sales |
| 25,000 mi | $15,999 | 47 sales |
| 30,000 mi | $15,996 | 96 sales |
| 35,000 mi | $16,997 | 89 sales |
| → Visit 2009 FORD RANGER depreciation page to see full data. | ||
Get FULL ACCESS to the vehicle history report and see all blurred info.
⭐ Read 206+ reviews from our customers who used BADVIN to avoid buying junk vehicles.
Testimonials from our customers
Report showed a car I was considering had a prior salvage title from a major accident, even though carfax listed it as clean. Messaged seller asking about it and they made shady excuses. Def avoided a scam thanks to badvin!

Mia Johnson
verified on Trustpilot
After a bad experience buying a used car that turned out to have major issues, I now use Bad VIN to thoroughly check every vehicle i consider. It costs a bit more than other services but the detailed records and photos of past sales are wotrh it for the added peace of mind.
Olivia Johnson
verified on Trustpilot
As a car dealer importing vehicles from the US to Mexico, I rely on badvin for comprehensive history reports before bidding at auctions. Their info has helped me avoid several salvage vehicles and is more thorough than carfax. A must-have service!
Javier Ramirez
verified on Trustpilot
BadVin's vehicle history report is a must-have before buying any used vehicle. It's saved me from a few lemons over the years - cars that looked great on the surface but had hidden issues like accidents or title problems. Well worth the price.
Camila Santos
verified on Trustpilot
Compare to other 2009 FORD RANGER

2006 FORD RANGER
a month ago, 90,557 mi
est retail value $12,000
buy now price $750
VIN 1FTZR45E56PA46996
Other vehicles sales records
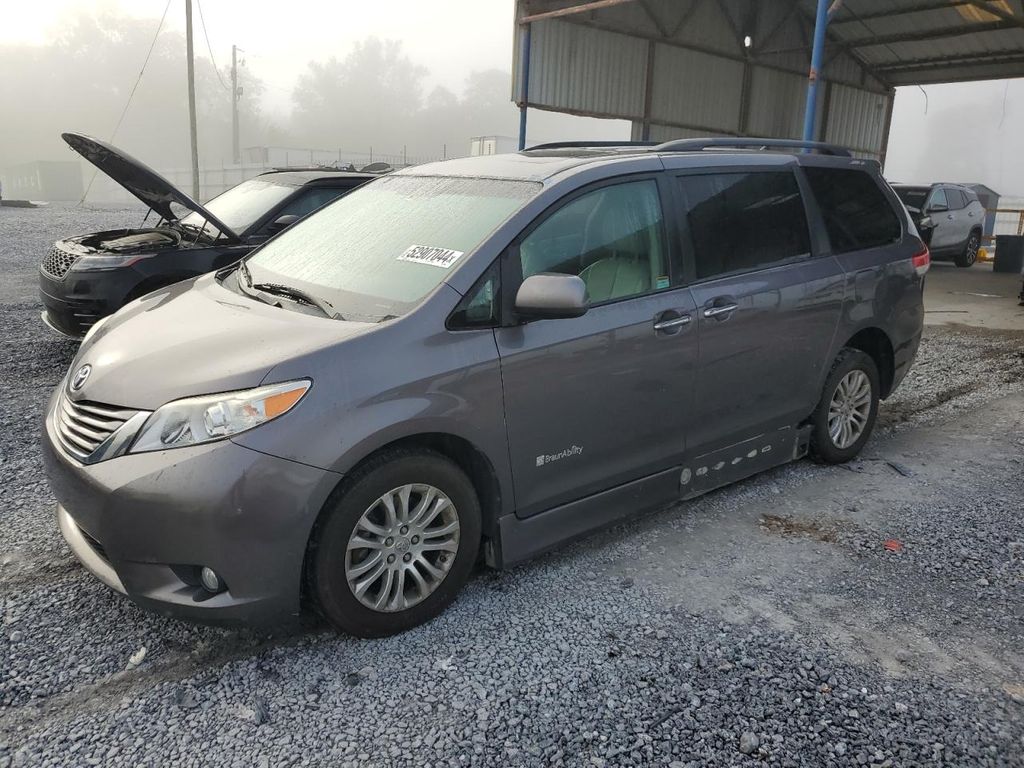


2012 VOLKSWAGEN PASSAT
in 5 days, 240,668 mi
est retail value $3,023
buy now price $450
VIN 1VWBP7A38CC031857

2013 FORD ESCAPE
in 5 days, 179,202 mi
est retail value $7,400
buy now price $1,950
VIN 1FMCU9GXXDUB68201


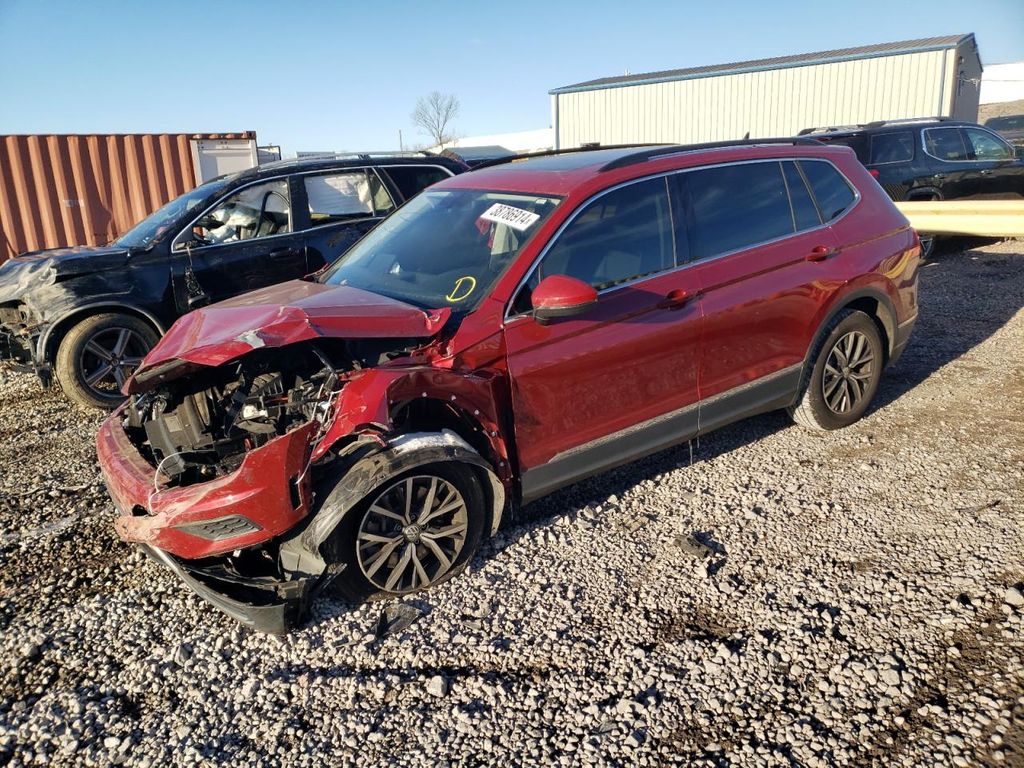
2018 VOLKSWAGEN TIGUAN
in 4 days, 49,376 mi
est retail value $19,345
buy now price $3,800
VIN 3VV3B7AX7JM215158


2023 TESLA MODEL Y
24 days ago, 22,666 mi
est retail value $65,630
buy now price $27,200
VIN 7SAYGDEE3PA046914
Frequently asked questions
Sales prices from past transactions may be documented in our reports, providing a price history that aids in determining current market value, if such data is available.
Yes, dealer-installed options can be listed on the Monroney label, including their costs, helping buyers understand what extra features have been added beyond the standard or factory options.
Proper maintenance and good condition can slow the depreciation of a 2009 FORD RANGER by making it more attractive to potential buyers, thereby preserving more of its value.
A 2009 FORD RANGER window sticker includes information such as MSRP, fuel efficiency, safety ratings, and optional equipment.
If the 2009 FORD was used as a taxi, this information may be noted in the vehicle history report, including the duration and any relevant details affecting its wear and tear, if reported.
The market value of a vehicle is calculated based on its historical depreciation trends, current condition, mileage, and market trends.
Aftermarket modifications can affect the depreciation of 2009 FORD RANGER either positively, by enhancing appeal to certain buyers, or negatively, by deterring those who prefer stock condition.


