
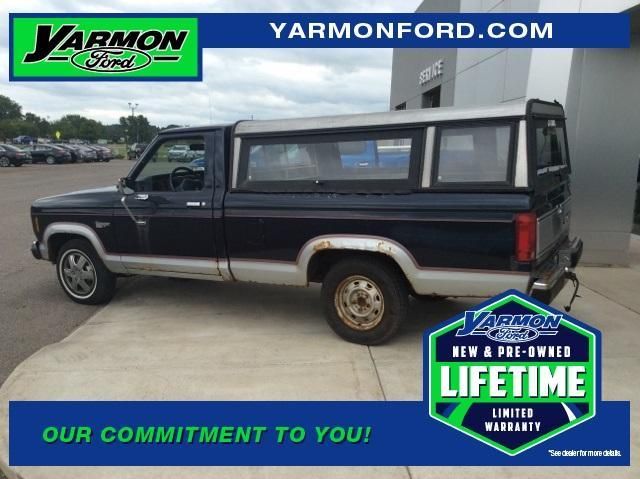
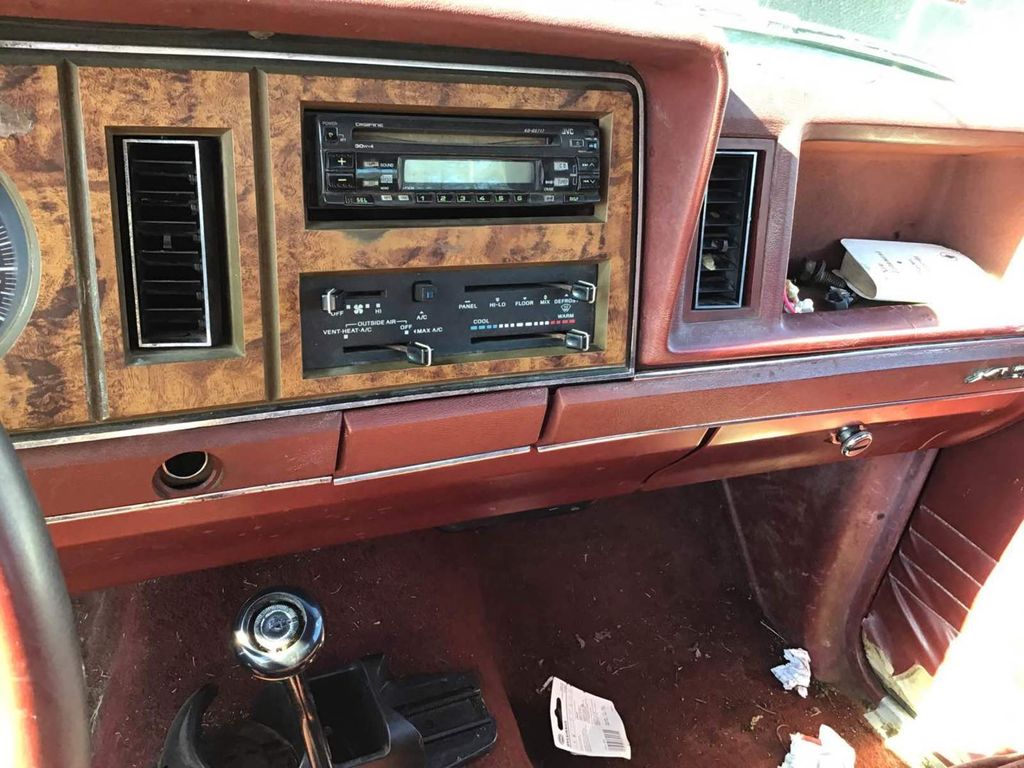
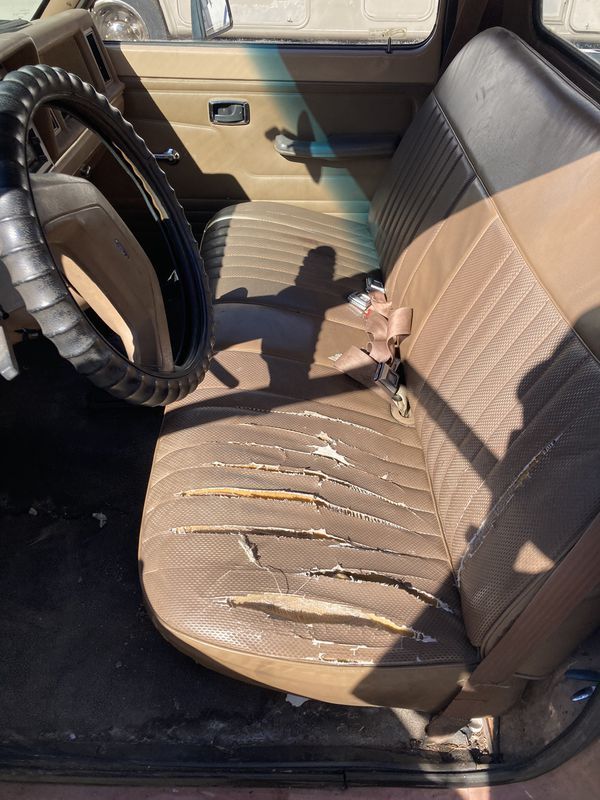
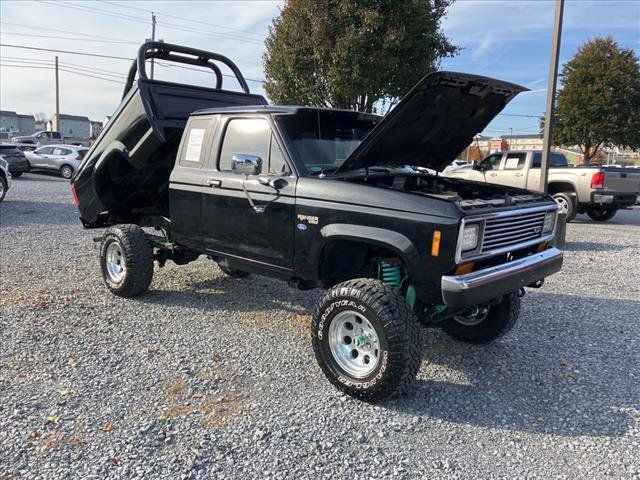
Photos
Pictures below are not fancy pictures from manufacturer catalog. It's all photos of real vehicles that were on sale on United States market. You can click on any picture to see specific vehicle and its VIN report.


The graph below is a depreciation curve for 1987 FORD RANGER. It shows how much this model looses per year in price. This analytics is calculated using sales records from BADVIN database.
The table below shows average price for used 1987 FORD RANGER in each year since the year of manufacturing, current year price and projected price in the future years.
You can scroll the table horizontally to see all columns.
| Year | Average Mileage | Average Price | % Left | % Lost | ||
|---|---|---|---|---|---|---|
| 1987 MSRP | 0 mi | $38,035 | — | — | 100% | 0% |
| 1987 | 7,704 mi | $55,746 | −$17,711 | −46.57% | 146.57% | -46.57% |
| 1988 | 15,408 mi | $37,992 | +$17,754 | +31.85% | 99.89% | 0.11% |
| 1989 | 23,112 mi | $35,039 | +$2,953 | +7.77% | 92.12% | 7.88% |
| 1990 | 30,816 mi | $32,500 | +$2,539 | +7.25% | 85.45% | 14.55% |
| 1991 | 38,520 mi | $29,990 | +$2,510 | +7.72% | 78.85% | 21.15% |
| → Visit 1987 FORD RANGER depreciation page to see full data. | ||||||
The graph below shows how mileage affects the price for 1987 FORD RANGER. This data was calculated using sales records from BADVIN database.
The table below shows average price for used 1987 FORD RANGER by mileage and number of sales.
You can scroll the table horizontally to see all columns.
| Mileage | Average Price | Sample Size |
|---|---|---|
| → Visit 1987 FORD RANGER depreciation page to see full data. | ||
Recent sales
BADVIN contain information about more than 110 sold 1987 FORD RANGER on US market. Below you may find some of recent sales with exact mileage and prices.
What's the difference between auctions and classifieds?Dealer and insurance auctions

11,655 mi
sold for $500
UT
2 years ago

98,644 mi
sold for $1,350
KY
4 years ago

65,260 mi
sold for $200
WA
5 years ago

31,956 mi
sold for $2,900
OH
5 years ago

71,770 mi
sold for $250
IN
5 years ago

70,078 mi
sold for $550
WA
5 years ago

30,170 mi
sold for $350
TN
5 years ago
Classifieds

88,906 mi
listed for $3,995
ID
3 months ago
143,547 mi
listed for $10,995
WV
5 months ago

27,945 mi
listed for $12,682
AL
8 months ago
27,945 mi
listed for $12,982
AL
9 months ago

86,695 mi
listed for $4,999
MN
9 months ago

79,099 mi
listed for $19,995
TN
2 years ago

15,750 mi
listed for $22,900
PA
2 years ago
79,099 mi
listed for $24,995
TN
2 years ago

155,288 mi
listed for $2,894
MN
2 years ago
155,288 mi
listed for $2,894
MN
2 years ago

64,425 mi
listed for $5,999
MO
2 years ago

12,364 mi
listed for $3,999
TN
2 years ago
Features and options
We've collected all possible options and features that you may find in sales listings for 1987 FORD RANGER and organized it in two lists.
- LEATHER
- 2 PASSENGER
- 3 PASSENGER
- 4WD
- 5 PASSENGER
- ABS
- AIR BAG
- AIR CONDITIONING
- AM RADIO
- AM/FM/CD
- AM\FM\CASSETTE
- CLOTH SEATS
- CRUISE CONTROL
- DRIVE TRAIN - 2 WHEEL
- HARD TOP
- POWER STEERING
- SEAT TYPE - 60-40
- SEAT TYPE - LUMBAR BENCH
- VINYL SEATS
- WARRANTY BOOK
Other years of FORD RANGER

1993 FORD RANGER
$5,991 average used price
940+ sales records

1999 FORD RANGER
$6,994 average used price
5,800+ sales records

2001 FORD RANGER
$7,895 average used price
7,400+ sales records
2008 FORD RANGER
$10,935 average used price
9,200+ sales records

2009 FORD RANGER
$11,593 average used price
7,900+ sales records

2022 FORD RANGER
$35,039 average used price
17,700+ sales records
Similar Models

1989 FORD CROWN VICTORIA
$28,860 MSRP
60+ sales records

1989 FORD F-250
$60,650 MSRP
$10,900 average used price
560+ sales records

1989 FORD MUSTANG
$39,240 MSRP
$19,950 average used price
3,200+ sales records

1990 FORD THUNDERBIRD
$19,790 MSRP
$12,475 average used price
230+ sales records

1990 FORD TAURUS
$33,285 MSRP
100+ sales records

1990 FORD MUSTANG
$39,240 MSRP
$19,245 average used price
2,400+ sales records
Frequently asked questions
Some models may depreciate faster due to factors like lower demand, higher maintenance costs, or outdated technology compared to newer versions.
Our reports may indicate the type of use for each vehicle, including whether the vehicle was primarily used as a personal, rental, or commercial vehicle, based on available data.
Accident reports might detail the occurrence, damage severity, and repairs, offering insights into the operational history of the vehicle, if such data is documented.
A VIN alone does not typically provide fuel economy details directly; however, it can identify the vehicle model and engine type, which you can cross-reference with fuel economy data from other sources.
Significant damage from flood, fire, or hail may severely affect a vehicle vehicle's structure and mechanics, potentially resulting in a salvage title, depending on the extent of damage reported.
Aftermarket modifications can affect the depreciation of vehicle either positively, by enhancing appeal to certain buyers, or negatively, by deterring those who prefer stock condition.
Safety Recalls
With over 1.9 million Fords sold yearly in the U.S., up to 30% may have unresolved safety recalls. A VIN check identifies any open recalls.
Accident History
Decoding the VIN reveals if a used Ford has been in accidents, flooded, or sustained other damage that could affect its safety and value.
Maintenance Records
A VIN check provides detailed maintenance records, ensuring the used Ford you buy has been properly serviced and cared for.


