
BADVIN vehicle history report for
1999 FORD RANGERVIN: 1FTZR15V5XTA38470
Get FULL ACCESS to the vehicle history report and see all blurred info.
⭐ Read 206+ reviews from our customers who used BADVIN to avoid buying junk vehicles.
Historical Records
events
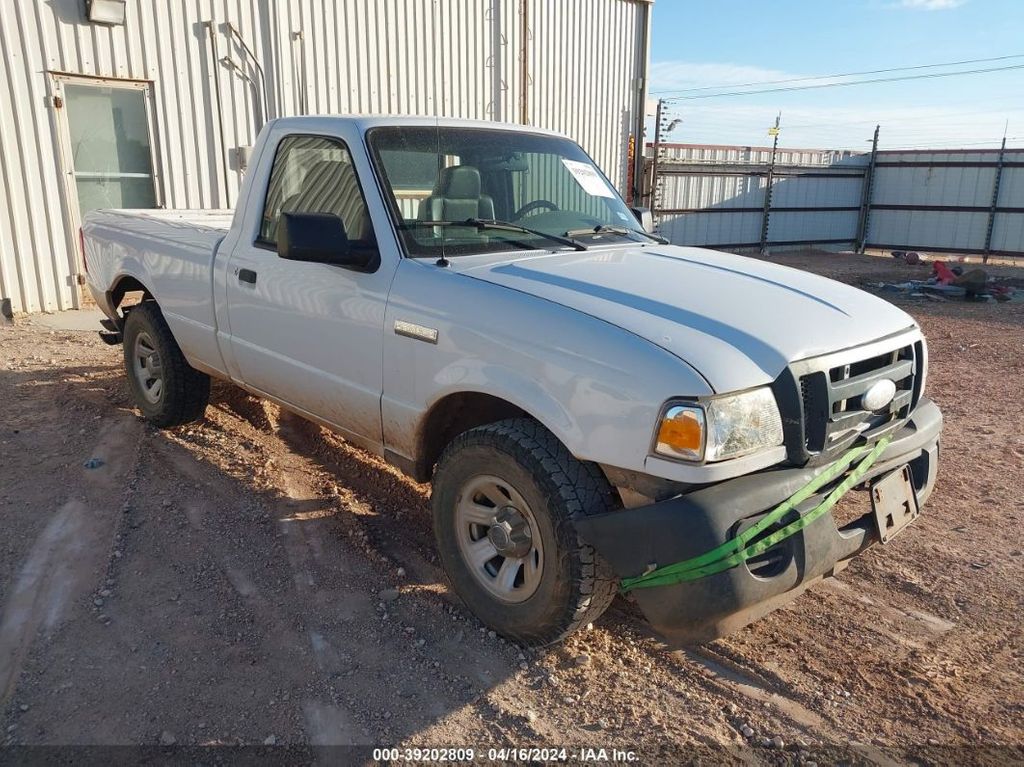
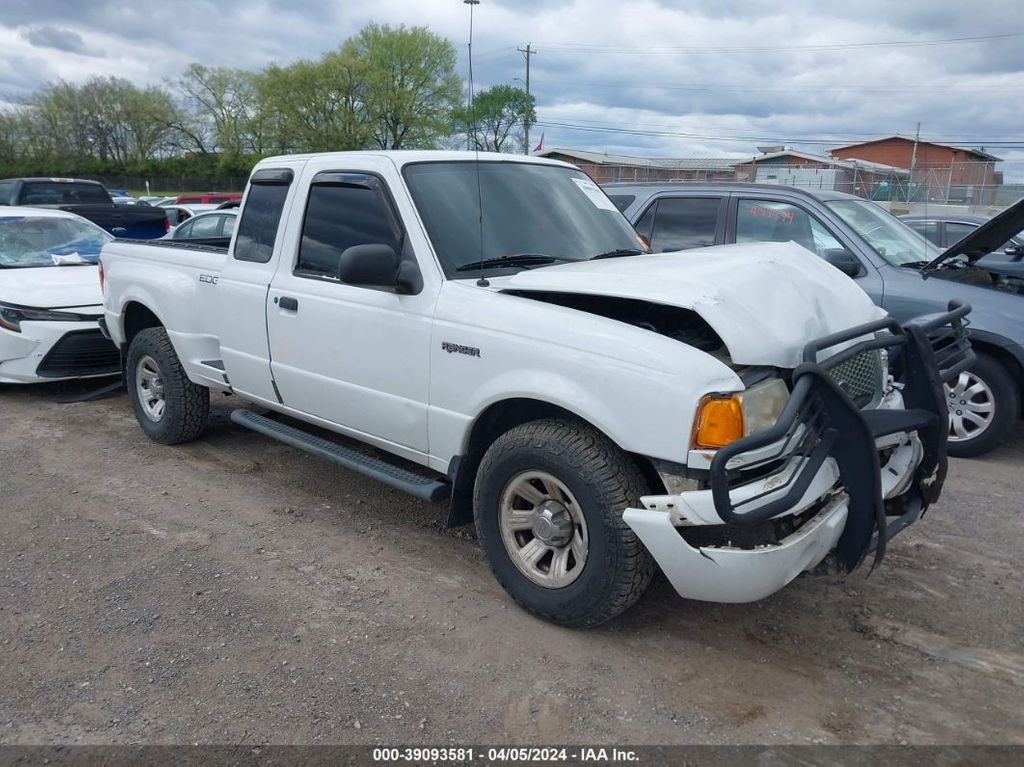
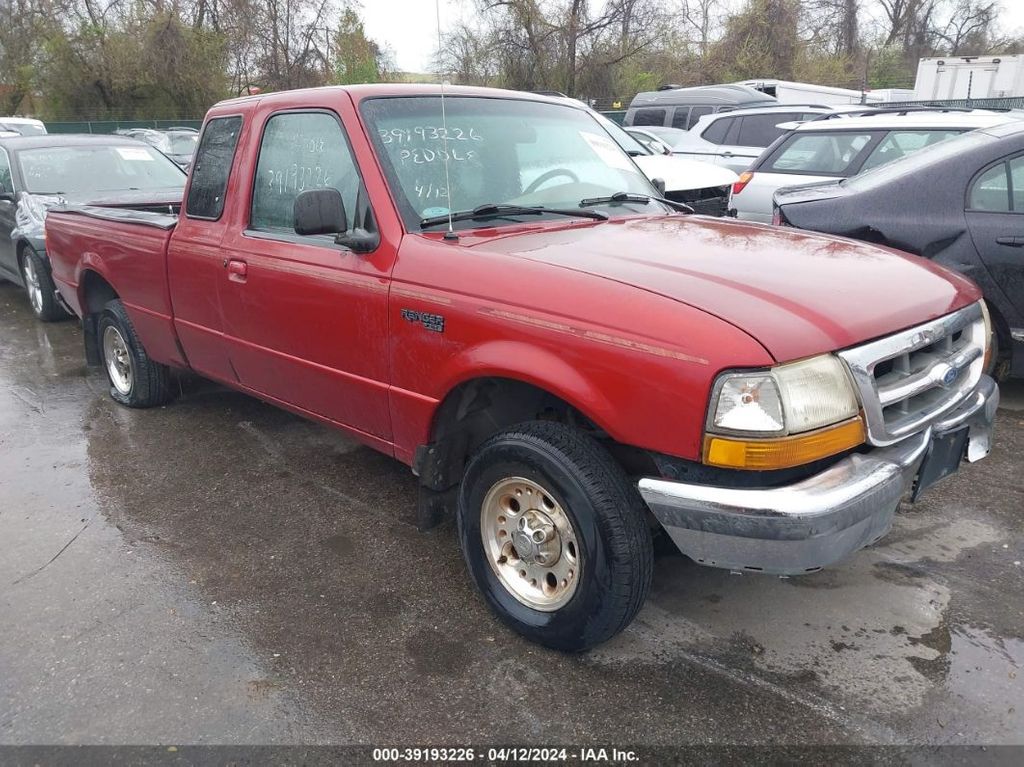
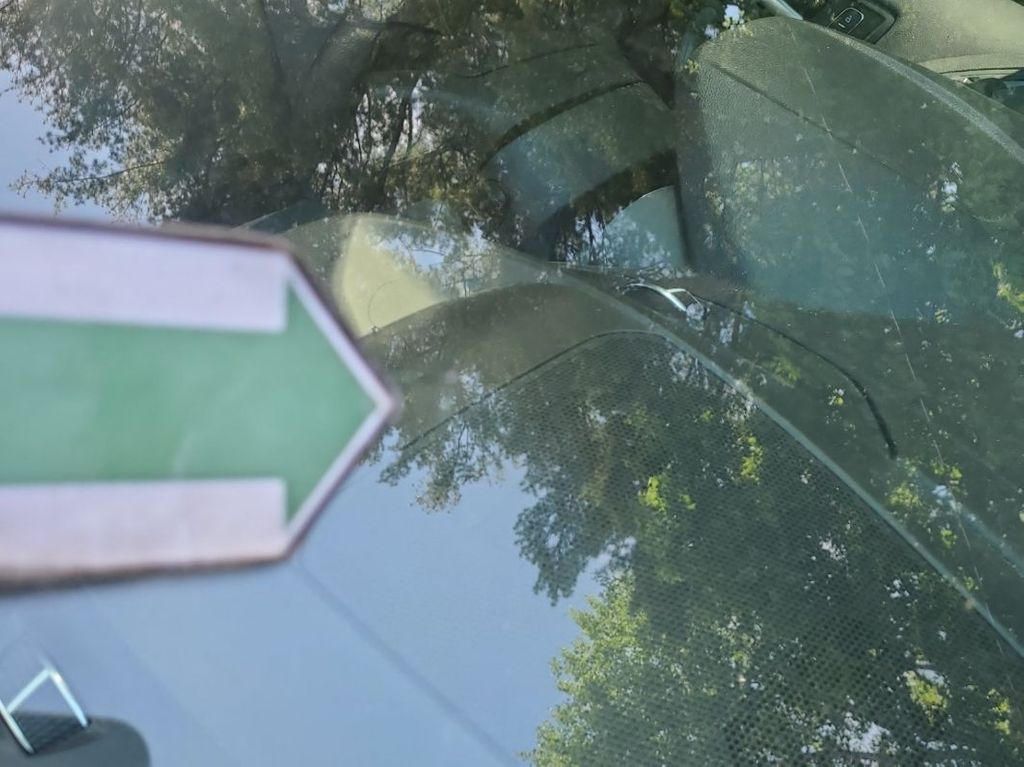
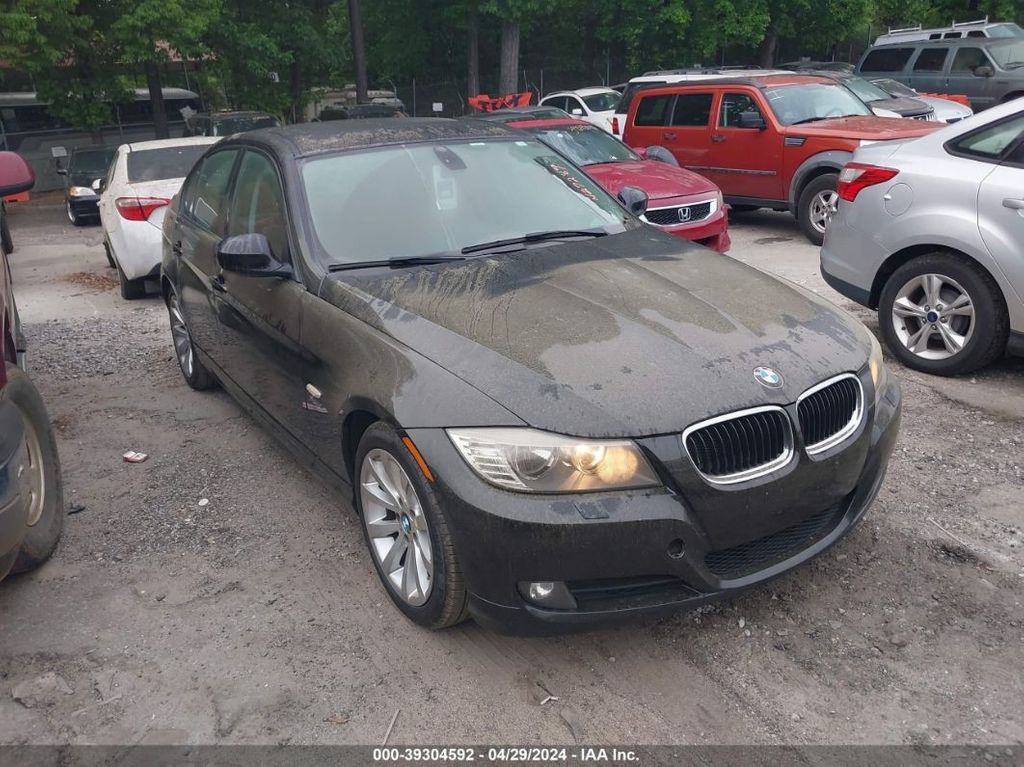
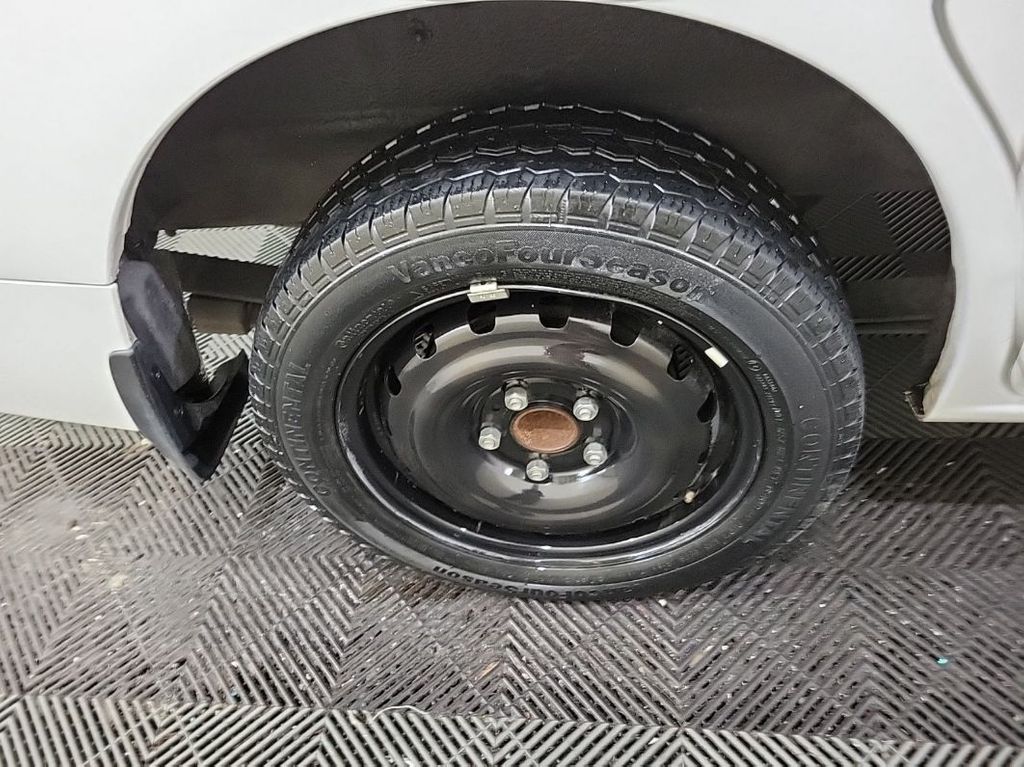
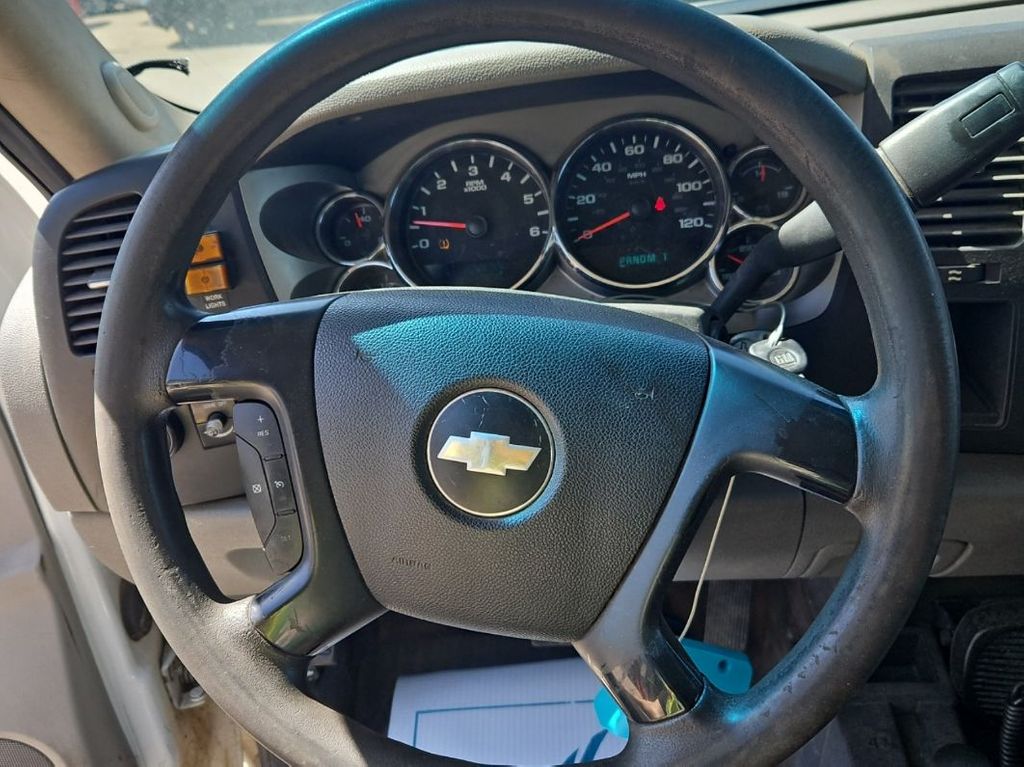
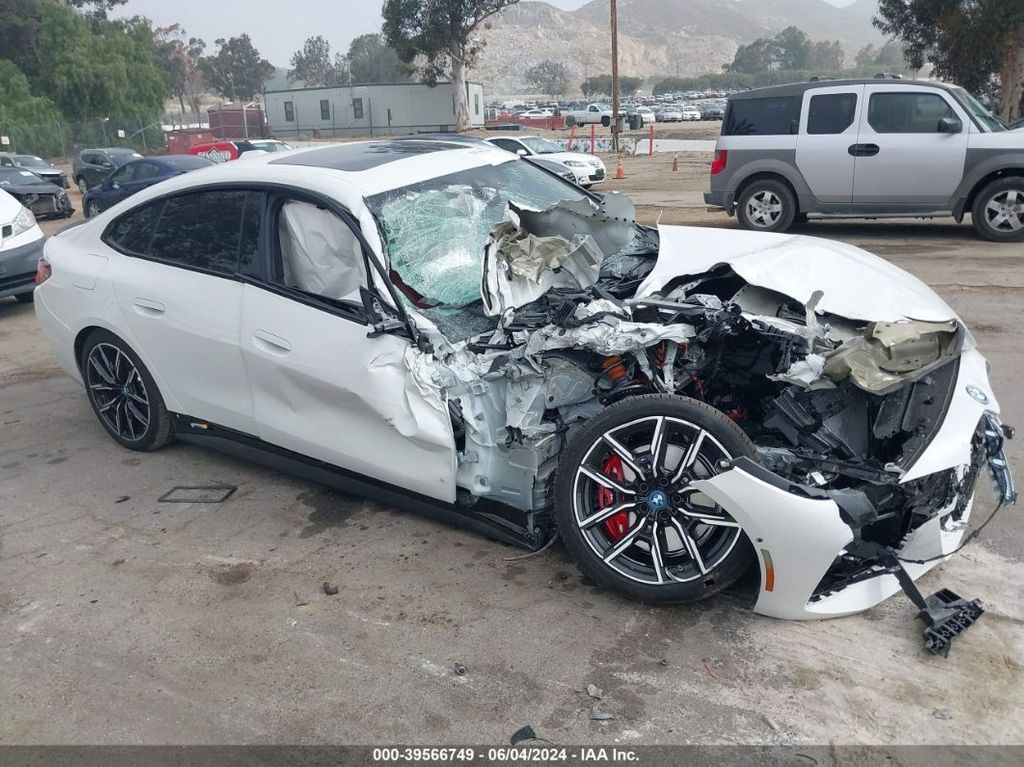
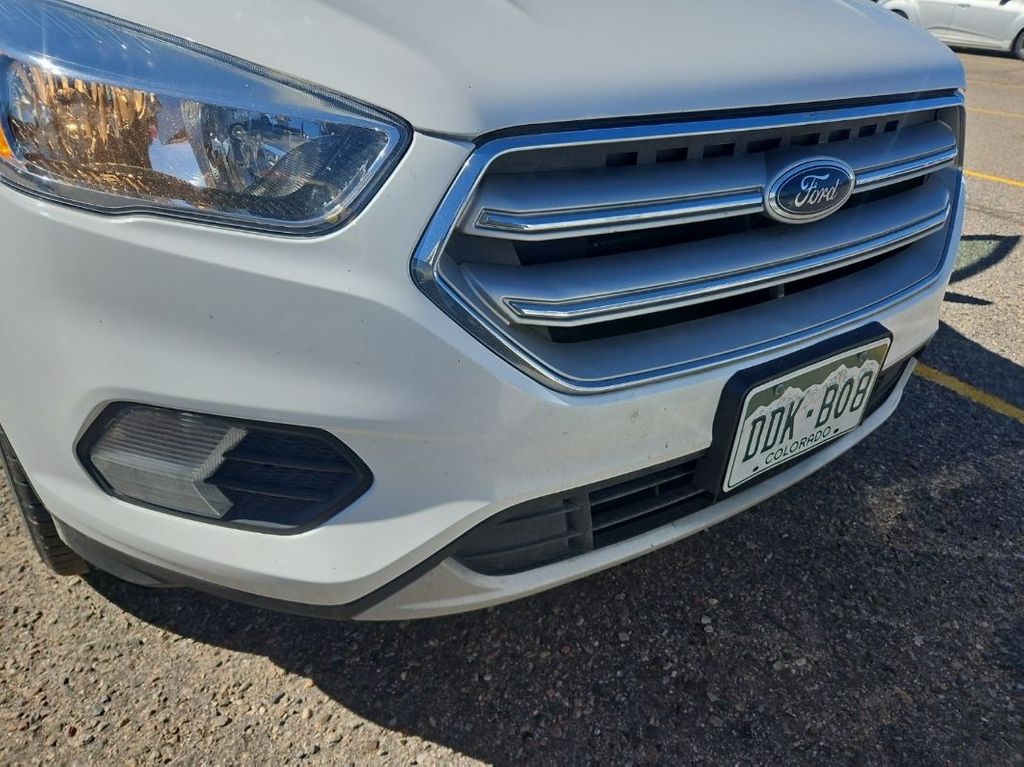
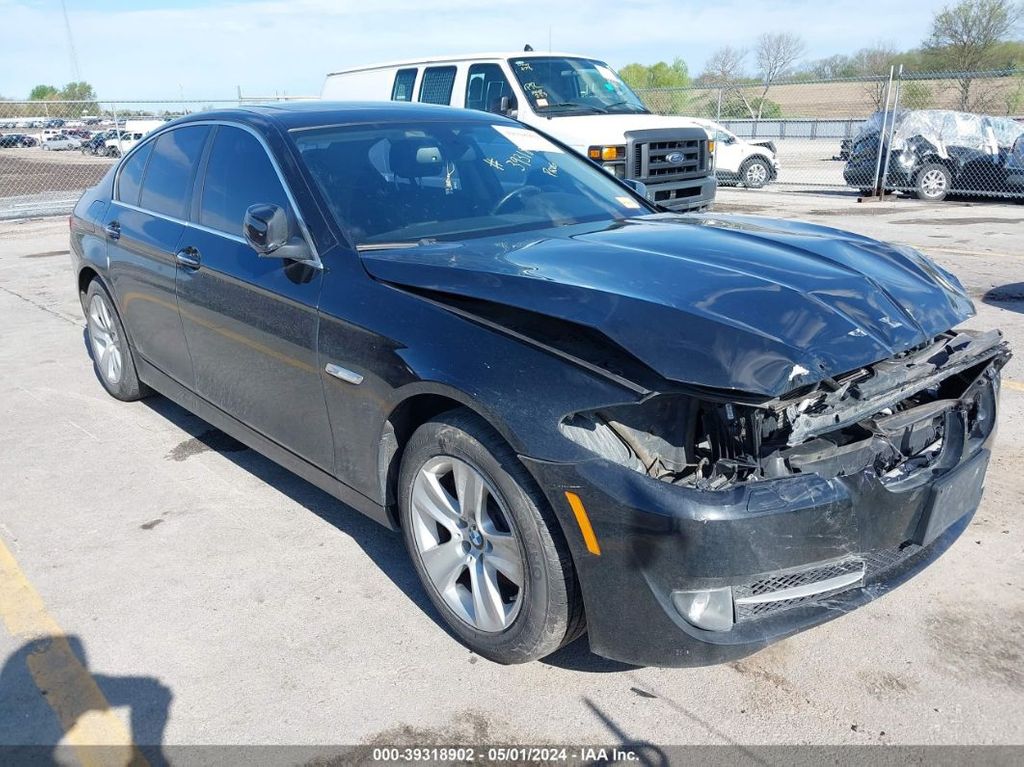
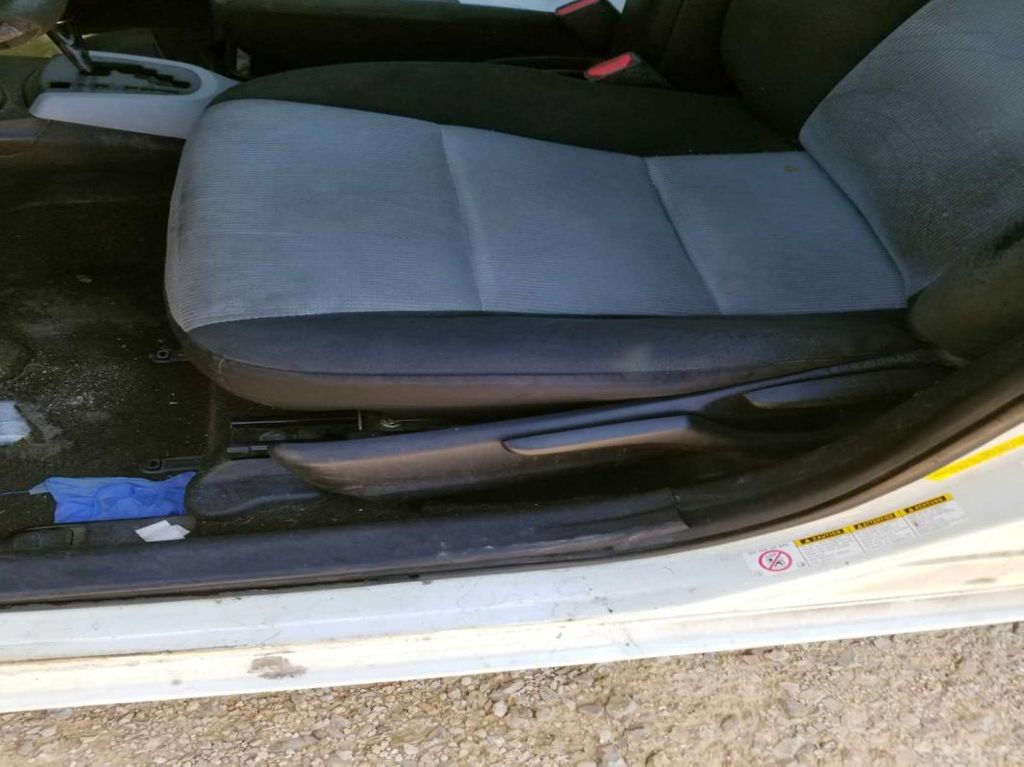
Photos
11 images
Sales History
1 records
Sale Prices
2 records
Market report
Price analytics
Historical Records
Historical records may include service and maintenance records, title status (clean, junk, salvage), insurance records, number of owners, registration events and states, and other information.
You can find more information about historical records in BADVIN reports and see more examples here.
Available historical records for VIN 1FTZR15V5XTA38470
Latest reported mileage: 116 mi
Below you can see some examples of what these records could look like.
2023-02-10
a year ago
113,633 mi
Passed emissions inspection
2022-06-25
2 years ago
9,876 mi
NOT ACTUAL MILEAGE TITLE ISSUED
Titled or registered as lease vehicle
Titled or registered as lease vehicle
2021-08-10
3 years ago
26,087 mi
TOTAL LOSS VEHICLE
Collision damage reported
Collision damage reported
Has Keys:Hidden text
| Year | 1999 |
| Title | Hidden text |
| ODO | 1548 mi (Hidden text) |
| Loss | Hidden text |
| Damage | Hidden text, Hidden text |
| Estimated Retail Value | $7222 |
| Buy Now Price | $942 |
| Location | Buffalo, NY, 14221 |
| Date | ended 2 years ago sold for $365 |
| Sale Website Type | salvage or insurance auction |
sale information provided by user #453080


All photos above are REAL and display ACTUAL car. After you get the report you will see full resolution photos.
Tech Specs
| Body Style | SUPER CAB PICKUP |
| Color | Green/ Tan |
| Engine | 3.0L 182 SEFI FLEXIBLE FUEL |
| Cylinders | 6 Cylinders |
| Drive | 4X4 Drive |
| Fuel Type | Flexible Fuel |
Model Analytics & Market Report
We've analyzed more than 5,800 sales records of this model and here are some numbers.
The average price for new (MSRP) 1999 FORD RANGER in 1999 was $38,035.
The average price for used 1999 FORD RANGER nowadays in 2024 is $6,994 which is 18% from the original price.
Estimated mileage driven per year is 7,704 miles.
For this model we also have depreciation curve, photos, list of features and options, and other analytics.
Take a look at 1999 FORD RANGER model page in BADVIN vehicles catalog.
Depreciation
The graph below is a depreciation curve for 1999 FORD RANGER. It shows how much this model looses per year in price. This analytics is calculated using sales records from BADVIN database.
The table below shows average price for used 1999 FORD RANGER in each year since the year of manufacturing, current year price and projected price in the future years.
You can scroll the table horizontally to see all columns.
| Year | Average Mileage | Average Price | % Left | % Lost | ||
|---|---|---|---|---|---|---|
| 1999 MSRP | 0 mi | $38,035 | — | — | 100% | 0% |
| 1999 | 7,704 mi | $55,746 | −$17,711 | −46.57% | 146.57% | -46.57% |
| 2000 | 15,408 mi | $37,992 | +$17,754 | +31.85% | 99.89% | 0.11% |
| 2001 | 23,112 mi | $35,039 | +$2,953 | +7.77% | 92.12% | 7.88% |
| 2002 | 30,816 mi | $32,500 | +$2,539 | +7.25% | 85.45% | 14.55% |
| 2003 | 38,520 mi | $29,990 | +$2,510 | +7.72% | 78.85% | 21.15% |
| → Visit 1999 FORD RANGER depreciation page to see full data. | ||||||
Price vs Mileage
The graph below shows how mileage affects the price for 1999 FORD RANGER. This data was calculated using sales records from BADVIN database.
The table below shows average price for used 1999 FORD RANGER by mileage and number of sales.
You can scroll the table horizontally to see all columns.
| Mileage | Average Price | Sample Size |
|---|---|---|
| 35,000 mi | $9,993 | 12 sales |
| 40,000 mi | $9,998 | 17 sales |
| 45,000 mi | $9,988 | 21 sales |
| 50,000 mi | $10,795 | 17 sales |
| 55,000 mi | $9,450 | 26 sales |
| 60,000 mi | $9,995 | 29 sales |
| → Visit 1999 FORD RANGER depreciation page to see full data. | ||
Get FULL ACCESS to the vehicle history report and see all blurred info.
⭐ Read 206+ reviews from our customers who used BADVIN to avoid buying junk vehicles.
Testimonials from our customers
Bad Vin's vehicle history report showed that the 2018 Audi A4 I was about to buy had been in a major accident that was not disclosed by the seller. The severity analysis helped me avoid a bad purchase. Great service!

Sophie Dubois
verified on Trustpilot
Ich hätte fast einen 2017 Mercedes-Benz C300 gekauft, bis der Bad Vin-Bericht zeigte, dass er als durch Überschwemmung beschädigt gemeldet wurde. Die detaillierten Schadensaufzeichnungen haben mich vor einem großen Fehler bewahrt!
Sophia Müller
verified on Trustpilot
I import used luxury cars from US auctions to resell in Russia. The vehicle history reports from badVIN are essential for avoiding problem cars. For a BMW I was bidding on, it uncovered a salvage title from flood damage that other reports missed! That alone pays for the service.
Dmitry Volkov
verified on Trustpilot
After a bad experience buying a used car that turned out to have major issues, I now use Bad VIN to thoroughly check every vehicle i consider. It costs a bit more than other services but the detailed records and photos of past sales are wotrh it for the added peace of mind.
Olivia Johnson
verified on Trustpilot
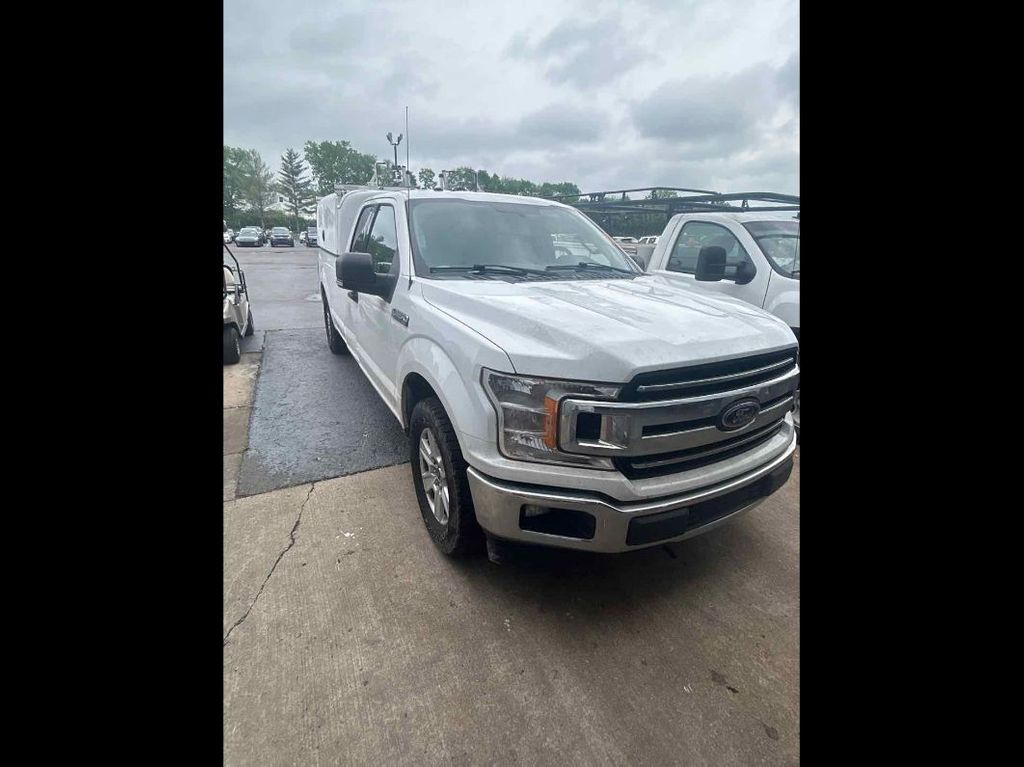
Compare to other 1999 FORD RANGER


2007 FORD RANGER
in 3 days, 159,605 mi
est retail value $9,509
sold for $1,325
buy now price $1,600
VIN 1FTYR15E37PA62450
Other vehicles sales records


2013 BMW 528I
11 days ago, 90,413 mi
est retail value $10,605
buy now price $2,400
VIN WBAXH5C53DD115554

Frequently asked questions
The report may include a history of odometer readings recorded during sales, services, or inspections, helping you verify the 1999 FORD RANGER's actual mileage, if records are accessible.
You can use a Monroney label to compare different 1999 FORD models by reviewing their features, fuel economy, safety equipment, and pricing directly on the sticker.
Service records may document maintenance and repairs, providing insight into the 1999 FORD vehicle’s upkeep and potential future issues, if available.
Yes, the window sticker includes environmental ratings such as greenhouse gas scores and smog ratings, which reflect the vehicle's environmental impact.
Some models may depreciate faster due to factors like lower demand, higher maintenance costs, or outdated technology compared to newer versions.
Yes, the choice of vehicle color can impact the depreciation rate, with neutral colors typically being easier to sell and potentially holding their value better than more unconventional colors.


