
BADVIN vehicle history report for
2002 FORD RANGERVIN: 1FTYR10U92TA44193
Get FULL ACCESS to the vehicle history report and see all blurred info.
⭐ Read 206+ reviews from our customers who used BADVIN to avoid buying junk vehicles.
Historical Records
events
Photos
10 images
Sales History
1 records
Sale Prices
1 records
Market report
Price analytics
Historical Records
Historical records may include service and maintenance records, title status (clean, junk, salvage), insurance records, number of owners, registration events and states, and other information.
You can find more information about historical records in BADVIN reports and see more examples here.
Available historical records for VIN 1FTYR10U92TA44193
Latest reported mileage: 572 mi
Below you can see some examples of what these records could look like.
2023-11-15
7 months ago
128,307 mi
Fire damage reported: minor damage
Vandalism damage reported
Damage to front
Vandalism damage reported
Damage to front
2021-09-19
3 years ago
24,479 mi
Damage reported: very minor damage
Damage to rear
Damage to rear
2021-09-01
3 years ago
44,711 mi
Passed emissions inspection
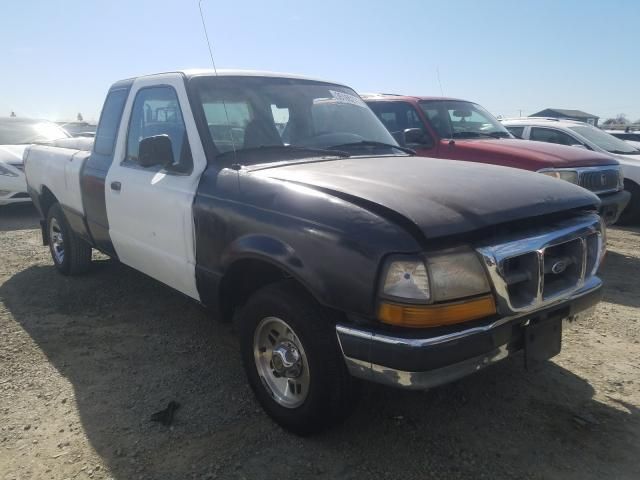
2002 FORD RANGER
sold
| Year | 2002 |
| Title | Hidden text (Hidden text) |
| ODO | 4990 mi (Hidden text) |
| Damage | Hidden text |
| Location | Rochester, NY, 14626 |
| Date | ended 2 years ago |
| Sale Website Type | salvage or insurance auction |
sale information provided by user #227932


All photos above are REAL and display ACTUAL car. After you get the report you will see full resolution photos.
Tech Specs
| Color | BLUE |
| Transmission | AUTOMATIC |
| Engine | 3.0L 6 |
| Drive | Rear-wheel drive |
| Fuel Type | GAS |
Model Analytics & Market Report
We've analyzed more than 8,900 sales records of this model and here are some numbers.
The average price for new (MSRP) 2002 FORD RANGER in 2002 was $38,035.
The average price for used 2002 FORD RANGER nowadays in 2024 is $7,499 which is 20% from the original price.
Estimated mileage driven per year is 7,704 miles.
For this model we also have depreciation curve, photos, list of features and options, and other analytics.
Take a look at 2002 FORD RANGER model page in BADVIN vehicles catalog.
Depreciation
The graph below is a depreciation curve for 2002 FORD RANGER. It shows how much this model looses per year in price. This analytics is calculated using sales records from BADVIN database.
The table below shows average price for used 2002 FORD RANGER in each year since the year of manufacturing, current year price and projected price in the future years.
You can scroll the table horizontally to see all columns.
| Year | Average Mileage | Average Price | % Left | % Lost | ||
|---|---|---|---|---|---|---|
| 2002 MSRP | 0 mi | $38,035 | — | — | 100% | 0% |
| 2002 | 7,704 mi | $55,746 | −$17,711 | −46.57% | 146.57% | -46.57% |
| 2003 | 15,408 mi | $37,992 | +$17,754 | +31.85% | 99.89% | 0.11% |
| 2004 | 23,112 mi | $35,039 | +$2,953 | +7.77% | 92.12% | 7.88% |
| 2005 | 30,816 mi | $32,500 | +$2,539 | +7.25% | 85.45% | 14.55% |
| 2006 | 38,520 mi | $29,990 | +$2,510 | +7.72% | 78.85% | 21.15% |
| → Visit 2002 FORD RANGER depreciation page to see full data. | ||||||
Price vs Mileage
The graph below shows how mileage affects the price for 2002 FORD RANGER. This data was calculated using sales records from BADVIN database.
The table below shows average price for used 2002 FORD RANGER by mileage and number of sales.
You can scroll the table horizontally to see all columns.
| Mileage | Average Price | Sample Size |
|---|---|---|
| 25,000 mi | $13,995 | 23 sales |
| 30,000 mi | $12,948 | 24 sales |
| 35,000 mi | $13,999 | 19 sales |
| 40,000 mi | $12,688 | 27 sales |
| 45,000 mi | $10,999 | 26 sales |
| 50,000 mi | $10,480 | 48 sales |
| → Visit 2002 FORD RANGER depreciation page to see full data. | ||
Get FULL ACCESS to the vehicle history report and see all blurred info.
⭐ Read 206+ reviews from our customers who used BADVIN to avoid buying junk vehicles.
Testimonials from our customers
Bad Vin's vehicle history report showed that the 2018 Audi A4 I was about to buy had been in a major accident that was not disclosed by the seller. The severity analysis helped me avoid a bad purchase. Great service!

Sophie Dubois
verified on Trustpilot
As a used car dealer, I rely on badvin.org for checking every vehicle I'm considering purchasing at auction. The comprehensive reports give me peace of mind and help me avoid problem cars. Photos of past sales have saved me from overpaying many times. Worth every penny!
Misha
verified on Trustpilot
Can't believe what badvin found on a used 2012 chevy silverado I almost bought - odometer had been rolled back 50k miles according to the mileage history! Carfax didnt show nething bout that. So glad I checked here first b4 handing over my hard earned $$
Jackson
verified on Trustpilot
Purchased a badvin report before buying a used Lexus RX 350. It revealed a minor accident the seller hadn't mentioned. I still bought the car but used the info to negotiate a lower price. Well worth the cost for the leverage it gave me!
Aiden Patel
verified on Trustpilot
Compare to other 2002 FORD RANGER


Other vehicles sales records


2017 CHEVROLET CAMARO
in 5 hours, 77,654 mi
est retail value $17,734
buy now price $6,400
VIN 1G1FB1RX2H0149797

Frequently asked questions
Odometer readings in our reports are verified for accuracy, helping protect against fraud and ensuring you get reliable information on the 2002 FORD RANGER, if these records are present.
Rebuild records, if available, show the extent of reconstruction after significant damage, important for assessing the current condition of the 2002 FORD RANGER.
If the 2002 FORD was used as a taxi, this information may be noted in the vehicle history report, including the duration and any relevant details affecting its wear and tear, if reported.
The last six digits of a VIN are the vehicle's unique serial number, which identifies the specific unit among others from the same model and production line.
The frequency of oil changes, a crucial aspect of vehicle maintenance, might be documented in the service history section of our reports, if records are available.
Yes, the Monroney label includes information about the vehicle’s manufacturing origin, specifying where the vehicle was assembled and the origin of its parts.
If available, auction photos may be included in our reports, providing a glimpse into the 2002 FORD vehicle’s condition and appearance at the time of sale.
Proper maintenance and good condition can slow the depreciation of a 2002 FORD RANGER by making it more attractive to potential buyers, thereby preserving more of its value.


