
BADVIN vehicle history report for
2000 FORD RANGERVIN: 1FTYR10C7YTA40322
Get FULL ACCESS to the vehicle history report and see all blurred info.
⭐ Read 205+ reviews from our customers who used BADVIN to avoid buying junk vehicles.
Historical Records
events
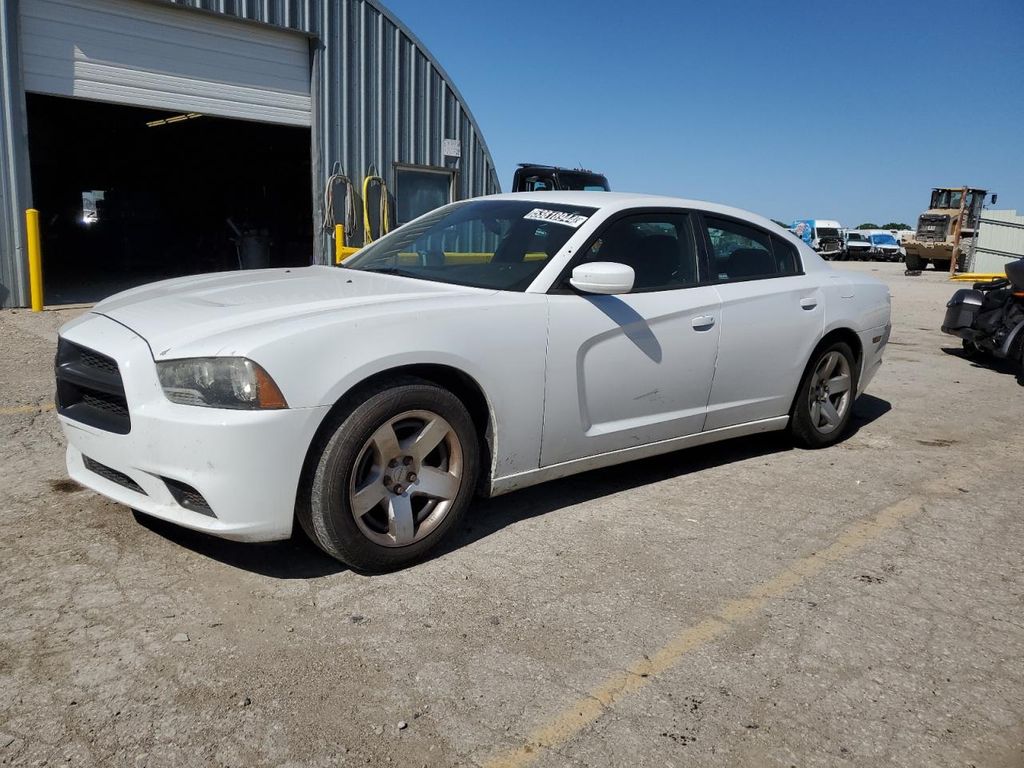
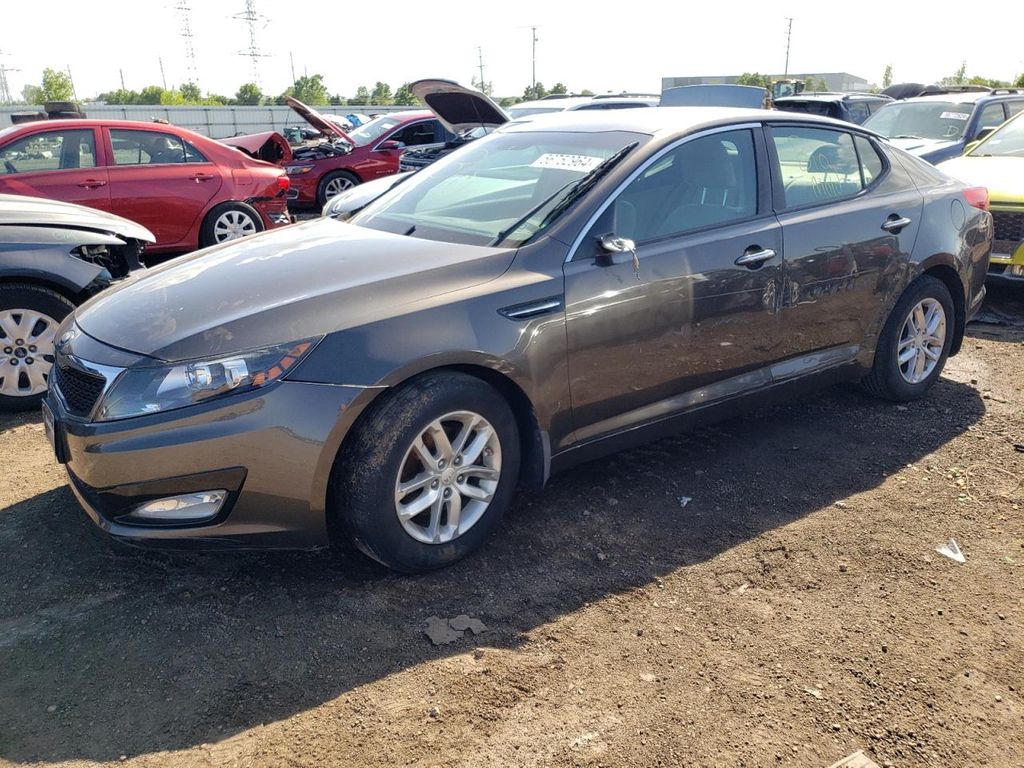
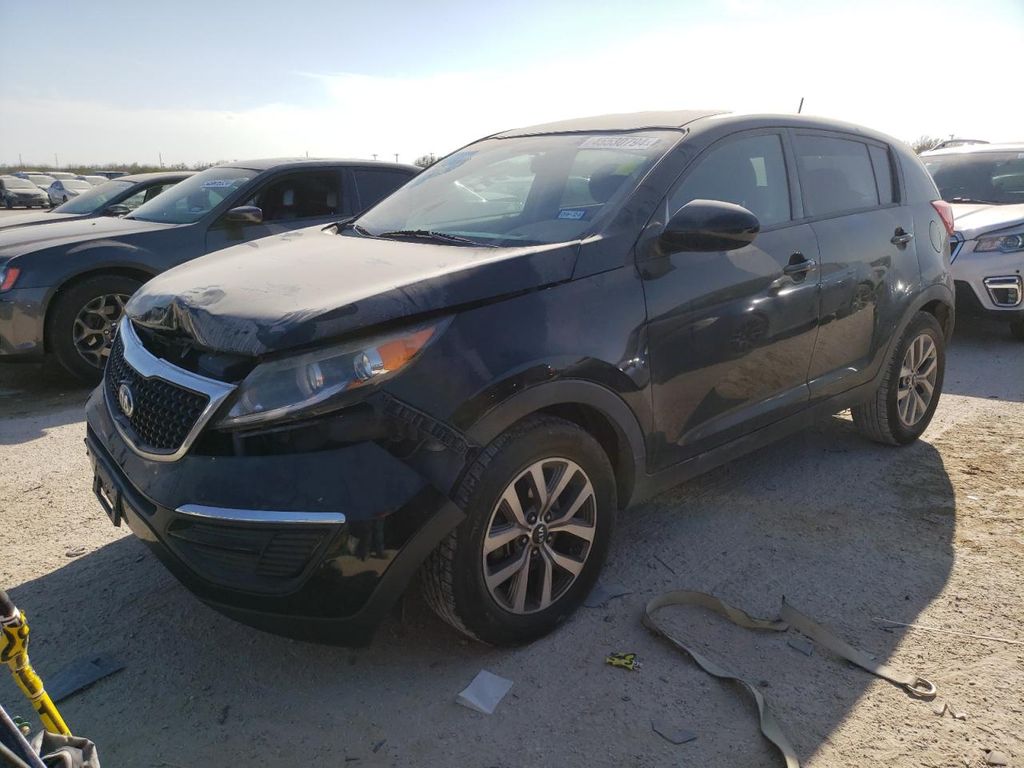
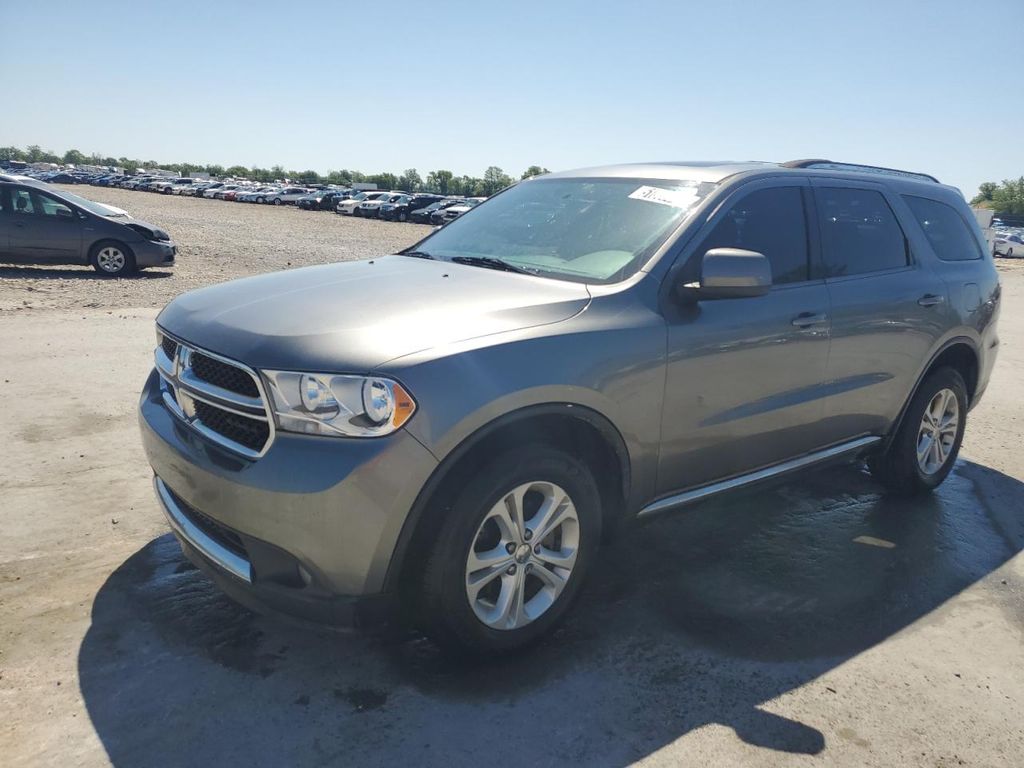
Photos
9 images
Sales History
1 records
Sale Prices
1 records
Market report
Price analytics
Historical Records
Historical records may include service and maintenance records, title status (clean, junk, salvage), insurance records, number of owners, registration events and states, and other information.
You can find more information about historical records in BADVIN reports and see more examples here.
Available historical records for VIN 1FTYR10C7YTA40322
Latest reported mileage: 234 mi
Below you can see some examples of what these records could look like.
2023-09-21
9 months ago
48,638 mi
Duplicate title issued
REBUILT TITLE ISSUED
REBUILT TITLE ISSUED
2021-11-14
3 years ago
13,433 mi
Passed emissions inspection
2019-05-05
5 years ago
47,921 mi
TOTAL LOSS VEHICLE
Vehicle declared a total loss by an insurance company
Collision damage reported
Vehicle declared a total loss by an insurance company
Collision damage reported
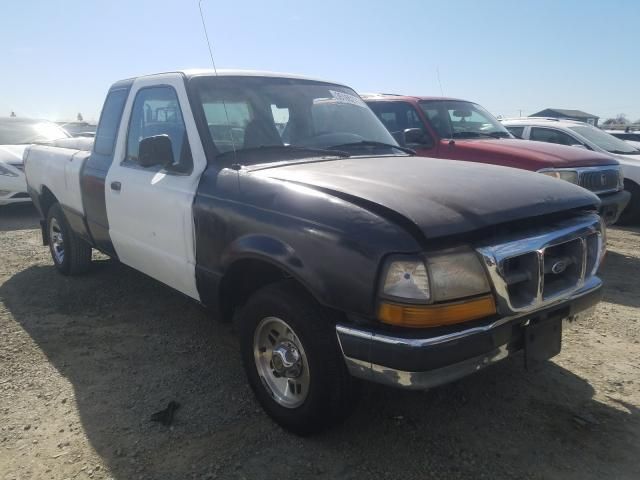
2000 FORD RANGER
sold
| Year | 2000 |
| Title | Hidden text (Hidden text) |
| ODO | 9143 mi (Hidden text) |
| Damage | Hidden text, Hidden text |
| Location | CLEVELAND EAST, OH, 44101 |
| Date | ended 3 years ago |
| Sale Website Type | salvage or insurance auction |
sale information provided by user #502769


All photos above are REAL and display ACTUAL car. After you get the report you will see full resolution photos.
Tech Specs
| Color | RED |
| Transmission | MANUAL |
| Engine | 2.5L 4 |
| Drive | Rear-wheel drive |
| Fuel Type | GAS |
Model Analytics & Market Report
We've analyzed more than 7,000 sales records of this model and here are some numbers.
The average price for new (MSRP) 2000 FORD RANGER in 2000 was $38,035.
The average price for used 2000 FORD RANGER nowadays in 2024 is $6,500 which is 17% from the original price.
Estimated mileage driven per year is 7,704 miles.
For this model we also have depreciation curve, photos, list of features and options, and other analytics.
Take a look at 2000 FORD RANGER model page in BADVIN vehicles catalog.
Depreciation
The graph below is a depreciation curve for 2000 FORD RANGER. It shows how much this model looses per year in price. This analytics is calculated using sales records from BADVIN database.
The table below shows average price for used 2000 FORD RANGER in each year since the year of manufacturing, current year price and projected price in the future years.
You can scroll the table horizontally to see all columns.
| Year | Average Mileage | Average Price | % Left | % Lost | ||
|---|---|---|---|---|---|---|
| 2000 MSRP | 0 mi | $38,035 | — | — | 100% | 0% |
| 2000 | 7,704 mi | $55,746 | −$17,711 | −46.57% | 146.57% | -46.57% |
| 2001 | 15,408 mi | $37,992 | +$17,754 | +31.85% | 99.89% | 0.11% |
| 2002 | 23,112 mi | $35,039 | +$2,953 | +7.77% | 92.12% | 7.88% |
| 2003 | 30,816 mi | $32,500 | +$2,539 | +7.25% | 85.45% | 14.55% |
| 2004 | 38,520 mi | $29,990 | +$2,510 | +7.72% | 78.85% | 21.15% |
| → Visit 2000 FORD RANGER depreciation page to see full data. | ||||||
Price vs Mileage
The graph below shows how mileage affects the price for 2000 FORD RANGER. This data was calculated using sales records from BADVIN database.
The table below shows average price for used 2000 FORD RANGER by mileage and number of sales.
You can scroll the table horizontally to see all columns.
| Mileage | Average Price | Sample Size |
|---|---|---|
| 35,000 mi | $9,993 | 14 sales |
| 40,000 mi | $10,900 | 19 sales |
| 45,000 mi | $10,981 | 14 sales |
| 50,000 mi | $9,999 | 29 sales |
| 55,000 mi | $10,995 | 30 sales |
| 60,000 mi | $9,750 | 38 sales |
| → Visit 2000 FORD RANGER depreciation page to see full data. | ||
Get FULL ACCESS to the vehicle history report and see all blurred info.
⭐ Read 205+ reviews from our customers who used BADVIN to avoid buying junk vehicles.
Testimonials from our customers
I almost bought a used Honda but luckily checked the BadVin report first. Turned out it had a salvage title from flood damage that the seller didn't disclose. Phew, dodged a huge issue!

Emily Turner
verified on Trustpilot
Was about to buy a used 2016 Camry but decided to get the badvin report first. Turns out the car had been in a serious crash and was declared a total loss by insurance, even tho carfax showed it as clean! Dodged a bullet on that one. ty badvin
Jessica Nguyen
verified on Trustpilot
Report showed a car I was considering had a prior salvage title from a major accident, even though carfax listed it as clean. Messaged seller asking about it and they made shady excuses. Def avoided a scam thanks to badvin!
Mia Johnson
verified on Trustpilot
Purchased a badvin report before buying a used Lexus RX 350. It revealed a minor accident the seller hadn't mentioned. I still bought the car but used the info to negotiate a lower price. Well worth the cost for the leverage it gave me!
Aiden Patel
verified on Trustpilot
Compare to other 2000 FORD RANGER
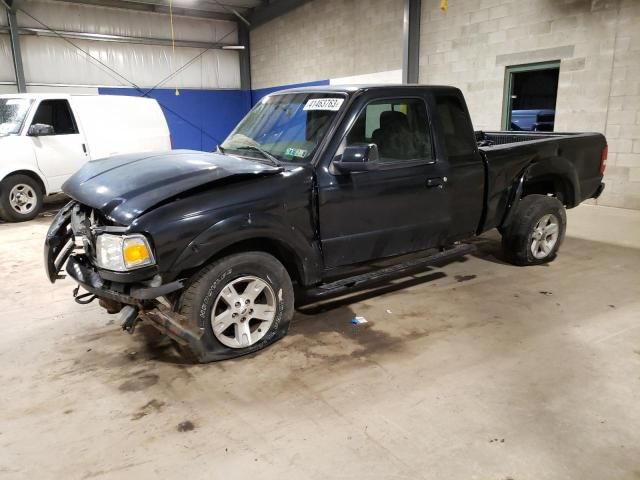
2006 FORD RANGER
23 days ago, 90,557 mi
est retail value $12,000
buy now price $750
VIN 1FTZR45E56PA46996
Other vehicles sales records

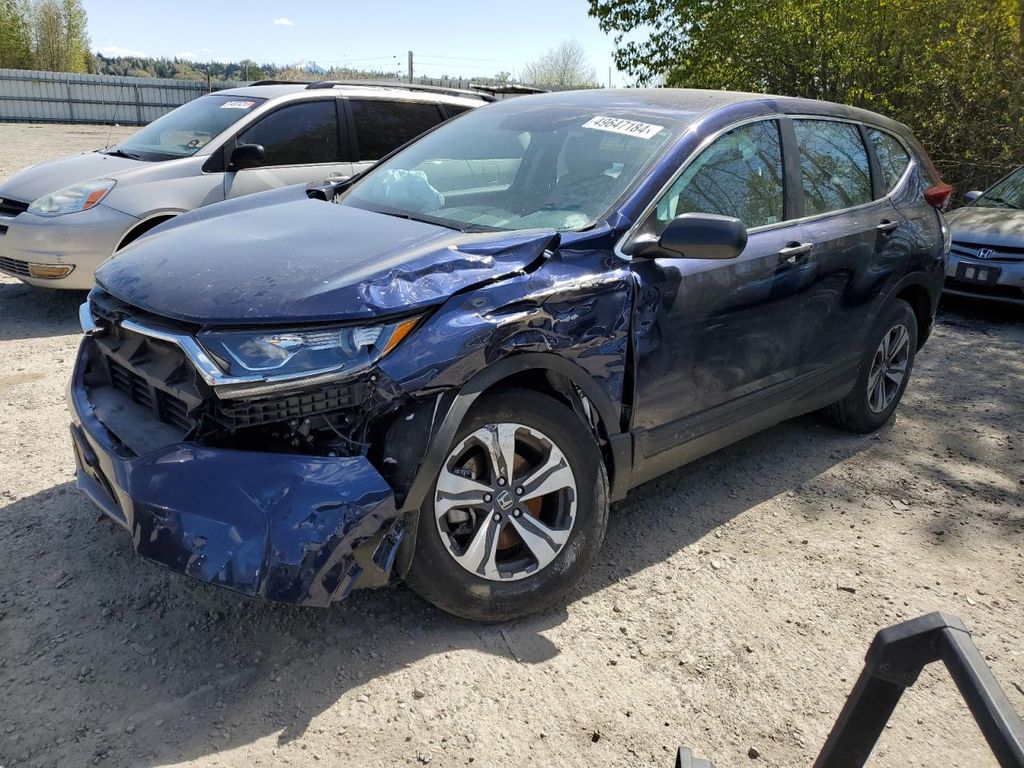


2009 HYUNDAI SANTA FE
in 3 days, 110,172 mi
est retail value $6,353
buy now price $1,150
VIN 5NMSH73E19H288514


Frequently asked questions
To possibly get a vehicle history report by VIN, you can enter the VIN on our website's search tool; the availability and detail of the report will depend on the data accessible for that specific VIN.
The Monroney label can indirectly reflect the resale value of 2000 FORD vehicles by detailing features and specifications that are valued in the used car market.
The report may provide details about regular maintenance and services performed on the 2000 FORD vehicle, which is crucial for assessing its current condition, if such information is recorded.
You can educate yourself about reading and understanding window stickers by researching online resources, asking questions at dealerships, or consulting automotive buying guides that explain the elements of the label.
The window sticker is particularly important for electric and hybrid 2000 FORD vehicles as it provides detailed information on battery range, charging times, and energy consumption.
The depreciation rate can be influenced by factors such as the vehicle's condition, mileage, market demand, and the pace of technological advancements in newer models.
The economic climate can significantly affect the depreciation of vehicles, with higher demand and better economic conditions typically slowing depreciation rates.
New vehicles often depreciate quickly due to rapid advancements in technology and consumer preference for the latest features, which make older models less desirable.


