
BADVIN vehicle history report for
2018 FORD TRANSITVIN: 1FTYE1ZG3JKA94830
Get FULL ACCESS to the vehicle history report and see all blurred info.
⭐ Read 206+ reviews from our customers who used BADVIN to avoid buying junk vehicles.
Historical Records
events
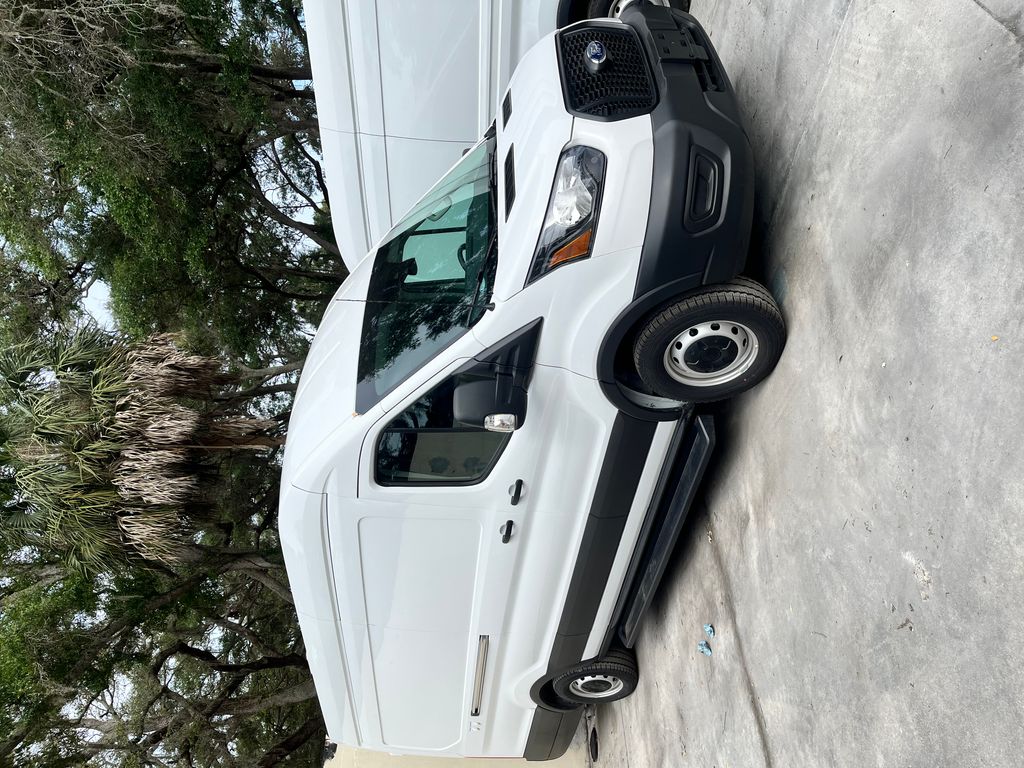
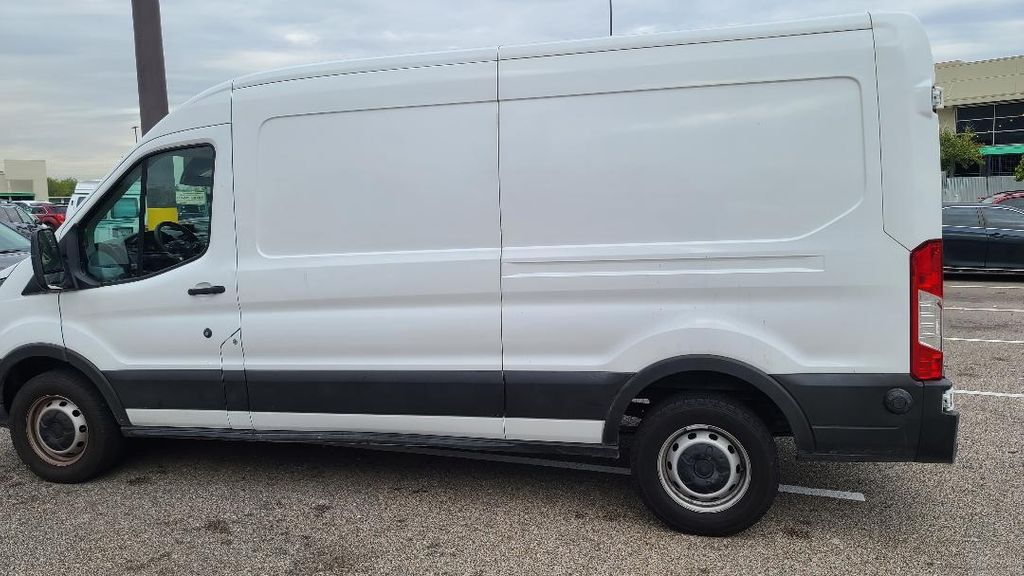
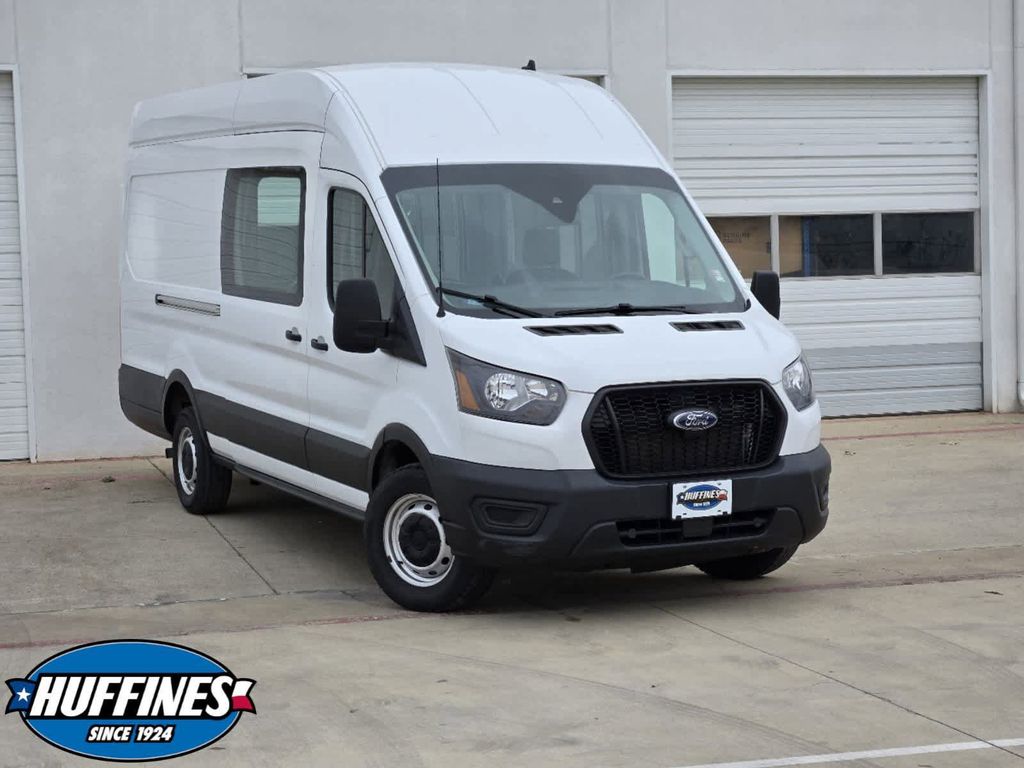
Photos
12 images
Sales History
1 records
Sale Prices
1 records
Market report
Price analytics
Historical Records
Historical records may include service and maintenance records, title status (clean, junk, salvage), insurance records, number of owners, registration events and states, and other information.
You can find more information about historical records in BADVIN reports and see more examples here.
Available historical records for VIN 1FTYE1ZG3JKA94830
Latest reported mileage: 676 mi
Below you can see some examples of what these records could look like.
2023-05-25
a year ago
144,731 mi
TOTAL LOSS VEHICLE
Collision damage reported
Collision damage reported
2021-10-26
3 years ago
23,660 mi
Damage reported: very minor damage
Damage to rear
Damage to rear
2021-08-06
3 years ago
38,310 mi
Passed emissions inspection
2018 Ford Transit 150 130" Low Roof
| Year | 2018 |
| ODO | 9312 mi |
| Seller | Hidden text (Hidden text) |
| Location | Ocala, FL, 34475 |
| Date | appeared 4 years ago latest price $2944 sale post disappeared 2024-01-19 |
| Sale Website Type | classifieds |
| Notes | |
| Hidden text | |
sale information provided by user #41886


All photos above are REAL and display ACTUAL car. After you get the report you will see full resolution photos.
Tech Specs
| Color | Oxford White |
| Color (Interior) | Pewter |
| Transmission | 6-Speed Automatic |
| Engine | 6-Cylinder Turbo |
| Drive | 2 wheel drive - rear |
| Fuel Type | Gasoline |
Standard Features
All these features are based on a model in general. This specific vehicle may differ.
- Hidden text
- Conventional Spare Tire
- Hidden text
- Power Door Locks
- 6716
- Auxiliary Audio Input
- Hidden text
- Order Code 101a
- Hidden text
- A/C
- Hidden text
- Front Head Air Bag
- Hidden text
- Power Steering
- Hidden text
- Bucket Seats
- Hidden text
- Passenger Air Bag Sensor
- Hidden text
- Tires - Rear All-Season
- Hidden text
- Brake Assist
- Hidden text
- Passenger Air Bag On/Off Switch
- Hidden text
- Tires - Front All-Season
- Hidden text
- Traction Control
- Hidden text
- Variable Speed Intermittent Wipers
- Hidden text
- Vinyl Seats
Model Analytics & Market Report
We've analyzed more than 27,100 sales records of this model and here are some numbers.
The average price for new (MSRP) 2018 FORD TRANSIT in 2018 was $40,890.
The average price for used 2018 FORD TRANSIT nowadays in 2024 is $26,996 which is 66% from the original price.
Estimated mileage driven per year is 15,794 miles.
For this model we also have depreciation curve, photos, list of features and options, and other analytics.
Take a look at 2018 FORD TRANSIT model page in BADVIN vehicles catalog.
Depreciation
The graph below is a depreciation curve for 2018 FORD TRANSIT. It shows how much this model looses per year in price. This analytics is calculated using sales records from BADVIN database.
The table below shows average price for used 2018 FORD TRANSIT in each year since the year of manufacturing, current year price and projected price in the future years.
You can scroll the table horizontally to see all columns.
| Year | Average Mileage | Average Price | % Left | % Lost | ||
|---|---|---|---|---|---|---|
| 2018 MSRP | 0 mi | $40,890 | — | — | 100% | 0% |
| 2018 | 15,794 mi | $53,997 | −$13,107 | −32.05% | 132.05% | -32.05% |
| 2019 | 31,588 mi | $47,983 | +$6,014 | +11.14% | 117.35% | -17.35% |
| 2020 | 47,382 mi | $43,495 | +$4,488 | +9.35% | 106.37% | -6.37% |
| 2021 | 63,176 mi | $38,989 | +$4,506 | +10.36% | 95.35% | 4.65% |
| 2022 | 78,970 mi | $35,999 | +$2,990 | +7.67% | 88.04% | 11.96% |
| → Visit 2018 FORD TRANSIT depreciation page to see full data. | ||||||
Price vs Mileage
The graph below shows how mileage affects the price for 2018 FORD TRANSIT. This data was calculated using sales records from BADVIN database.
The table below shows average price for used 2018 FORD TRANSIT by mileage and number of sales.
You can scroll the table horizontally to see all columns.
| Mileage | Average Price | Sample Size |
|---|---|---|
| 5,000 mi | $42,749 | 10 sales |
| 10,000 mi | $39,993 | 16 sales |
| 15,000 mi | $44,449 | 30 sales |
| 20,000 mi | $41,449 | 22 sales |
| 25,000 mi | $40,495 | 53 sales |
| 30,000 mi | $34,993 | 36 sales |
| → Visit 2018 FORD TRANSIT depreciation page to see full data. | ||
Get FULL ACCESS to the vehicle history report and see all blurred info.
⭐ Read 206+ reviews from our customers who used BADVIN to avoid buying junk vehicles.
Testimonials from our customers
Was shopping for a used Range Rover and found one that seemed suspiciously cheap. The badVIN report revealed it had been in a major front end collision, with photos showing the damage. Steered clear of that one and saved myself a ton of headaches!!

Ava Patel
verified on Trustpilot
Purchased a badvin report before buying a used Lexus RX 350. It revealed a minor accident the seller hadn't mentioned. I still bought the car but used the info to negotiate a lower price. Well worth the cost for the leverage it gave me!
Aiden Patel
verified on Trustpilot
I import used luxury cars from US auctions to resell in Russia. The vehicle history reports from badVIN are essential for avoiding problem cars. For a BMW I was bidding on, it uncovered a salvage title from flood damage that other reports missed! That alone pays for the service.
Dmitry Volkov
verified on Trustpilot
I've tried a bunch of different vehicle history reports over the years and badvin.org has been the most comprehensive by far. Stuff like service records, ownership history, lien and repo info that I haven't found elsewhere. Def go-to resource when shopping for used vehicles now.
Levi Johnson
verified on Trustpilot
Compare to other 2018 FORD TRANSIT


Other vehicles sales records


Frequently asked questions
Economic downturns can lead to decreased demand and lower resale values for vehicles, as buyers may defer purchasing vehicles or opt for less expensive alternatives.
MSRP on a Monroney label stands for Manufacturer's Suggested Retail Price, which is the recommended selling price for a vehicle.
Vehicles that have been flooded may have a specific flood title or watermark in the vehicle history report, indicating significant water damage, if such events are documented.
Lien status may indicate whether there are outstanding financial obligations like loans on the 2018 FORD vehicle, which must be settled before ownership can transfer, if such records exist.
Mileage is considered a major factor in the depreciation of vehicles because it directly correlates with the amount of use and potential wear and tear the vehicle has undergone.
The expected depreciation of a vehicle after three years can vary, but generally, cars lose a significant portion of their value within the first few years.
Crashed status, if reported, details past accidents and collisions, essential for evaluating the operational history and current state of the 2018 FORD.
The average depreciation rate for vehicles over five years can vary, but many models experience a significant portion of their depreciation within the first few years of ownership.


