
BADVIN vehicle history report for
2011 FORD RANGERVIN: 1FTLR4FE6BPA05890
Get FULL ACCESS to the vehicle history report and see all blurred info.
⭐ Read 206+ reviews from our customers who used BADVIN to avoid buying junk vehicles.
Historical Records
events
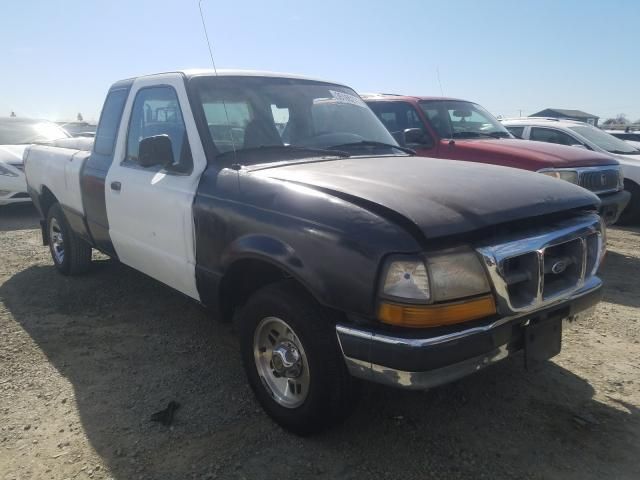
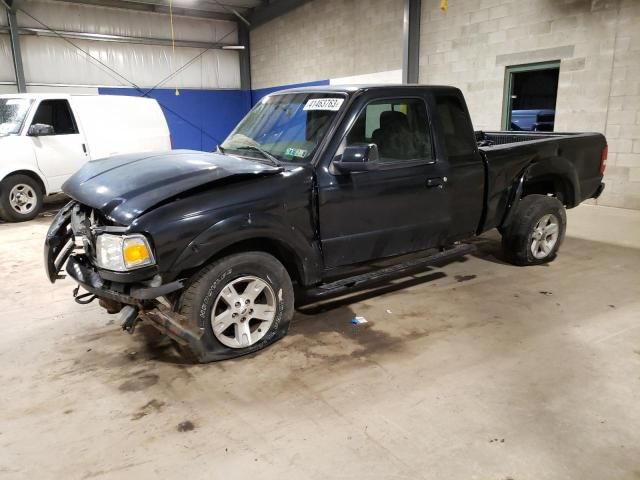
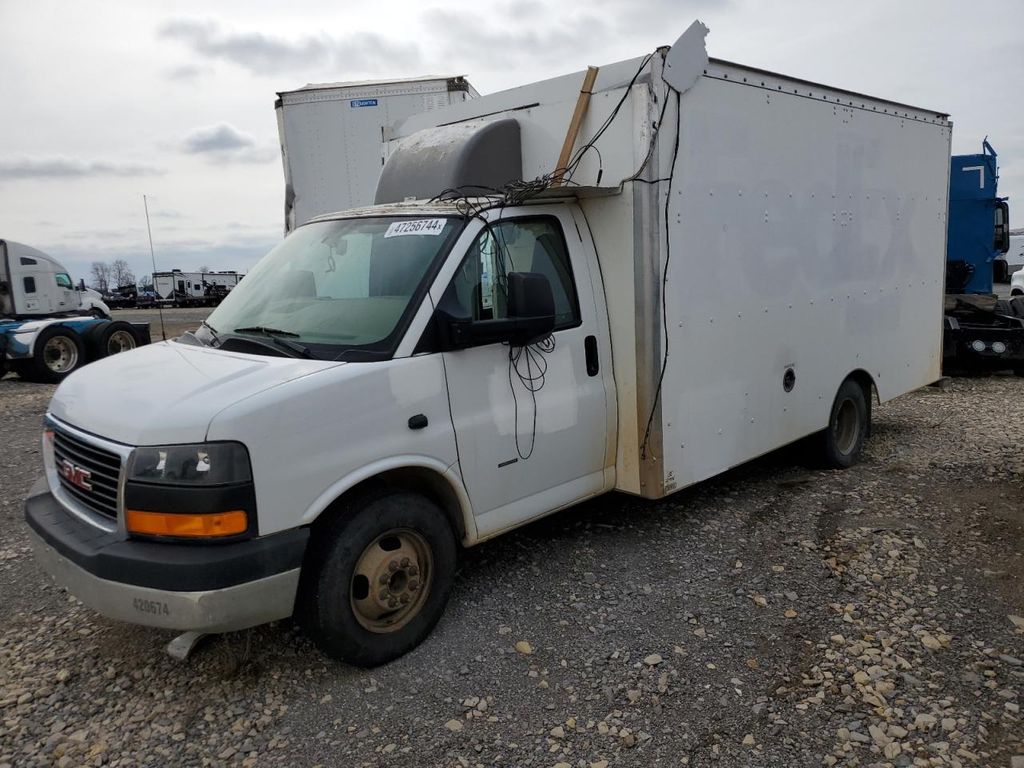
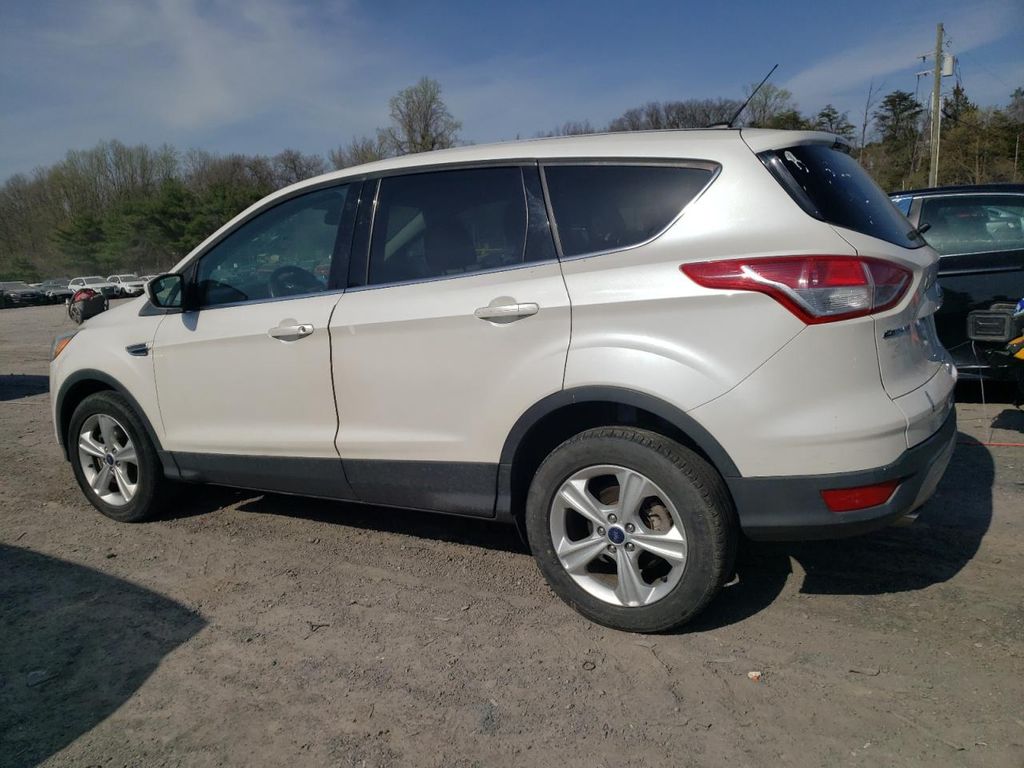
Photos
8 images
Sales History
1 records
Market report
Price analytics
Historical Records
Historical records may include service and maintenance records, title status (clean, junk, salvage), insurance records, number of owners, registration events and states, and other information.
You can find more information about historical records in BADVIN reports and see more examples here.
Available historical records for VIN 1FTLR4FE6BPA05890
Latest reported mileage: 728 mi
Below you can see some examples of what these records could look like.
2023-01-21
a year ago
132,086 mi
REBUILT TITLE ISSUED
2022-08-08
2 years ago
9,793 mi
Vehicle serviced
Maintenance inspection completed
Maintenance inspection completed
2020-02-24
4 years ago
48,019 mi
Duplicate title issued
REBUILT TITLE ISSUED
REBUILT TITLE ISSUED
Sale Record
2011 FORD RANGER SUPER CAB
sold
| Year | 2011 |
| Title | Hidden text (Hidden text) |
| ODO | 8021 mi (Hidden text) |
| Damage | Hidden text, Hidden text |
| Estimated Retail Value | $8219 |
| Estimated Repair Cost | $1162 (990%) |
| Location | Toronto, ON, R3H 0A1 |
| Date | ended 2 years ago |
| Sale Website Type | salvage or insurance auction |
| Notes | |
| Hidden text | |
sale information provided by user #250158


All photos above are REAL and display ACTUAL car. After you get the report you will see full resolution photos.
Tech Specs
| Body Style | 4DR EXT |
| Color | WHITE |
| Transmission | AUTOMATIC |
| Engine | 4.0L 6 |
| Drive | 4x4 w/Rear Wheel Drv |
| Fuel Type | GAS |
Model Analytics & Market Report
We've analyzed more than 28,000 sales records of this model and here are some numbers.
The average price for new (MSRP) 2011 FORD RANGER in 2011 was $38,035.
The average price for used 2011 FORD RANGER nowadays in 2024 is $13,995 which is 37% from the original price.
Estimated mileage driven per year is 7,704 miles.
For this model we also have depreciation curve, photos, list of features and options, and other analytics.
Take a look at 2011 FORD RANGER model page in BADVIN vehicles catalog.
Depreciation
The graph below is a depreciation curve for 2011 FORD RANGER. It shows how much this model looses per year in price. This analytics is calculated using sales records from BADVIN database.
The table below shows average price for used 2011 FORD RANGER in each year since the year of manufacturing, current year price and projected price in the future years.
You can scroll the table horizontally to see all columns.
| Year | Average Mileage | Average Price | % Left | % Lost | ||
|---|---|---|---|---|---|---|
| 2011 MSRP | 0 mi | $38,035 | — | — | 100% | 0% |
| 2011 | 7,704 mi | $55,746 | −$17,711 | −46.57% | 146.57% | -46.57% |
| 2012 | 15,408 mi | $37,992 | +$17,754 | +31.85% | 99.89% | 0.11% |
| 2013 | 23,112 mi | $35,039 | +$2,953 | +7.77% | 92.12% | 7.88% |
| 2014 | 30,816 mi | $32,500 | +$2,539 | +7.25% | 85.45% | 14.55% |
| 2015 | 38,520 mi | $29,990 | +$2,510 | +7.72% | 78.85% | 21.15% |
| → Visit 2011 FORD RANGER depreciation page to see full data. | ||||||
Price vs Mileage
The graph below shows how mileage affects the price for 2011 FORD RANGER. This data was calculated using sales records from BADVIN database.
The table below shows average price for used 2011 FORD RANGER by mileage and number of sales.
You can scroll the table horizontally to see all columns.
| Mileage | Average Price | Sample Size |
|---|---|---|
| 10,000 mi | $19,997 | 15 sales |
| 15,000 mi | $21,049 | 22 sales |
| 20,000 mi | $19,986 | 44 sales |
| 25,000 mi | $19,990 | 107 sales |
| 30,000 mi | $18,995 | 131 sales |
| 35,000 mi | $18,981 | 115 sales |
| → Visit 2011 FORD RANGER depreciation page to see full data. | ||
Get FULL ACCESS to the vehicle history report and see all blurred info.
⭐ Read 206+ reviews from our customers who used BADVIN to avoid buying junk vehicles.
Testimonials from our customers
As a broke college kid I almost settled for a sketchy 2005 Altima cuz it was cheap. but splurged on the report from badvin 1st. soooo glad I did - turned out it had been totalled and rebuilt. spending a little saved me from wasting $1000s!

Sophie
verified on Trustpilot
I've tried many vehicle reports but badvin's is by far the most comprehensive. It shows accident photos, past sales, repairs and so much more. I won't buy a car now without getting a report first. It's a must-have.
Alexander Hunt
verified on Trustpilot
After a bad experience buying a used car that turned out to have major issues, I now use Bad VIN to thoroughly check every vehicle i consider. It costs a bit more than other services but the detailed records and photos of past sales are wotrh it for the added peace of mind.
Olivia Johnson
verified on Trustpilot
Was about to buy a used 2016 Camry but decided to get the badvin report first. Turns out the car had been in a serious crash and was declared a total loss by insurance, even tho carfax showed it as clean! Dodged a bullet on that one. ty badvin
Jessica Nguyen
verified on Trustpilot
Compare to other 2011 FORD RANGER
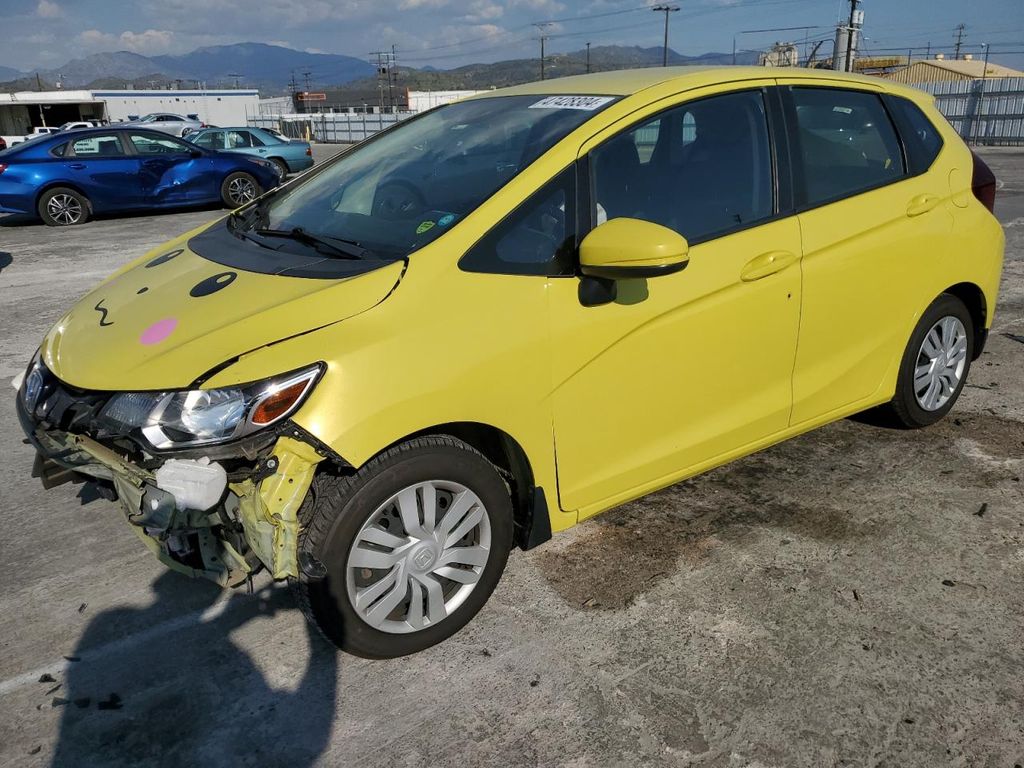
2006 FORD RANGER
a month ago, 90,557 mi
est retail value $12,000
buy now price $750
VIN 1FTZR45E56PA46996
Other vehicles sales records

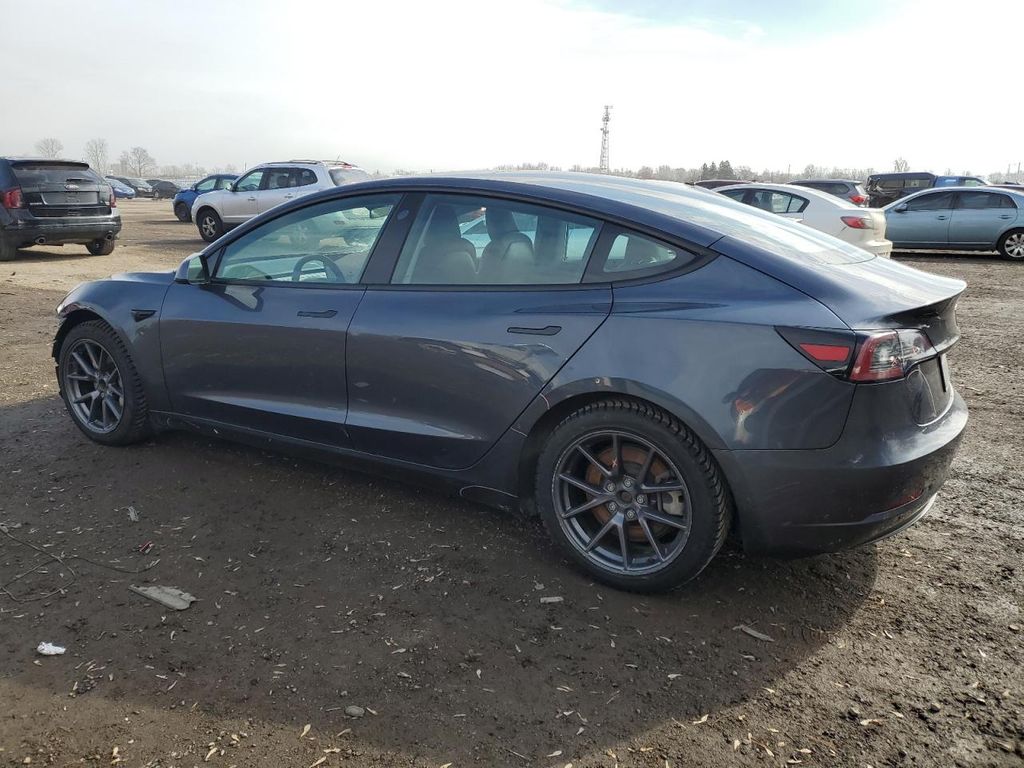
2021 TESLA MODEL 3
in 2 days, 160,186 mi
est retail value $31,422
buy now price $12,700
VIN 5YJ3E1EA2MF973930
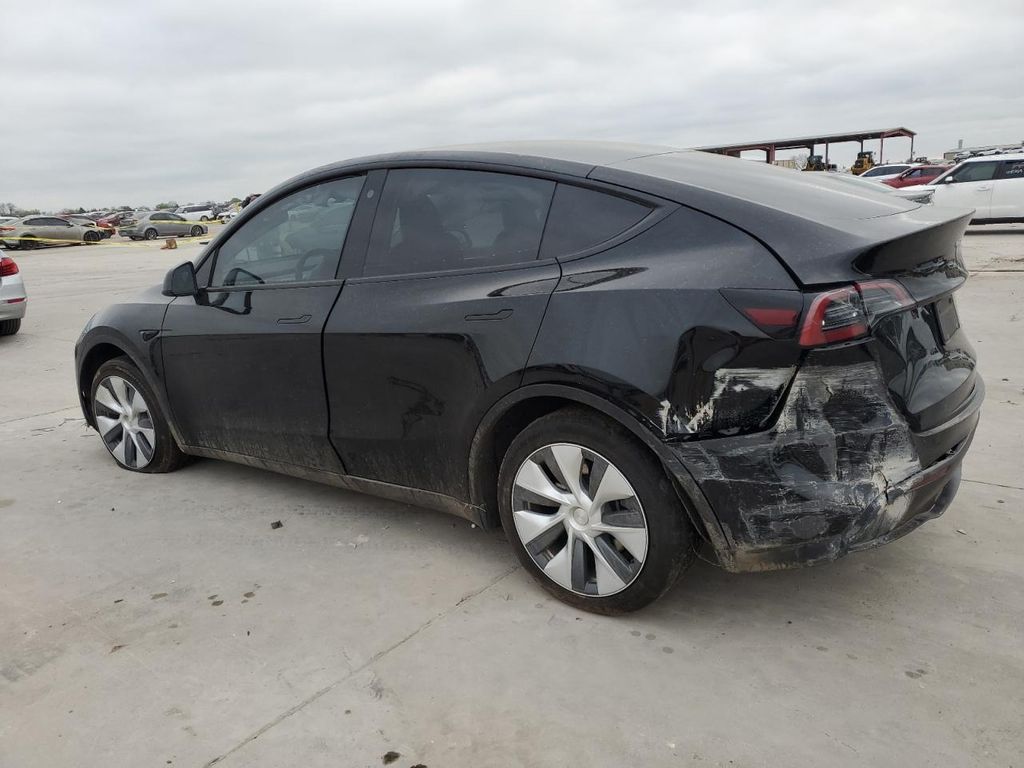
2023 TESLA MODEL Y
18 days ago, 22,666 mi
est retail value $65,630
buy now price $27,200
VIN 7SAYGDEE3PA046914
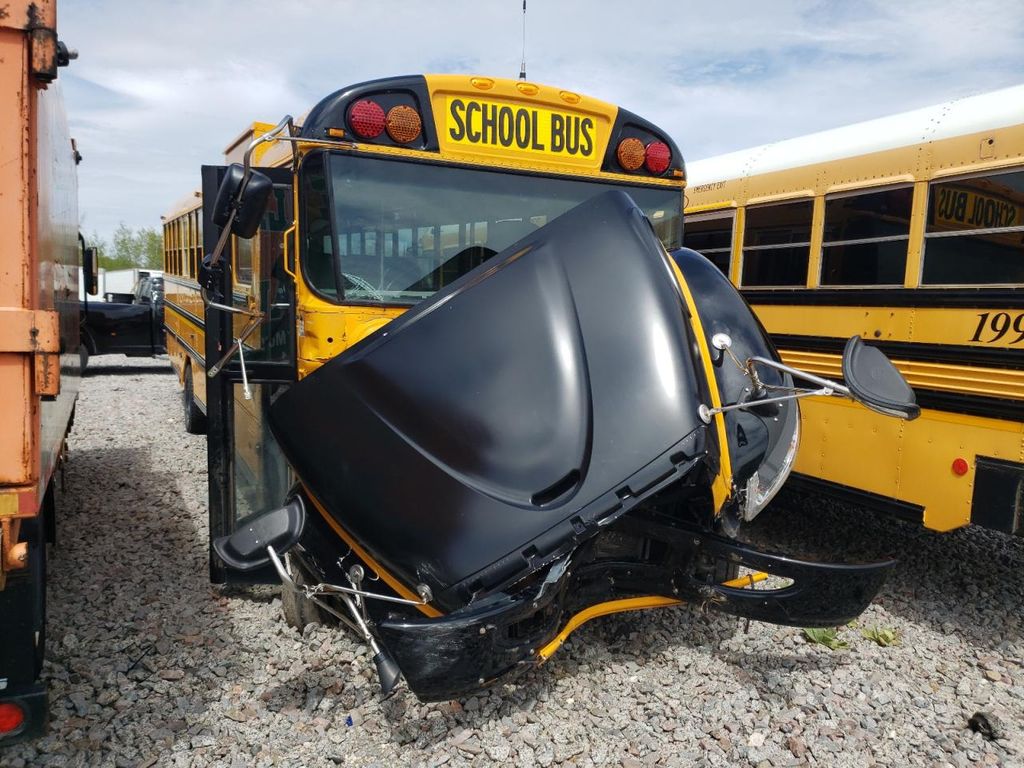
2021 IC CORPORATION 3000 CE
in 2 days,
est retail value $77,500
buy now price $6,875
VIN 4DRBUC8P4MB273836


Frequently asked questions
Yes, the window sticker can help you negotiate a better price on a new 2011 FORD RANGER by providing you with detailed pricing information and the cost of optional extras.
A VIN decoder can provide detailed information about a 2011 FORD RANGER, including its manufacturing location, model year, engine type, and equipment details.
Warranty returns, if documented, are detailed with reasons for returns and repairs made, providing insight into past issues with the 2011 FORD vehicle.
Total loss status, if documented, is reported along with the circumstances and damage type, critical for assessing whether the 2011 FORD vehicle has been substantially compromised.
Vehicle values are typically derived from leading sources and might indicate trade-in, retail, and other value ranges, providing a pricing baseline for the 2011 FORD RANGER, based on available data.
To maximize value, consider buying a vehicle that is a few years old, as it has already undergone significant depreciation but likely remains reliable.
The Monroney label can indirectly reflect the resale value of 2011 FORD vehicles by detailing features and specifications that are valued in the used car market.
The average depreciation rate for vehicles over five years can vary, but many models experience a significant portion of their depreciation within the first few years of ownership.
Depreciation, which reflects the decline in a 2011 FORD vehicle's value over time due to factors like age, mileage, and condition, may directly impact its resale value, based on recorded information.


