
BADVIN vehicle history report for
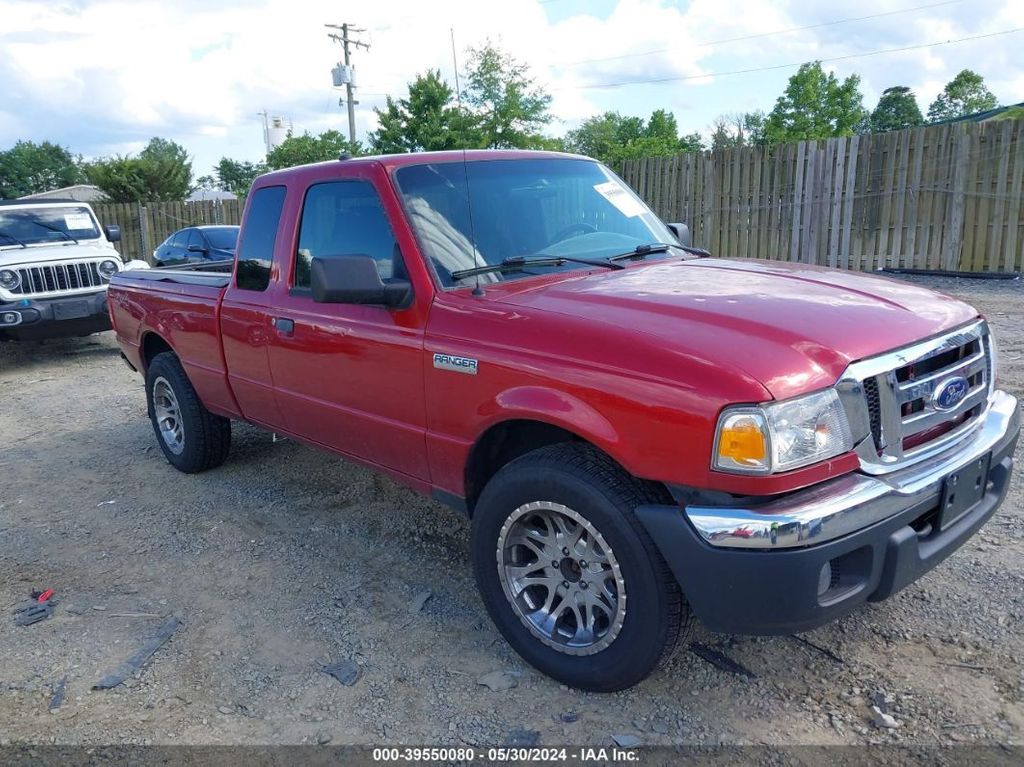
2011 FORD RANGERVIN: 1FTKR1ED4BPA54363
Get FULL ACCESS to the vehicle history report and see all blurred info.
⭐ Read 206+ reviews from our customers who used BADVIN to avoid buying junk vehicles.
Historical Records
events
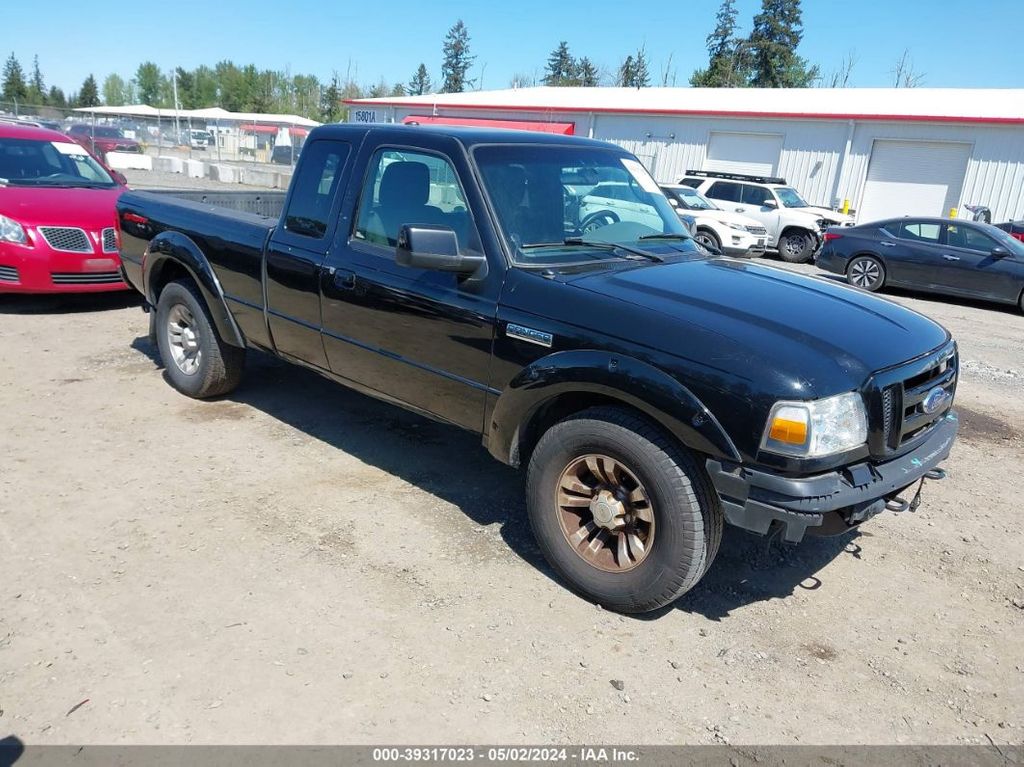
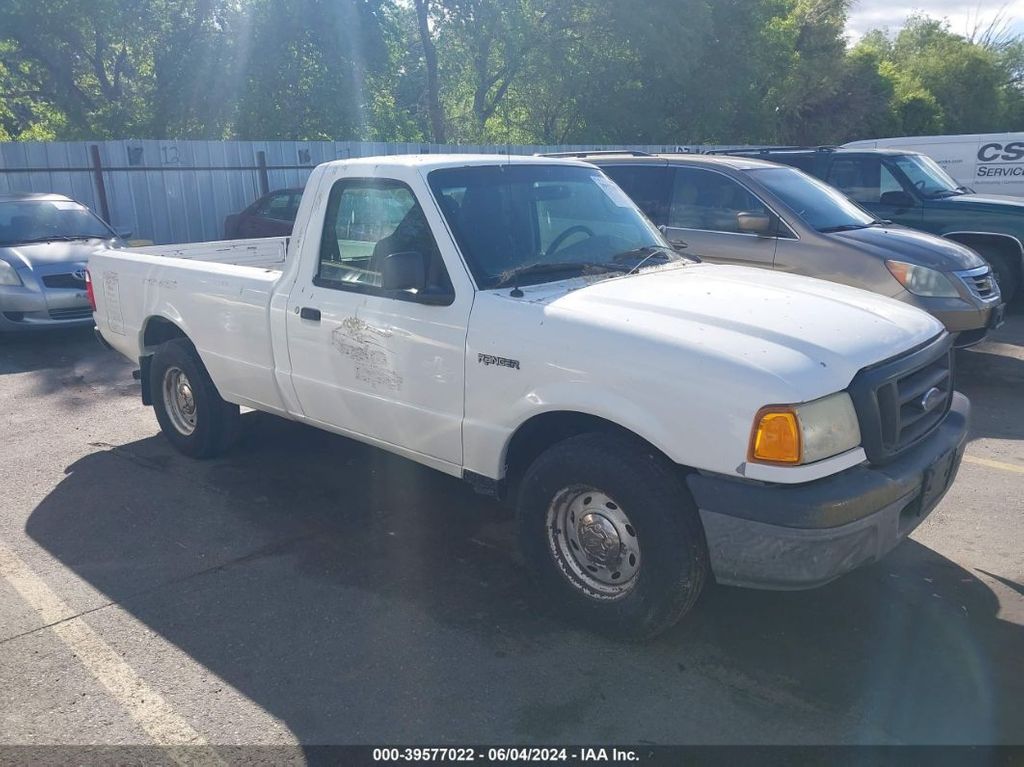
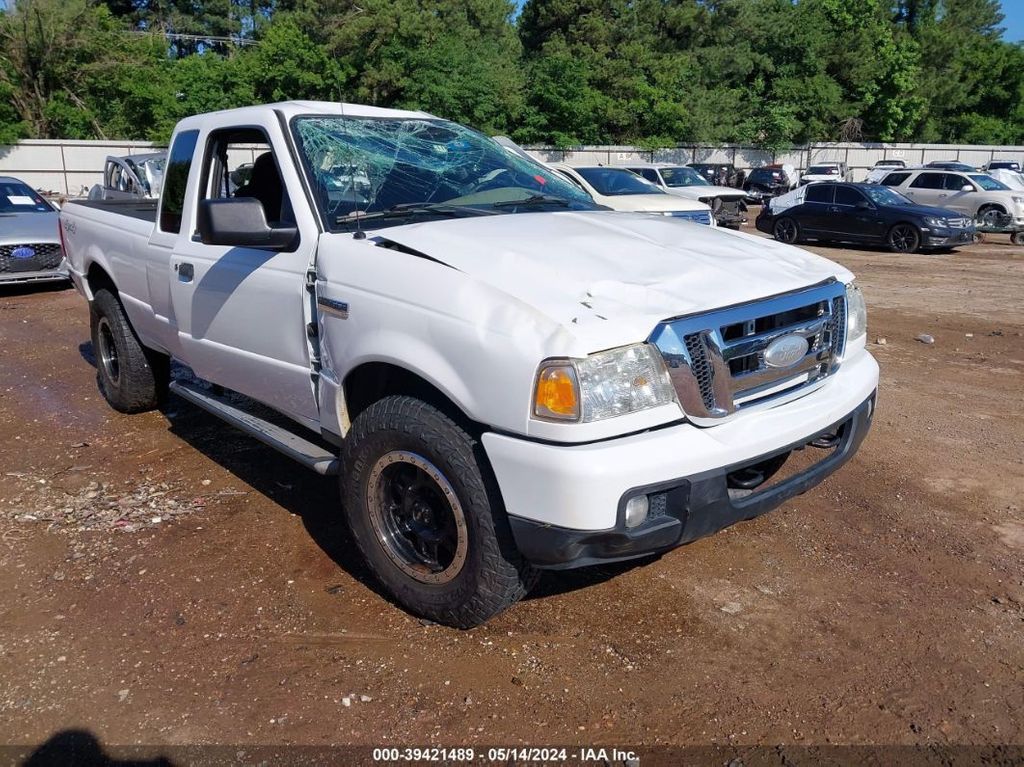
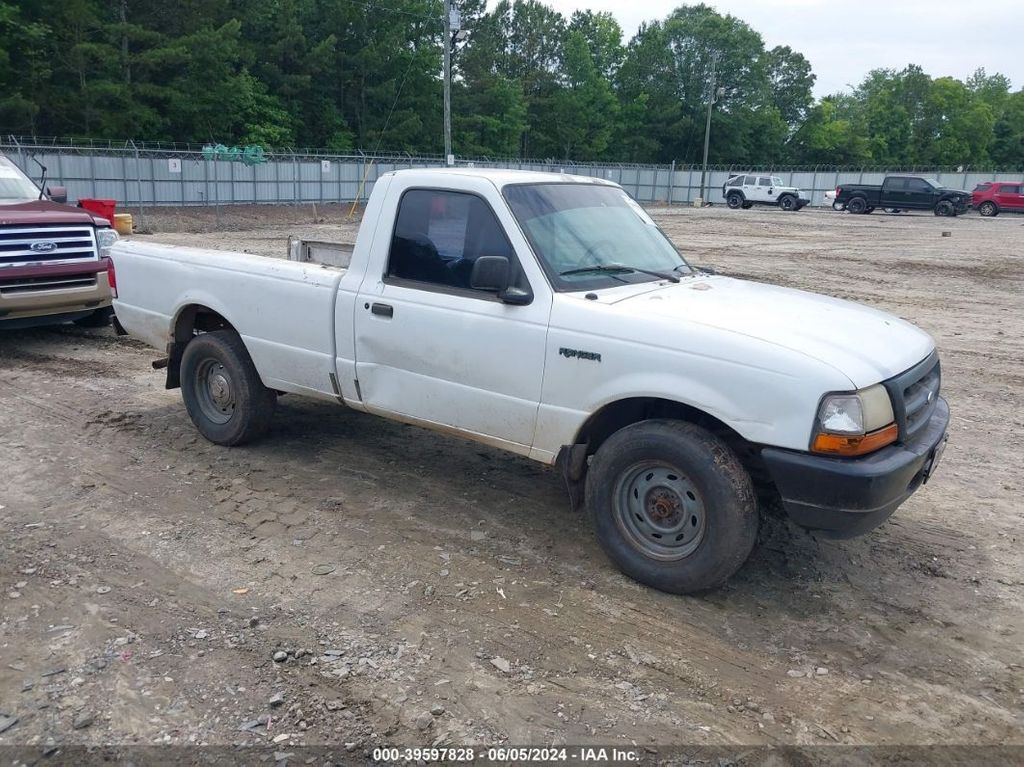
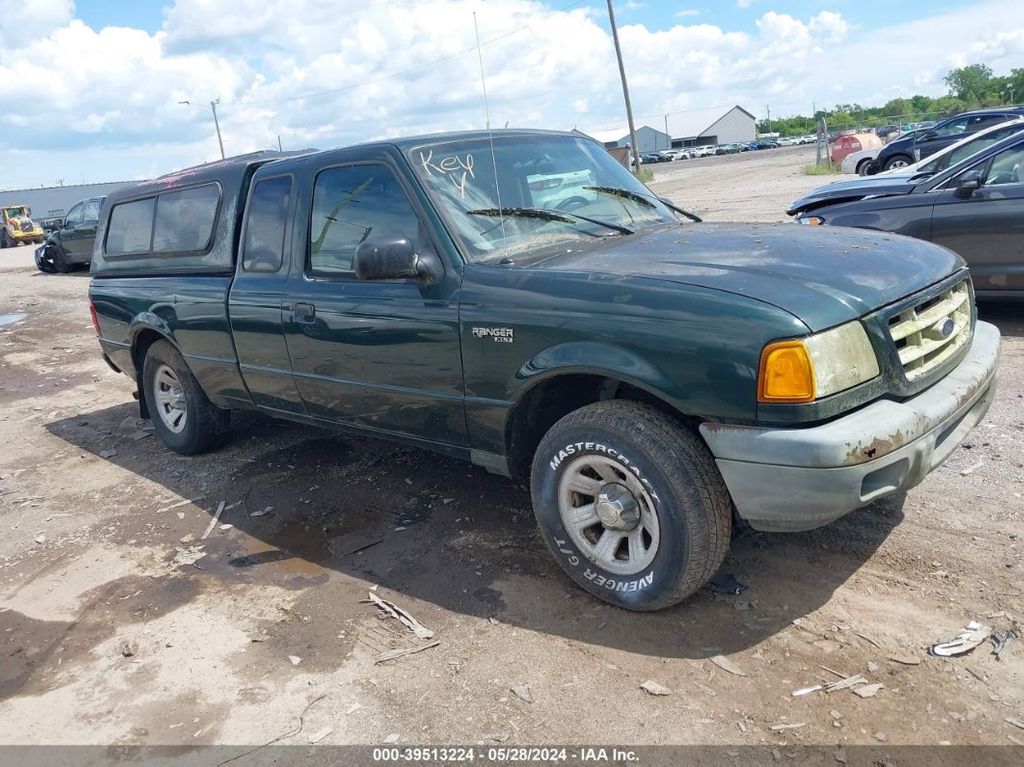
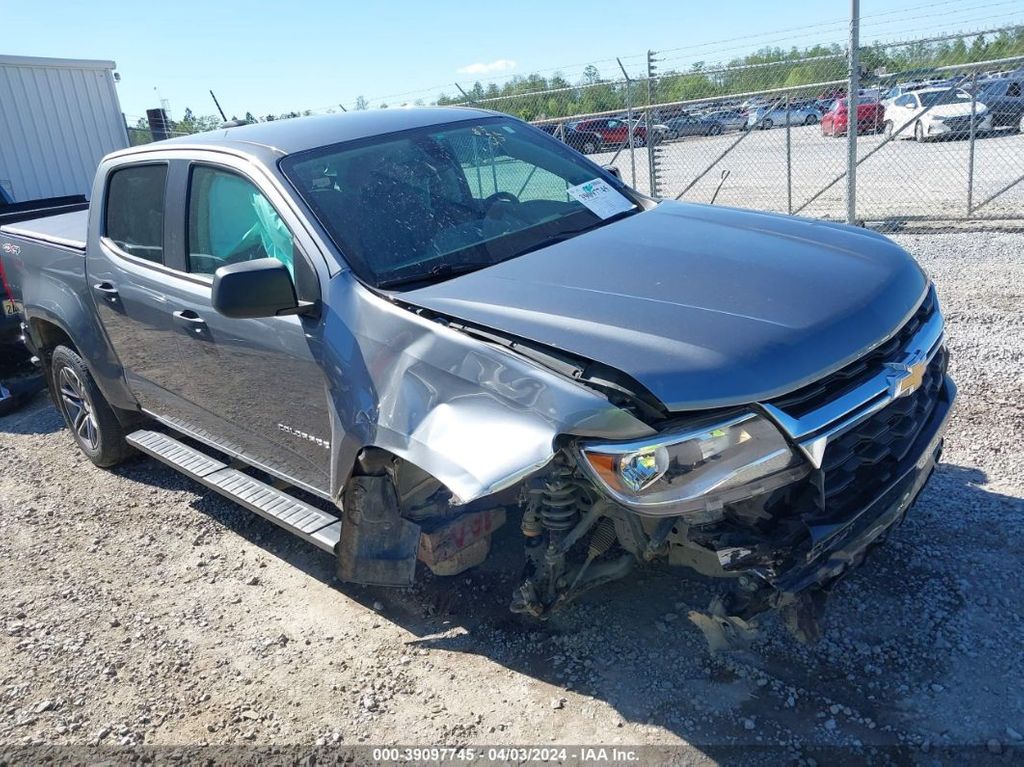
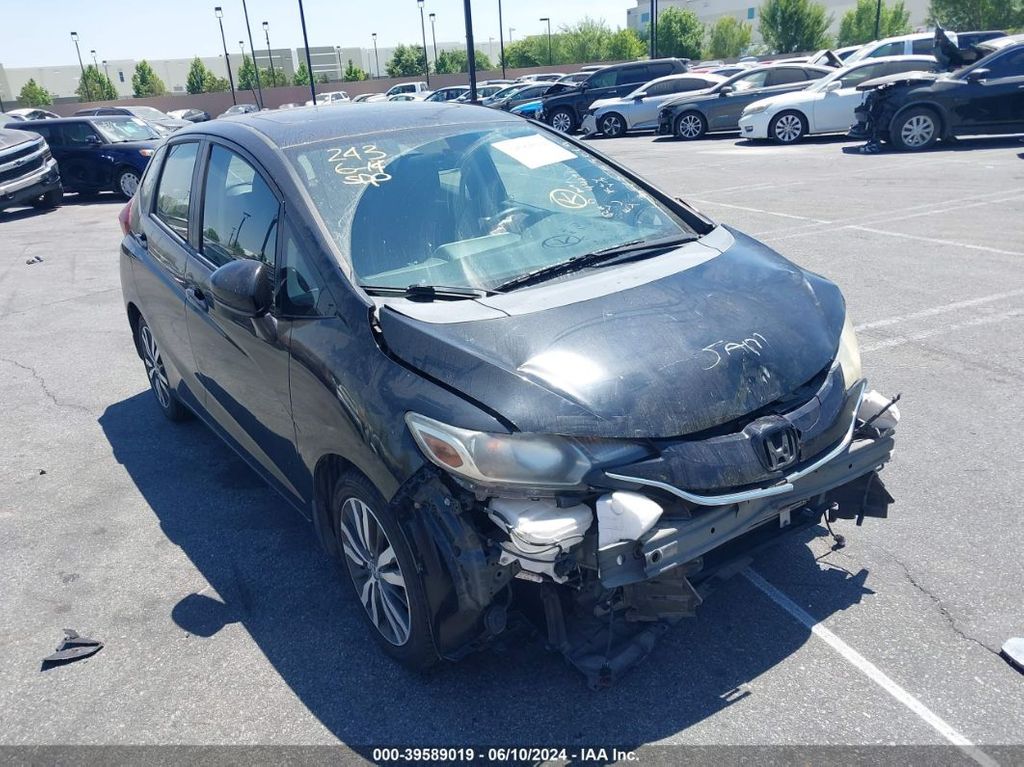
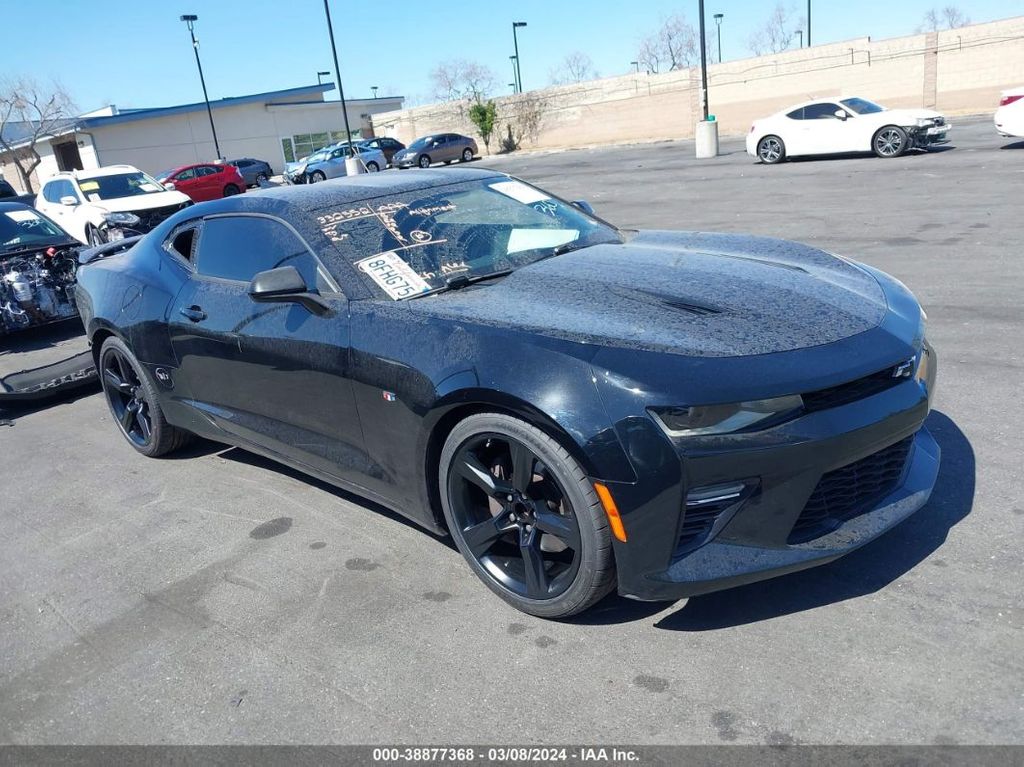
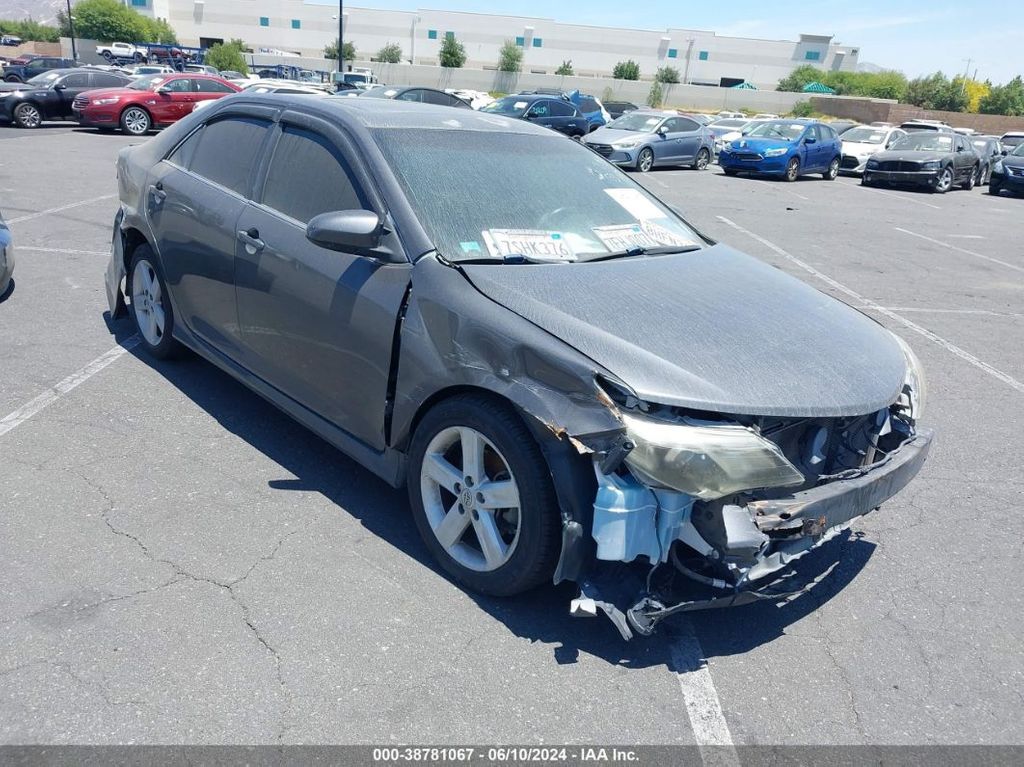
Photos
11 images
Sales History
1 records
Sale Prices
2 records
Market report
Price analytics
Historical Records
Historical records may include service and maintenance records, title status (clean, junk, salvage), insurance records, number of owners, registration events and states, and other information.
You can find more information about historical records in BADVIN reports and see more examples here.
Available historical records for VIN 1FTKR1ED4BPA54363
Latest reported mileage: 311 mi
Below you can see some examples of what these records could look like.
2023-10-04
8 months ago
59,665 mi
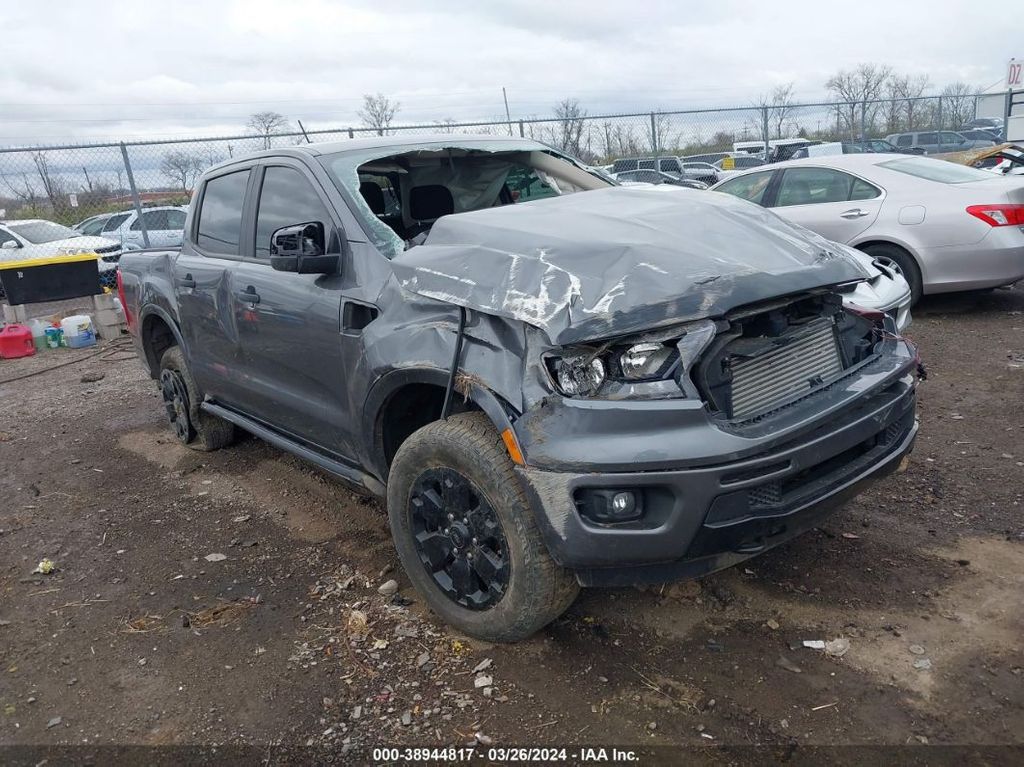
TOTAL LOSS VEHICLE
Collision damage reported
Collision damage reported
2021-10-21
3 years ago
14,389 mi
Vehicle serviced
Tire repaired
Tire repaired
2020-04-29
4 years ago
28,491 mi
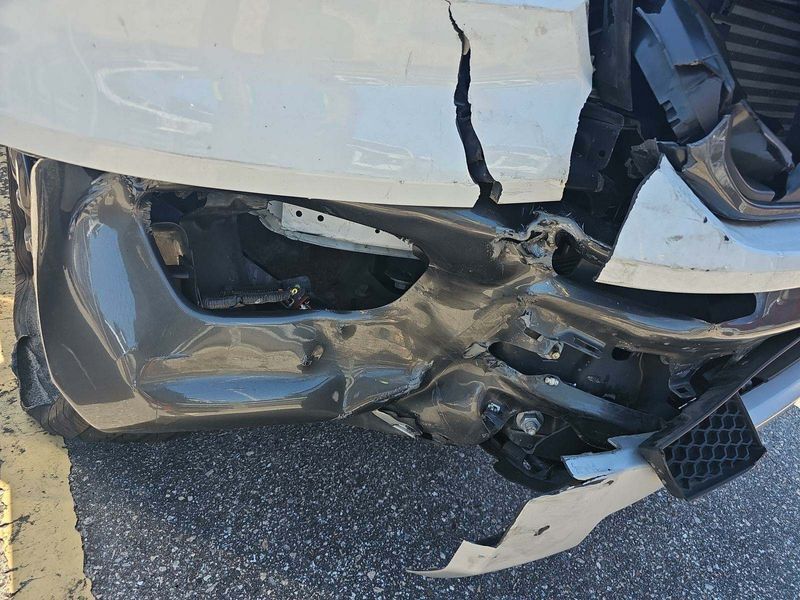
Damage reported
Damage to front
Damage to front
Sale Record
Has Keys:Hidden text
| Year | 2011 |
| ODO | — |
| Loss | Hidden text |
| Damage | Hidden text |
| Estimated Retail Value | $7716 |
| Seller | Hidden text |
| Location | Jackson, MS, 39213 |
| Date | ended 3 years ago sold for $2758 |
| Sale Website Type | salvage or insurance auction |
sale information provided by user #940452


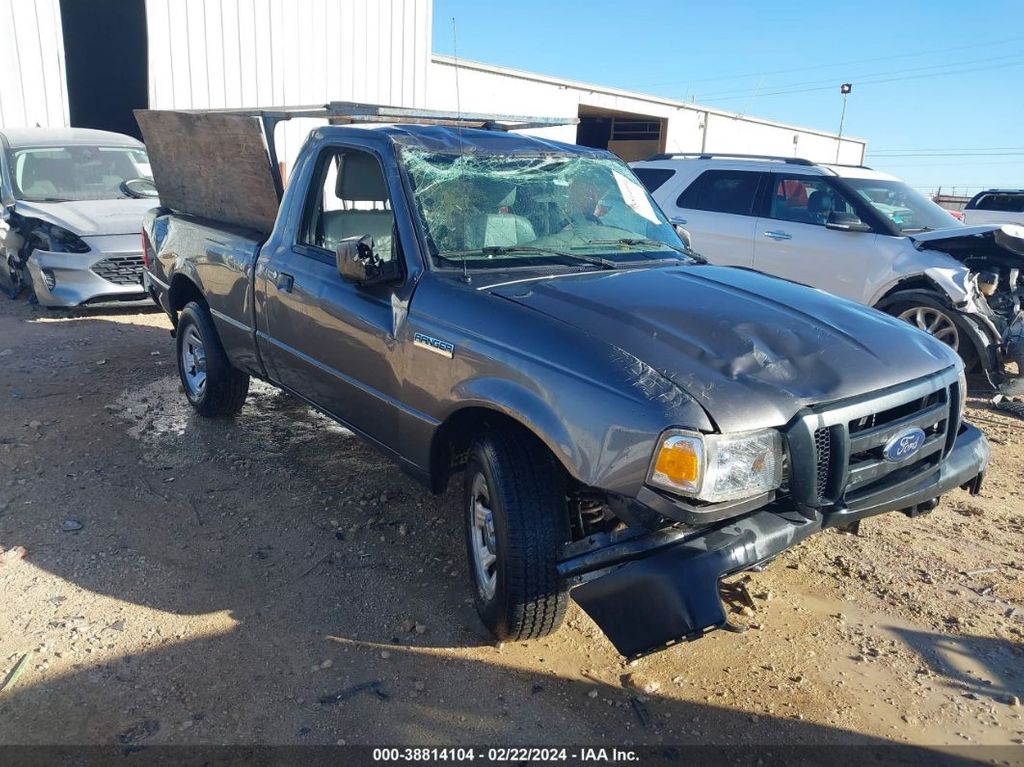
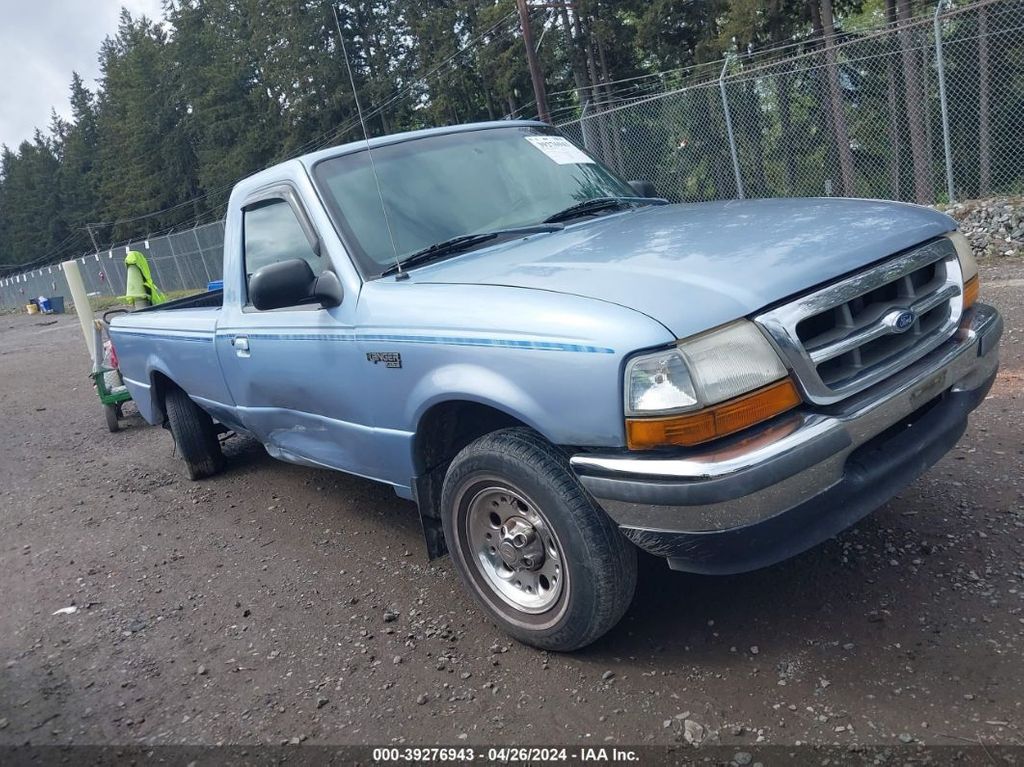
All photos above are REAL and display ACTUAL car. After you get the report you will see full resolution photos.
Tech Specs
| Engine | 2.3L DOHC 16-VALVE I4 ENGINE |
| Cylinders | 4 Cylinders |
| Drive | Rear Wheel Drive |
| Fuel Type | Gasoline |
Model Analytics & Market Report
We've analyzed more than 28,000 sales records of this model and here are some numbers.
The average price for new (MSRP) 2011 FORD RANGER in 2011 was $38,035.
The average price for used 2011 FORD RANGER nowadays in 2024 is $13,995 which is 37% from the original price.
Estimated mileage driven per year is 7,704 miles.
For this model we also have depreciation curve, photos, list of features and options, and other analytics.
Take a look at 2011 FORD RANGER model page in BADVIN vehicles catalog.
Depreciation
The graph below is a depreciation curve for 2011 FORD RANGER. It shows how much this model looses per year in price. This analytics is calculated using sales records from BADVIN database.
The table below shows average price for used 2011 FORD RANGER in each year since the year of manufacturing, current year price and projected price in the future years.
You can scroll the table horizontally to see all columns.
| Year | Average Mileage | Average Price | % Left | % Lost | ||
|---|---|---|---|---|---|---|
| 2011 MSRP | 0 mi | $38,035 | — | — | 100% | 0% |
| 2011 | 7,704 mi | $55,746 | −$17,711 | −46.57% | 146.57% | -46.57% |
| 2012 | 15,408 mi | $37,992 | +$17,754 | +31.85% | 99.89% | 0.11% |
| 2013 | 23,112 mi | $35,039 | +$2,953 | +7.77% | 92.12% | 7.88% |
| 2014 | 30,816 mi | $32,500 | +$2,539 | +7.25% | 85.45% | 14.55% |
| 2015 | 38,520 mi | $29,990 | +$2,510 | +7.72% | 78.85% | 21.15% |
| → Visit 2011 FORD RANGER depreciation page to see full data. | ||||||
Price vs Mileage
The graph below shows how mileage affects the price for 2011 FORD RANGER. This data was calculated using sales records from BADVIN database.
The table below shows average price for used 2011 FORD RANGER by mileage and number of sales.
You can scroll the table horizontally to see all columns.
| Mileage | Average Price | Sample Size |
|---|---|---|
| 10,000 mi | $19,997 | 15 sales |
| 15,000 mi | $21,049 | 22 sales |
| 20,000 mi | $19,986 | 44 sales |
| 25,000 mi | $19,990 | 107 sales |
| 30,000 mi | $18,995 | 131 sales |
| 35,000 mi | $18,981 | 115 sales |
| → Visit 2011 FORD RANGER depreciation page to see full data. | ||
Get FULL ACCESS to the vehicle history report and see all blurred info.
⭐ Read 206+ reviews from our customers who used BADVIN to avoid buying junk vehicles.
Testimonials from our customers
Purchased a badvin report before buying a used Lexus RX 350. It revealed a minor accident the seller hadn't mentioned. I still bought the car but used the info to negotiate a lower price. Well worth the cost for the leverage it gave me!

Aiden Patel
verified on Trustpilot
After a bad experience buying a used car that turned out to have major issues, I now use Bad VIN to thoroughly check every vehicle i consider. It costs a bit more than other services but the detailed records and photos of past sales are wotrh it for the added peace of mind.
Olivia Johnson
verified on Trustpilot
I buy rebuilt title cars at copart to fix and resell. was hoping BadVin reports wud have more detail on damage history to help me value cars before bidding, Carfax is better for that. but for clean title vehicles it seems pretty useful
Fatima
verified on Trustpilot
Report showed a car I was considering had a prior salvage title from a major accident, even though carfax listed it as clean. Messaged seller asking about it and they made shady excuses. Def avoided a scam thanks to badvin!
Mia Johnson
verified on Trustpilot
Compare to other 2011 FORD RANGER
2022 FORD RANGER
7 hours ago, 35,999 mi
est retail value $30,879
buy now price $6,000
VIN 1FTER4FH5NLD09419

2003 FORD RANGER
7 hours ago, 138,129 mi
est retail value $1,325
buy now price $700
VIN 1FTZR14V13PB37372

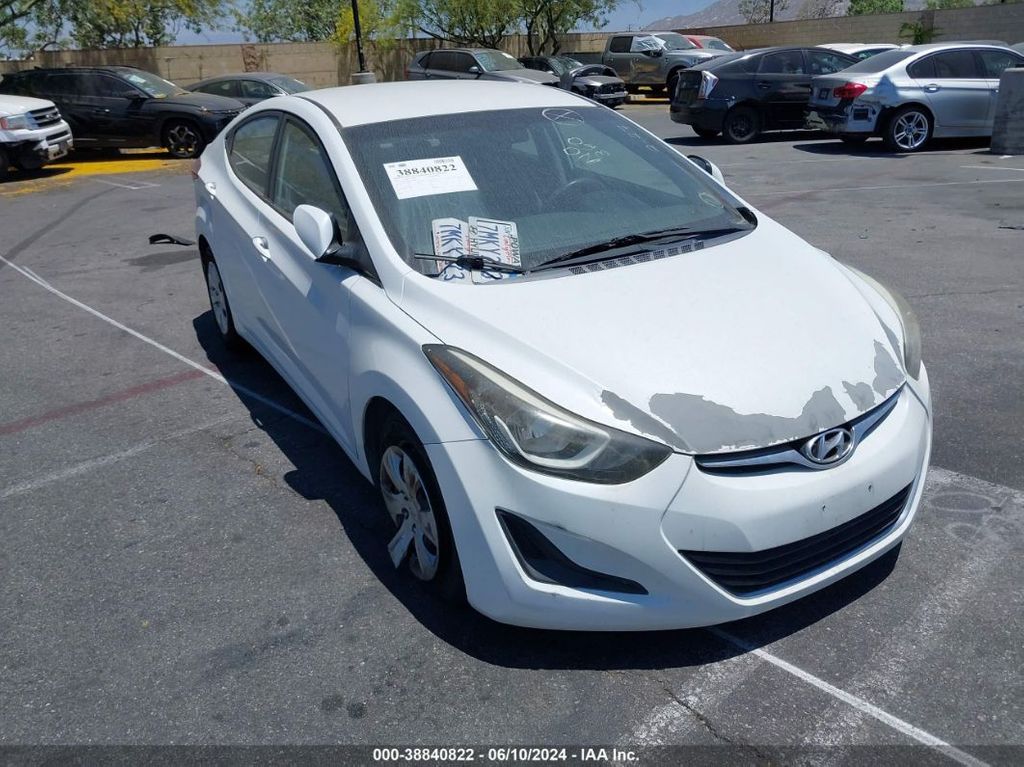
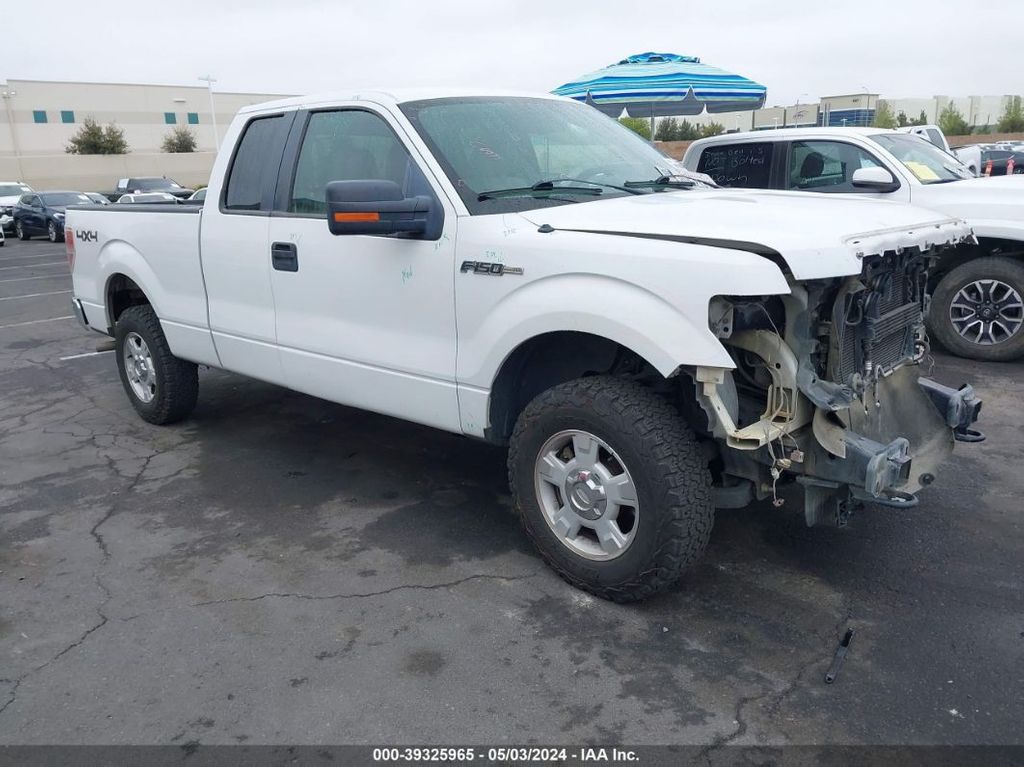
Other vehicles sales records


2022 TOYOTA TUNDRA
15 days ago, 51,422 mi
est retail value $56,232
sold for $31,075
VIN 5TFJA5DB8NX033546
2021 CHEVROLET COLORADO
20 days ago, 71,727 mi
est retail value $25,842
buy now price $7,975
VIN 1GCGTBEN2M1117598
Frequently asked questions
Strategies to reduce the rate of depreciation include regular maintenance, keeping mileage low, avoiding significant modifications, and keeping up with all necessary repairs.
Mileage is considered a major factor in the depreciation of vehicles because it directly correlates with the amount of use and potential wear and tear the vehicle has undergone.
You can find your vehicle's VIN on the dashboard on the driver's side, visible through the windshield, and on your vehicle's registration documents.
If theft records are present, it’s crucial to ensure the vehicle has been recovered and legally cleared for sale to avoid potential legal issues, depending on the accuracy of the data.
The vehicle history report may include a section on theft history, showing if the vehicle was ever reported stolen, depending on the records available.
Refurbished status, if recorded, is detailed with information on parts replaced and upgrades made, affecting the resale value and reliability of the 2011 FORD.
Information on structural damage, including the extent and location of the damage, may be detailed in our vehicle history reports for 2011 FORD vehicles, if available.


