
BADVIN vehicle history report for
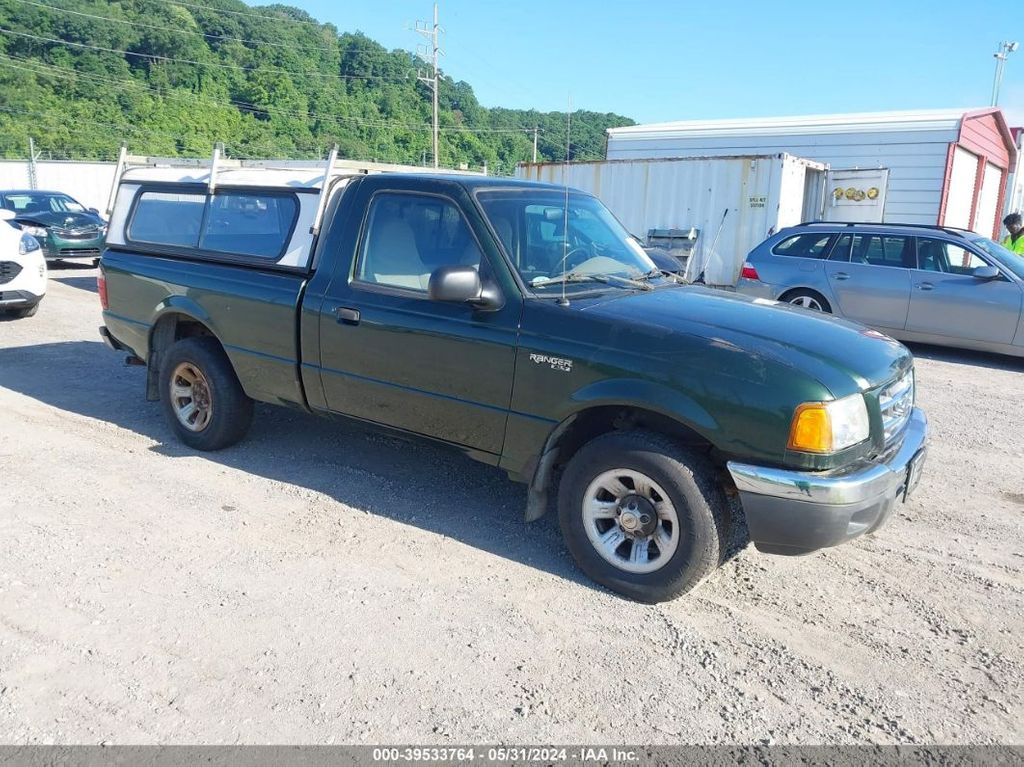
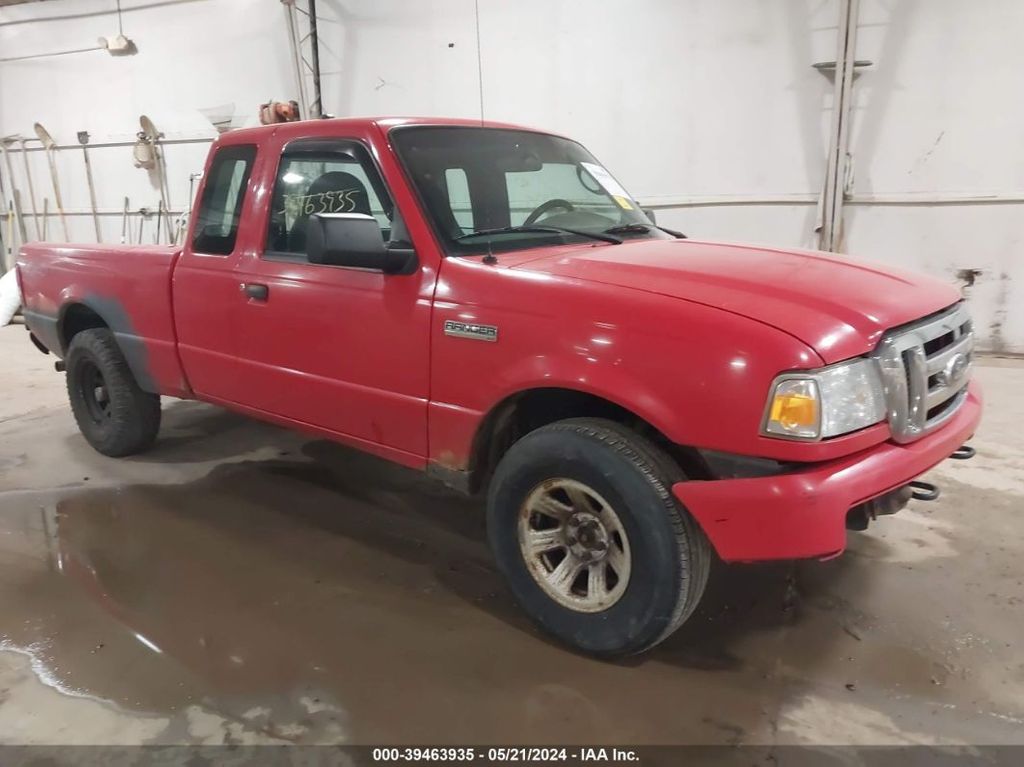
2011 FORD RANGERVIN: 1FTKR1AD3BPA05550
Get FULL ACCESS to the vehicle history report and see all blurred info.
⭐ Read 206+ reviews from our customers who used BADVIN to avoid buying junk vehicles.
Historical Records
events
Sales History
1 records
Market report
Price analytics
Historical Records
Historical records may include service and maintenance records, title status (clean, junk, salvage), insurance records, number of owners, registration events and states, and other information.
You can find more information about historical records in BADVIN reports and see more examples here.
Available historical records for VIN 1FTKR1AD3BPA05550
Latest reported mileage: 599 mi
Below you can see some examples of what these records could look like.
2023-09-05
9 months ago
56,964 mi
Fire damage reported: minor damage
Vandalism damage reported
Damage to front
Vandalism damage reported
Damage to front
2022-04-27
2 years ago
19,128 mi
Vehicle serviced
40,000 mile service performed
40,000 mile service performed
2020-05-02
4 years ago
34,272 mi
New owner reported
REBUILT TITLE ISSUED
REBUILT TITLE ISSUED
Sale Record
Has Keys:Hidden text
| Year | 2011 |
| Title | Hidden text |
| ODO | 6029 mi (Hidden text) |
| Loss | Hidden text |
| Damage | Hidden text |
| Estimated Retail Value | $1033 |
| Location | Detroit, MI, 48228 |
| Date | ended a year ago |
| Sale Website Type | salvage or insurance auction |
sale information provided by user #967808
Tech Specs
| Body Style | PICKUP |
| Engine | 2.3L DOHC 16-VALVE I4 ENGINE |
| Cylinders | 4 Cylinders |
| Drive | Rear Wheel Drive |
| Fuel Type | Gasoline |
Model Analytics & Market Report
We've analyzed more than 28,000 sales records of this model and here are some numbers.
The average price for new (MSRP) 2011 FORD RANGER in 2011 was $38,035.
The average price for used 2011 FORD RANGER nowadays in 2024 is $13,995 which is 37% from the original price.
Estimated mileage driven per year is 7,704 miles.
For this model we also have depreciation curve, photos, list of features and options, and other analytics.
Take a look at 2011 FORD RANGER model page in BADVIN vehicles catalog.
Depreciation
The graph below is a depreciation curve for 2011 FORD RANGER. It shows how much this model looses per year in price. This analytics is calculated using sales records from BADVIN database.
The table below shows average price for used 2011 FORD RANGER in each year since the year of manufacturing, current year price and projected price in the future years.
You can scroll the table horizontally to see all columns.
| Year | Average Mileage | Average Price | % Left | % Lost | ||
|---|---|---|---|---|---|---|
| 2011 MSRP | 0 mi | $38,035 | — | — | 100% | 0% |
| 2011 | 7,704 mi | $55,746 | −$17,711 | −46.57% | 146.57% | -46.57% |
| 2012 | 15,408 mi | $37,992 | +$17,754 | +31.85% | 99.89% | 0.11% |
| 2013 | 23,112 mi | $35,039 | +$2,953 | +7.77% | 92.12% | 7.88% |
| 2014 | 30,816 mi | $32,500 | +$2,539 | +7.25% | 85.45% | 14.55% |
| 2015 | 38,520 mi | $29,990 | +$2,510 | +7.72% | 78.85% | 21.15% |
| → Visit 2011 FORD RANGER depreciation page to see full data. | ||||||
Price vs Mileage
The graph below shows how mileage affects the price for 2011 FORD RANGER. This data was calculated using sales records from BADVIN database.
The table below shows average price for used 2011 FORD RANGER by mileage and number of sales.
You can scroll the table horizontally to see all columns.
| Mileage | Average Price | Sample Size |
|---|---|---|
| 10,000 mi | $19,997 | 15 sales |
| 15,000 mi | $21,049 | 22 sales |
| 20,000 mi | $19,986 | 44 sales |
| 25,000 mi | $19,990 | 107 sales |
| 30,000 mi | $18,995 | 131 sales |
| 35,000 mi | $18,981 | 115 sales |
| → Visit 2011 FORD RANGER depreciation page to see full data. | ||
Get FULL ACCESS to the vehicle history report and see all blurred info.
⭐ Read 206+ reviews from our customers who used BADVIN to avoid buying junk vehicles.
Testimonials from our customers
Was about to buy a used 2016 Camry but decided to get the badvin report first. Turns out the car had been in a serious crash and was declared a total loss by insurance, even tho carfax showed it as clean! Dodged a bullet on that one. ty badvin

Jessica Nguyen
verified on Trustpilot
I almost bought a used Honda but luckily checked the BadVin report first. Turned out it had a salvage title from flood damage that the seller didn't disclose. Phew, dodged a huge issue!
Emily Turner
verified on Trustpilot
I almost bought a 2019 Malibu that seemed like a great deal - low miles and price. But the badvin report showed it used to be a rental fleet vehicle, which the seller didn't disclose. Glad I found out before buying someone else's abused rental!
Benjamin Torres
verified on Trustpilot
I import used luxury cars from US auctions to resell in Russia. The vehicle history reports from badVIN are essential for avoiding problem cars. For a BMW I was bidding on, it uncovered a salvage title from flood damage that other reports missed! That alone pays for the service.
Dmitry Volkov
verified on Trustpilot
Compare to other 2011 FORD RANGER
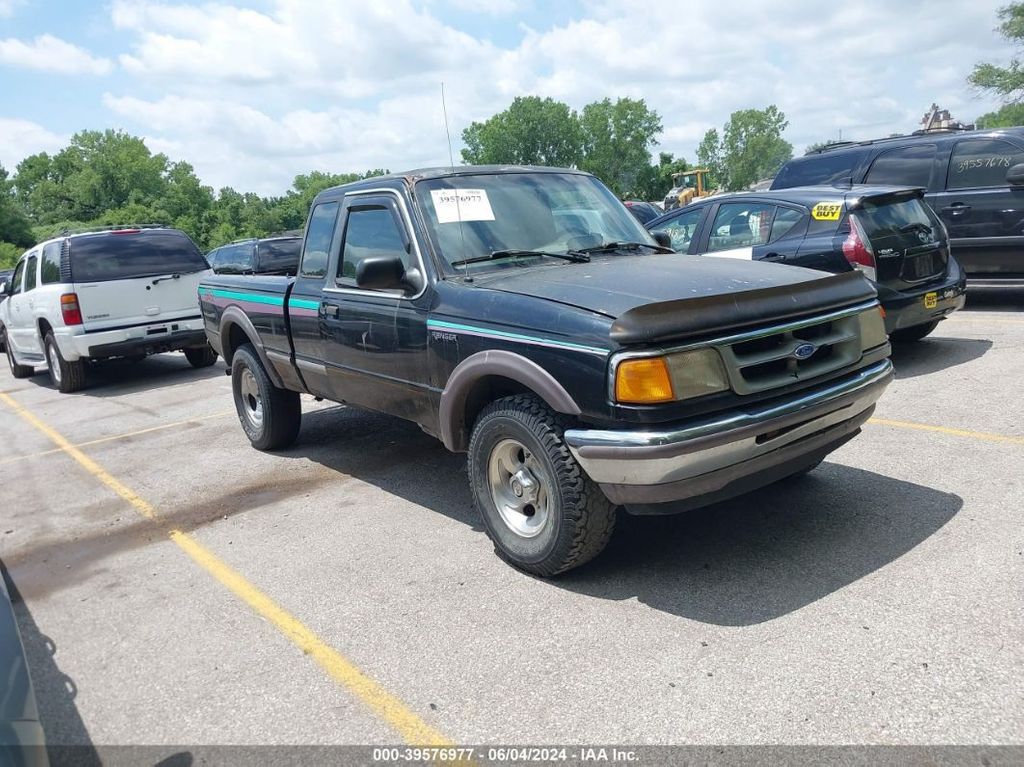
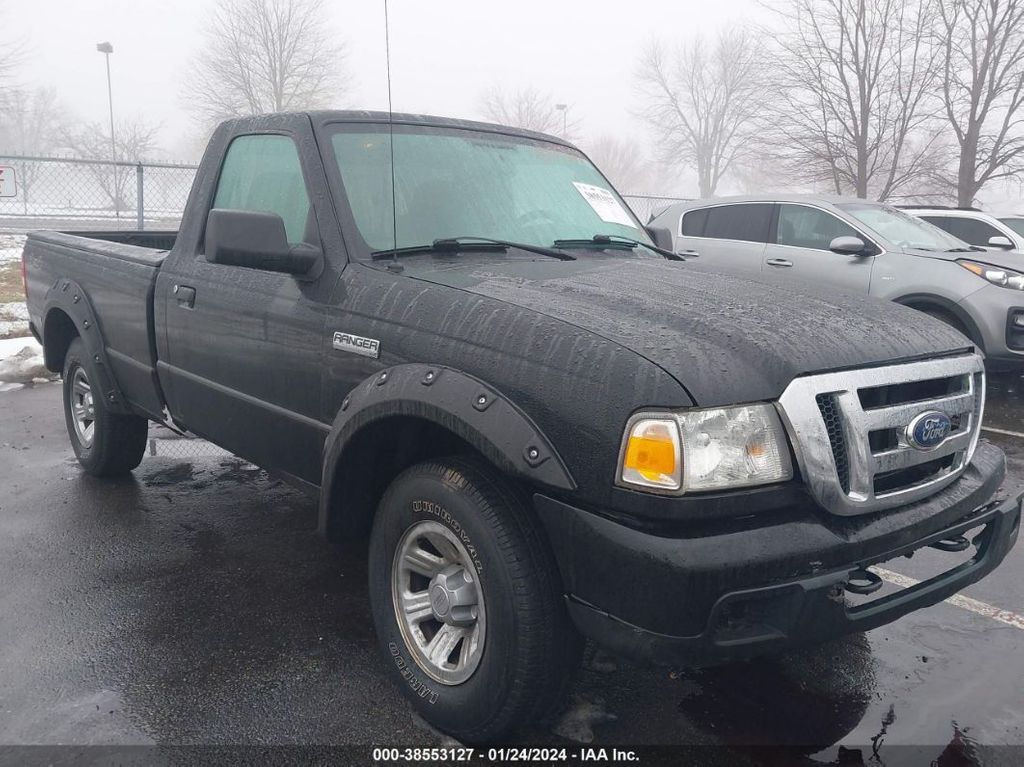
2003 FORD RANGER
2 months ago, 258,824 mi
est retail value $5,982
sold for $325
buy now price $500
VIN 1FTYR14E73PB82022
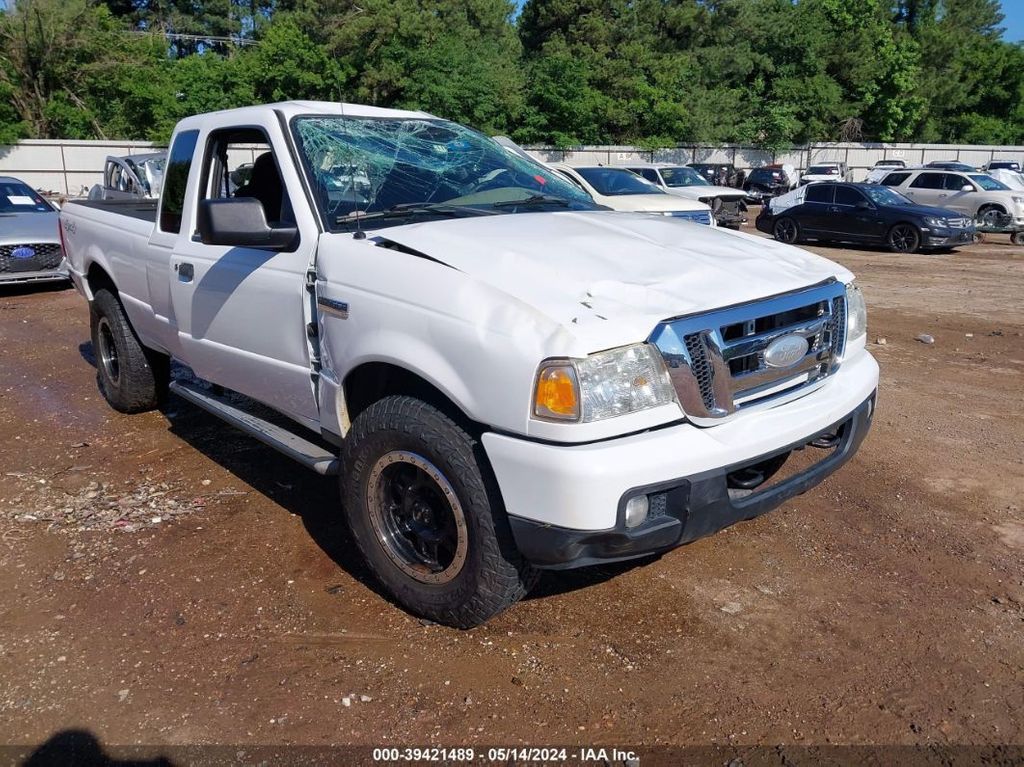
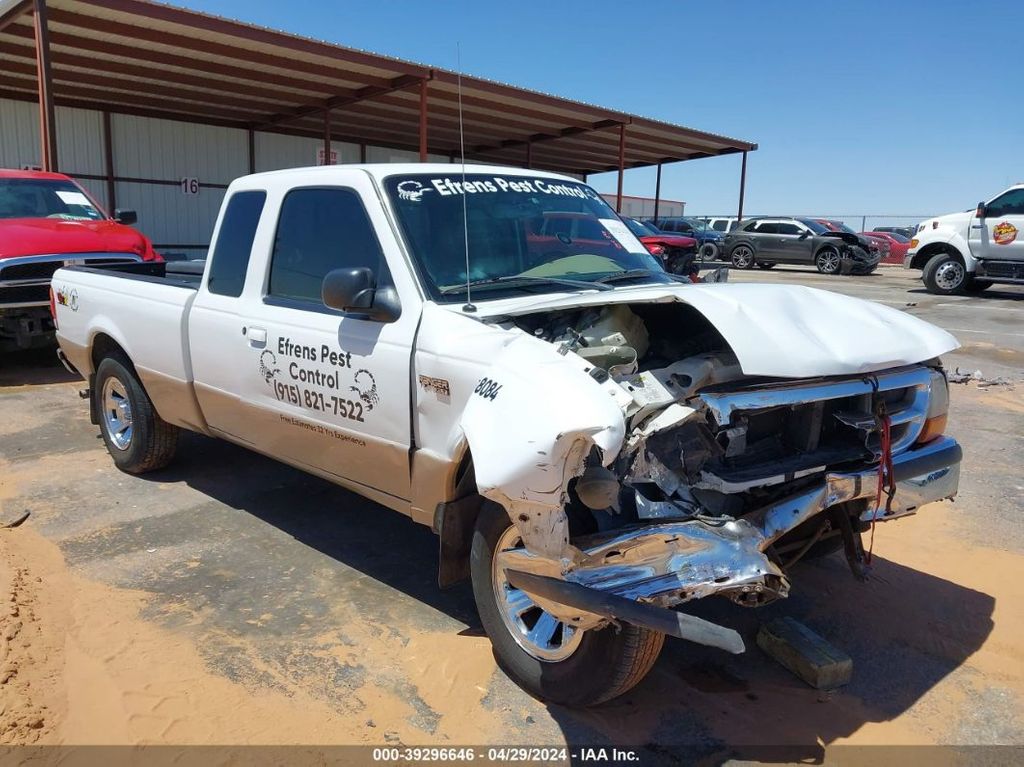
2007 FORD RANGER
2 months ago, 74,753 mi
est retail value $9,933
buy now price $2,400
VIN 1FTZR11E67PA94030
Other vehicles sales records


2022 TOYOTA TUNDRA
13 days ago, 51,422 mi
est retail value $56,232
sold for $31,075
VIN 5TFJA5DB8NX033546

Frequently asked questions
Use as a police or taxi vehicle, if noted, indicates high-intensity use which may affect the 2011 FORD vehicle's condition and lifespan, if such use is documented.
Yes, the Monroney label includes information about the vehicle’s manufacturing origin, specifying where the vehicle was assembled and the origin of its parts.
Ownership history, including the number of previous owners and how long they owned the vehicle, can indicate how well the 2011 FORD vehicle was maintained, if such records are available.
Odometer history can show the progression of mileage and might highlight discrepancies such as rollbacks, aiding in fraud detection in the 2011 FORD vehicle’s history, if accurate records are available.
Yes, in many cases, you can determine the type of drivetrain a 2011 FORD RANGER has from its VIN if the manufacturer encodes this information within the VIN.
Advanced safety features can influence the resale value and slow the depreciation of vehicles by making them more attractive to safety-conscious buyers.


