
BADVIN vehicle history report for
2011 FORD RANGERVIN: 1FTKR1AD0BPA91724
Get FULL ACCESS to the vehicle history report and see all blurred info.
⭐ Read 206+ reviews from our customers who used BADVIN to avoid buying junk vehicles.
Historical Records
events
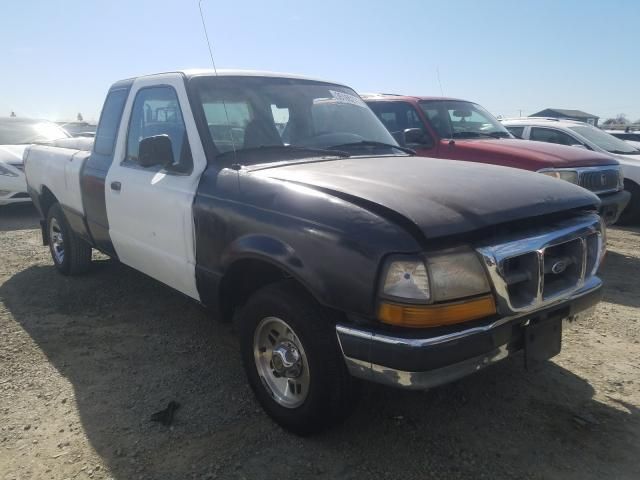
Photos
9 images
Sales History
1 records
Market report
Price analytics
Historical Records
Historical records may include service and maintenance records, title status (clean, junk, salvage), insurance records, number of owners, registration events and states, and other information.
You can find more information about historical records in BADVIN reports and see more examples here.
Available historical records for VIN 1FTKR1AD0BPA91724
Latest reported mileage: 292 mi
Below you can see some examples of what these records could look like.
2023-09-05
9 months ago
80,116 mi
TOTAL LOSS VEHICLE
Collision damage reported
Collision damage reported
2022-06-25
2 years ago
23,777 mi
Duplicate title issued
REBUILT TITLE ISSUED
REBUILT TITLE ISSUED
2020-10-27
4 years ago
32,270 mi
SALVAGE TITLE/CERTIFICATE ISSUED
Sale Record
2011 FORD RANGER
sold
| Year | 2011 |
| Title | Hidden text (Hidden text) |
| ODO | 7745 mi (Hidden text) |
| Damage | Hidden text |
| Estimated Retail Value | $3746 |
| Estimated Repair Cost | $7732 (170%) |
| Location | Mcallen, TX, 78502 |
| Date | ended 3 years ago |
| Sale Website Type | salvage or insurance auction |
| Notes | |
| Hidden text | |
sale information provided by user #412943


All photos above are REAL and display ACTUAL car. After you get the report you will see full resolution photos.
Tech Specs
| Color | WHITE |
| Transmission | AUTOMATIC |
| Engine | 2.3L 4 |
| Drive | Rear-wheel drive |
| Fuel Type | GAS |
Model Analytics & Market Report
We've analyzed more than 28,000 sales records of this model and here are some numbers.
The average price for new (MSRP) 2011 FORD RANGER in 2011 was $38,035.
The average price for used 2011 FORD RANGER nowadays in 2024 is $13,995 which is 37% from the original price.
Estimated mileage driven per year is 7,704 miles.
For this model we also have depreciation curve, photos, list of features and options, and other analytics.
Take a look at 2011 FORD RANGER model page in BADVIN vehicles catalog.
Depreciation
The graph below is a depreciation curve for 2011 FORD RANGER. It shows how much this model looses per year in price. This analytics is calculated using sales records from BADVIN database.
The table below shows average price for used 2011 FORD RANGER in each year since the year of manufacturing, current year price and projected price in the future years.
You can scroll the table horizontally to see all columns.
| Year | Average Mileage | Average Price | % Left | % Lost | ||
|---|---|---|---|---|---|---|
| 2011 MSRP | 0 mi | $38,035 | — | — | 100% | 0% |
| 2011 | 7,704 mi | $55,746 | −$17,711 | −46.57% | 146.57% | -46.57% |
| 2012 | 15,408 mi | $37,992 | +$17,754 | +31.85% | 99.89% | 0.11% |
| 2013 | 23,112 mi | $35,039 | +$2,953 | +7.77% | 92.12% | 7.88% |
| 2014 | 30,816 mi | $32,500 | +$2,539 | +7.25% | 85.45% | 14.55% |
| 2015 | 38,520 mi | $29,990 | +$2,510 | +7.72% | 78.85% | 21.15% |
| → Visit 2011 FORD RANGER depreciation page to see full data. | ||||||
Price vs Mileage
The graph below shows how mileage affects the price for 2011 FORD RANGER. This data was calculated using sales records from BADVIN database.
The table below shows average price for used 2011 FORD RANGER by mileage and number of sales.
You can scroll the table horizontally to see all columns.
| Mileage | Average Price | Sample Size |
|---|---|---|
| 10,000 mi | $19,997 | 15 sales |
| 15,000 mi | $21,049 | 22 sales |
| 20,000 mi | $19,986 | 44 sales |
| 25,000 mi | $19,990 | 107 sales |
| 30,000 mi | $18,995 | 131 sales |
| 35,000 mi | $18,981 | 115 sales |
| → Visit 2011 FORD RANGER depreciation page to see full data. | ||
Get FULL ACCESS to the vehicle history report and see all blurred info.
⭐ Read 206+ reviews from our customers who used BADVIN to avoid buying junk vehicles.
Testimonials from our customers
Bad Vin's vehicle history report showed that the 2018 Audi A4 I was about to buy had been in a major accident that was not disclosed by the seller. The severity analysis helped me avoid a bad purchase. Great service!

Sophie Dubois
verified on Trustpilot
Was shopping for a used Range Rover and found one that seemed suspiciously cheap. The badVIN report revealed it had been in a major front end collision, with photos showing the damage. Steered clear of that one and saved myself a ton of headaches!!
Ava Patel
verified on Trustpilot
I've tried a bunch of different vehicle history reports over the years and badvin.org has been the most comprehensive by far. Stuff like service records, ownership history, lien and repo info that I haven't found elsewhere. Def go-to resource when shopping for used vehicles now.
Levi Johnson
verified on Trustpilot
Report showed a car I was considering had a prior salvage title from a major accident, even though carfax listed it as clean. Messaged seller asking about it and they made shady excuses. Def avoided a scam thanks to badvin!
Mia Johnson
verified on Trustpilot
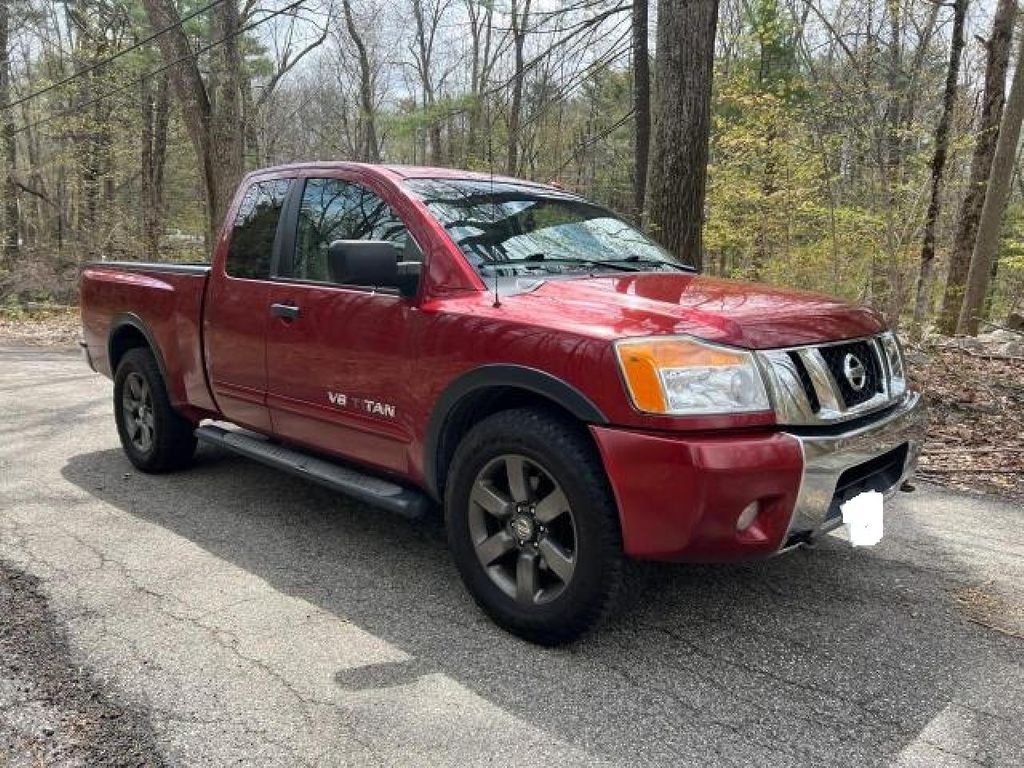
Compare to other 2011 FORD RANGER
Other vehicles sales records


2017 CHEVROLET CAMARO
in 3 days, 77,654 mi
est retail value $17,734
buy now price $6,400
VIN 1G1FB1RX2H0149797


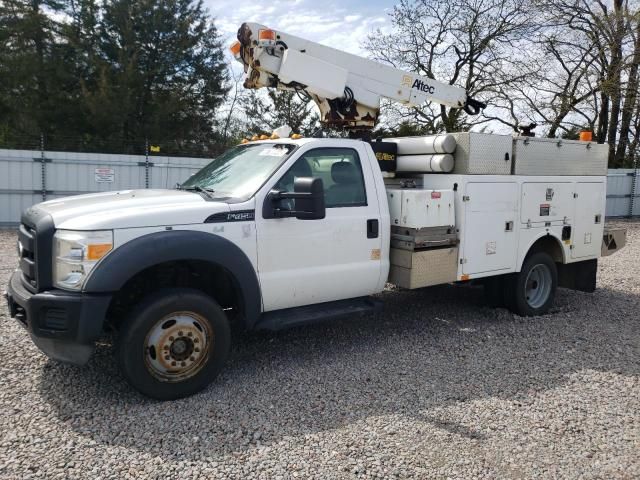
2012 FORD F450
11 days ago, 224,953 mi
est retail value $19,340
buy now price $1,600
VIN 1FDUF4HY2CED10705


Frequently asked questions
Gray market status, if noted, indicates the 2011 FORD was imported outside official channels, potentially affecting its compliance with local regulations and parts availability.
Clunker repair records, if available, detail repairs under cash-for-clunkers programs, indicating major overhauls or updates to the 2011 FORD vehicle.
Advanced safety features can influence the resale value and slow the depreciation of vehicles by making them more attractive to safety-conscious buyers.
If theft records are present, it’s crucial to ensure the vehicle has been recovered and legally cleared for sale to avoid potential legal issues, depending on the accuracy of the data.
A hazardous label, if applied, indicates significant safety risks, potentially from accidents or chemical exposure, critical for the safety evaluation of the 2011 FORD.
An insurance check can reveal past claims, typically related to accident damage, which might indicate underlying issues not apparent in a physical inspection, if such information is available.
You can educate yourself about reading and understanding window stickers by researching online resources, asking questions at dealerships, or consulting automotive buying guides that explain the elements of the label.
A Monroney label, commonly known as a window sticker, provides detailed information about a vehicle's specifications, features, and pricing when new.


