
BADVIN vehicle history report for
2014 FORD F-250VIN: 1FT7X2B69EEA30602
Get FULL ACCESS to the vehicle history report and see all blurred info.
⭐ Read 205+ reviews from our customers who used BADVIN to avoid buying junk vehicles.
Historical Records
events
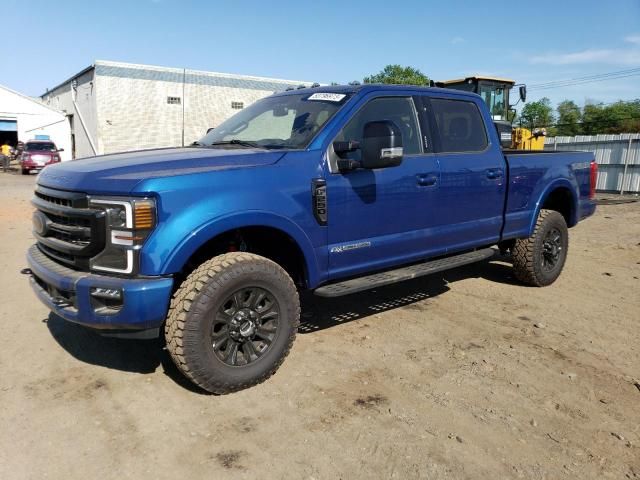
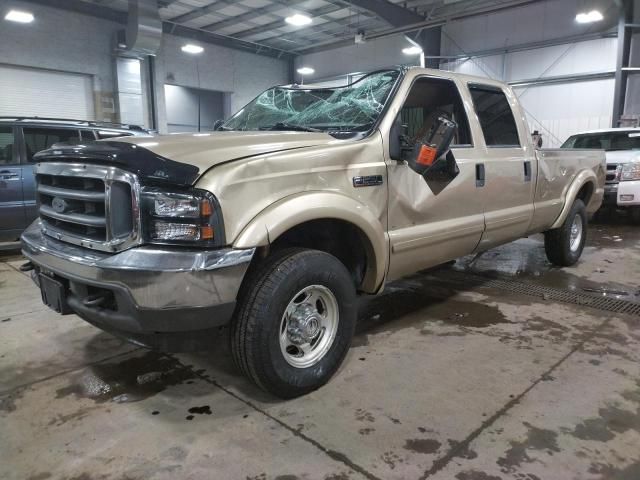
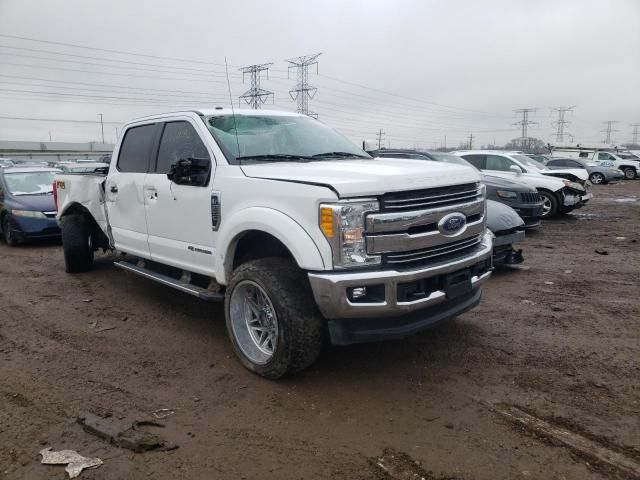
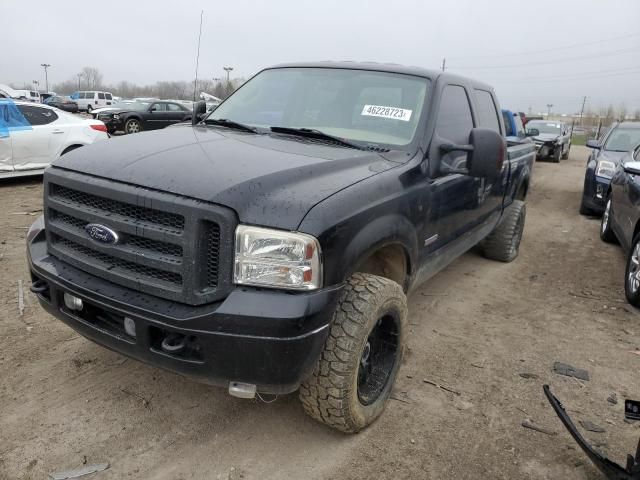
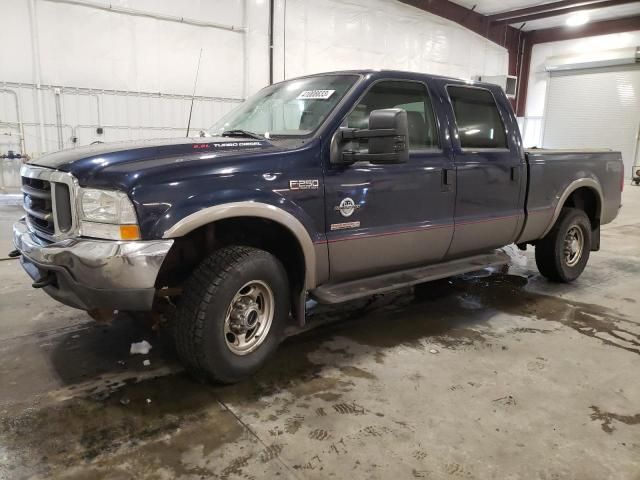
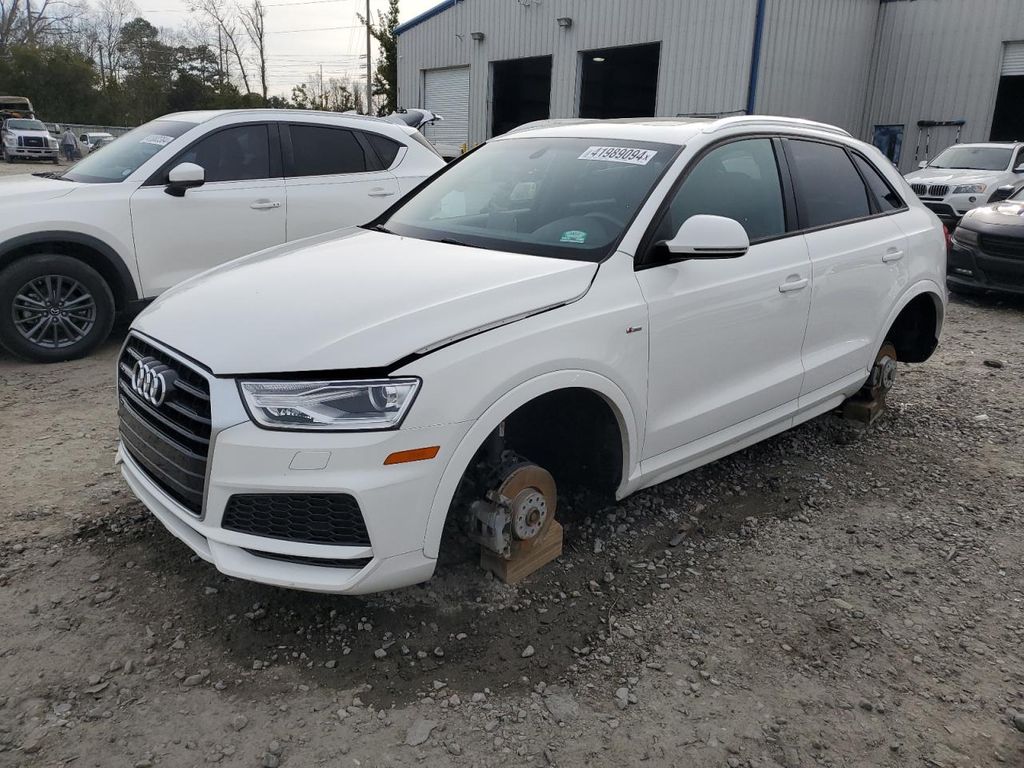
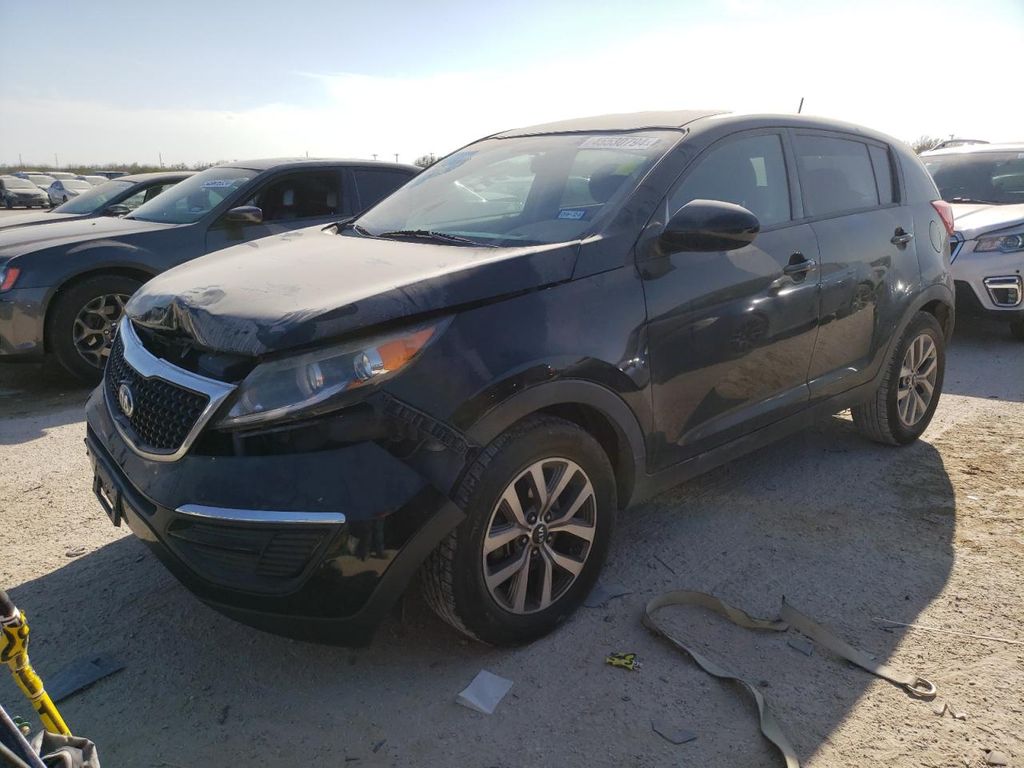
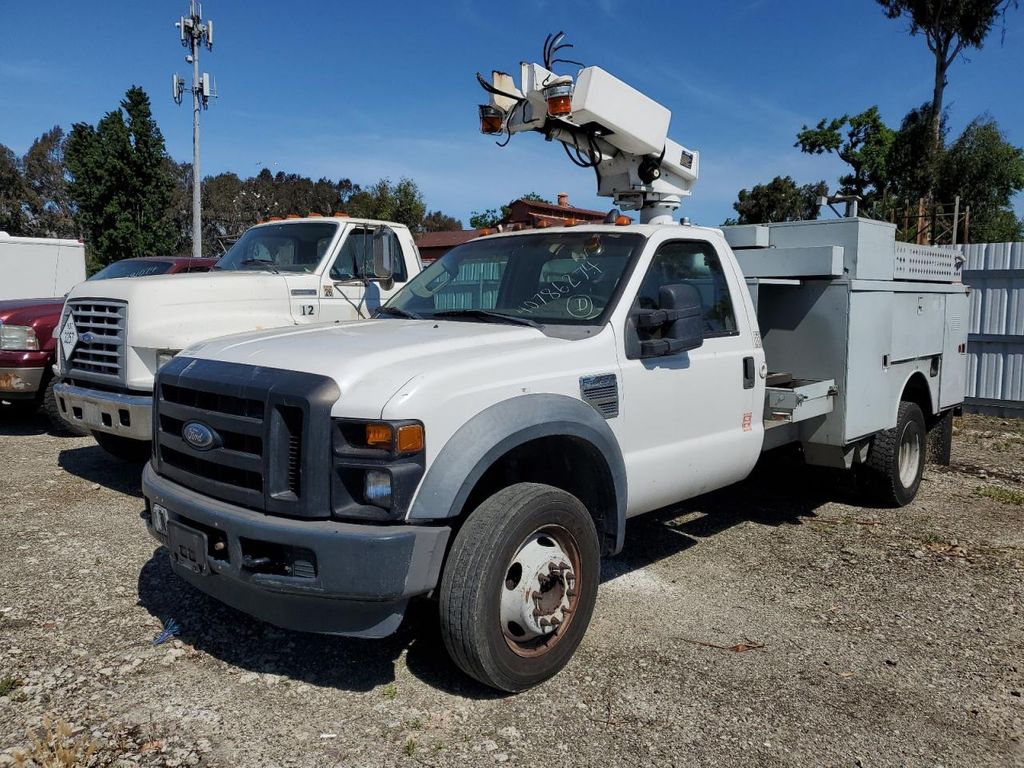
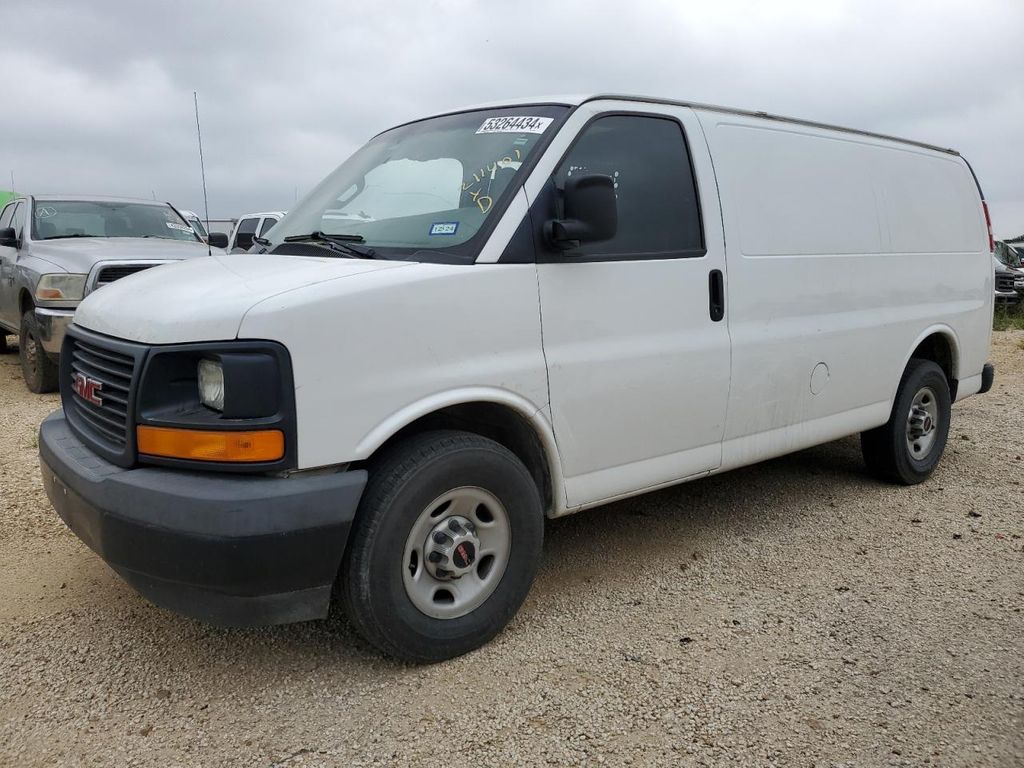
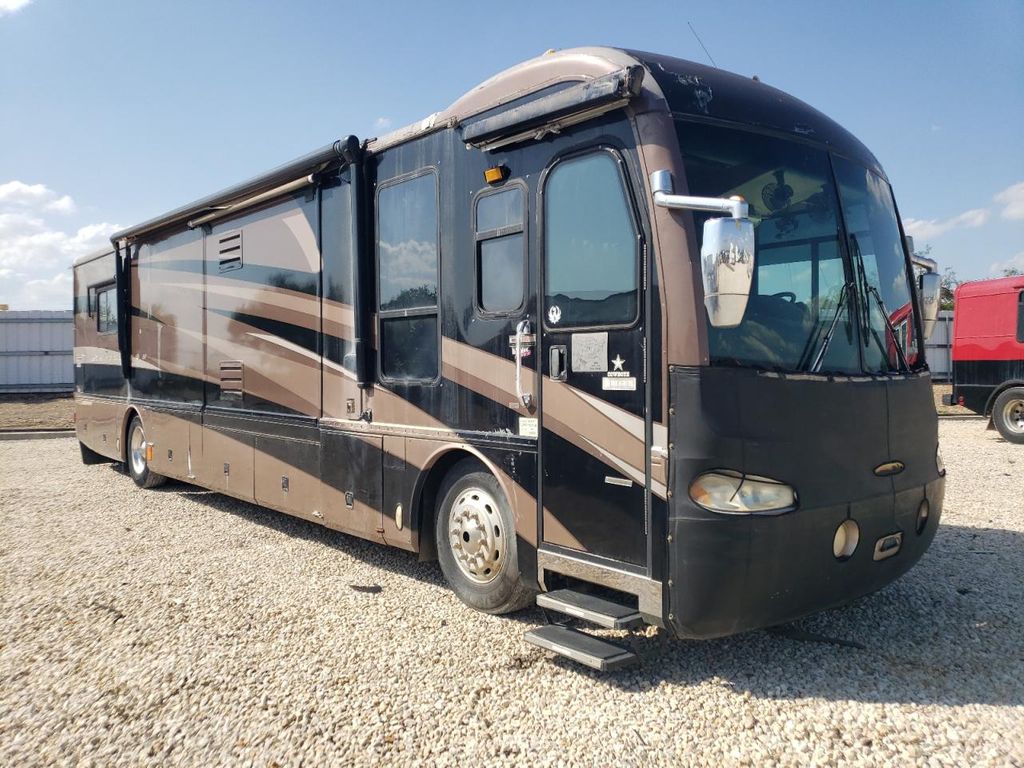
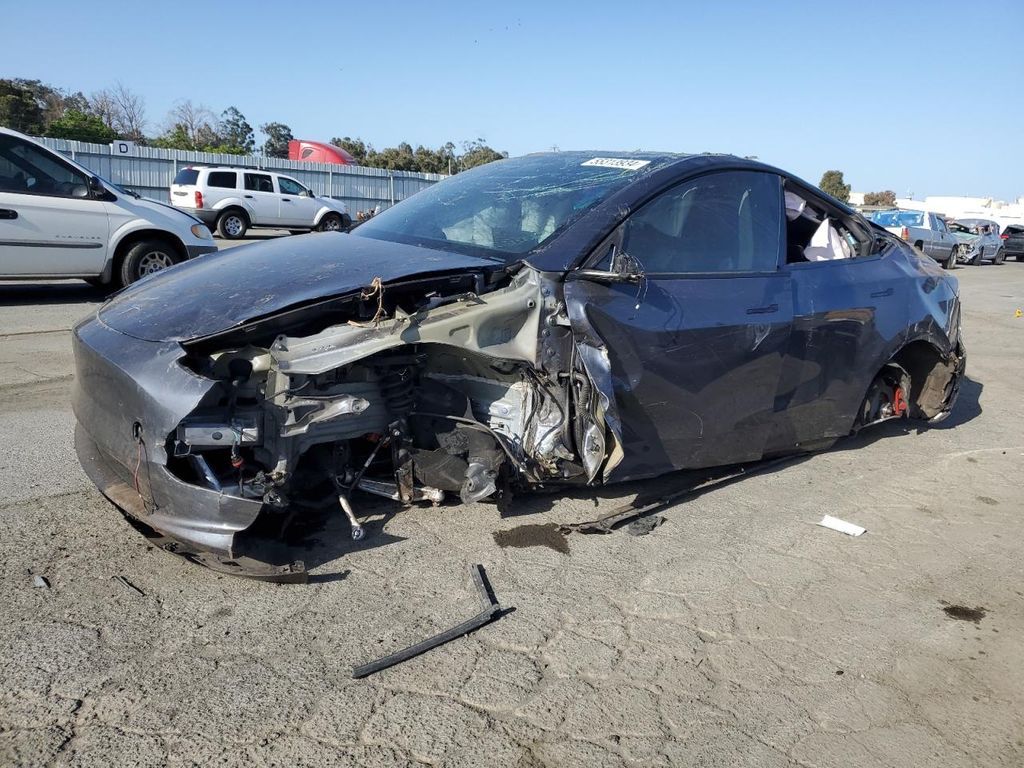
Photos
10 images
Sales History
1 records
Market report
Price analytics
Historical Records
Historical records may include service and maintenance records, title status (clean, junk, salvage), insurance records, number of owners, registration events and states, and other information.
You can find more information about historical records in BADVIN reports and see more examples here.
Available historical records for VIN 1FT7X2B69EEA30602
Latest reported mileage: 903 mi
Below you can see some examples of what these records could look like.
2022-11-29
2 years ago
112,291 mi
Accident reported: minor damage with another motor vehicle
Damage to rear
Damage to rear
2022-07-20
2 years ago
16,043 mi
Odometer reading reported
2020-10-28
4 years ago
31,378 mi
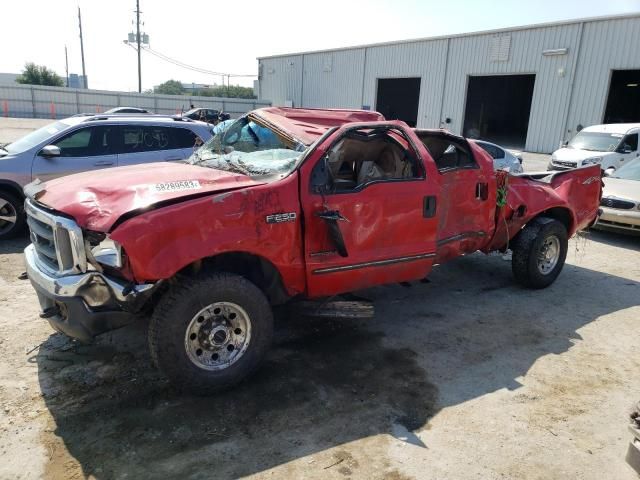
TOTAL LOSS VEHICLE
Collision damage reported
Collision damage reported
Sale Record
2014 FORD F250 SUPER DUTY
sold
| Year | 2014 |
| Title | Hidden text (Hidden text) |
| ODO | 4911 mi (Hidden text) |
| Damage | Hidden text, Hidden text |
| Estimated Retail Value | $8337 |
| Estimated Repair Cost | $6507 (200%) |
| Location | Baltimore, MD, 21215 |
| Date | ended 2 years ago |
| Sale Website Type | salvage or insurance auction |
sale information provided by user #436170


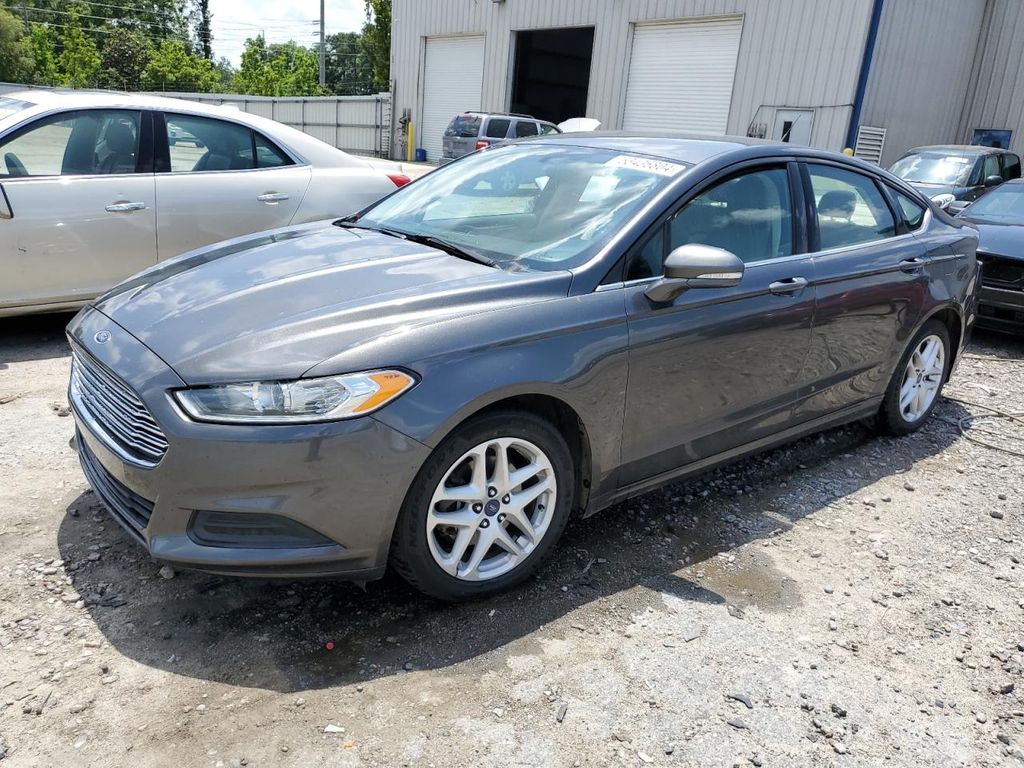
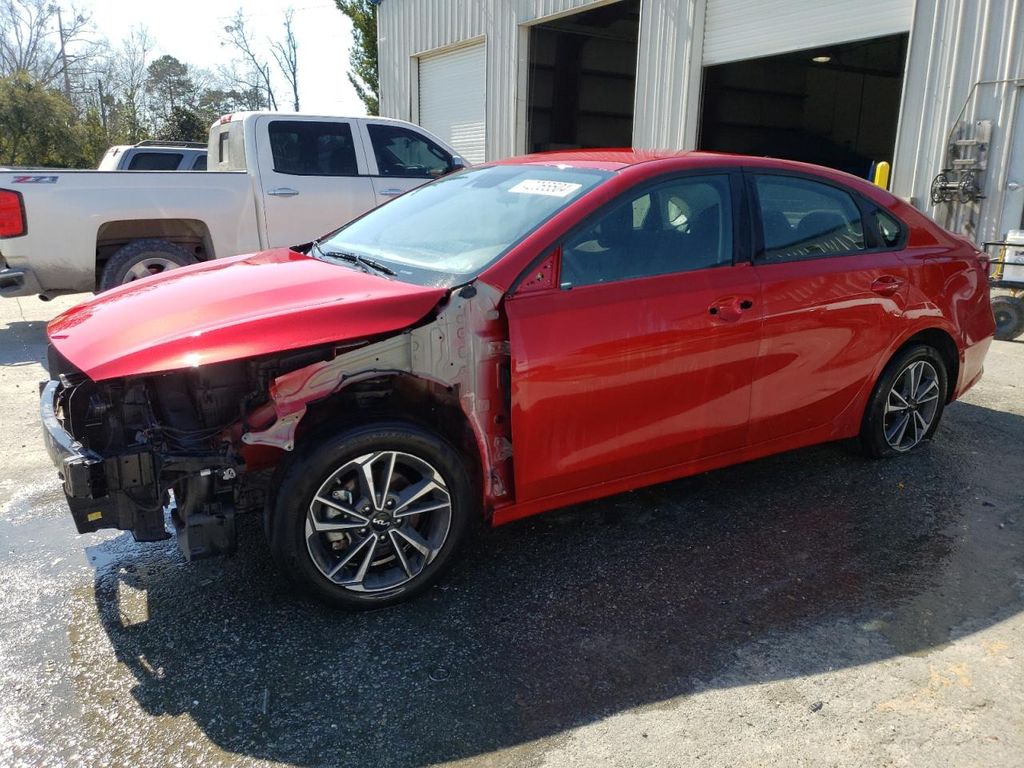
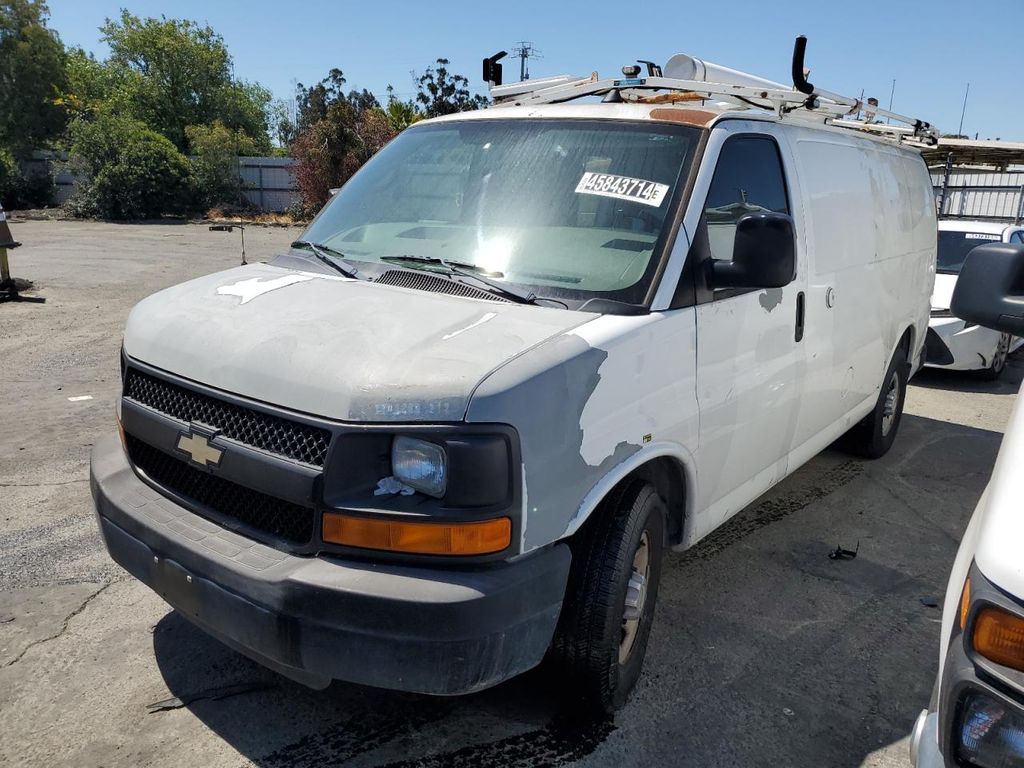
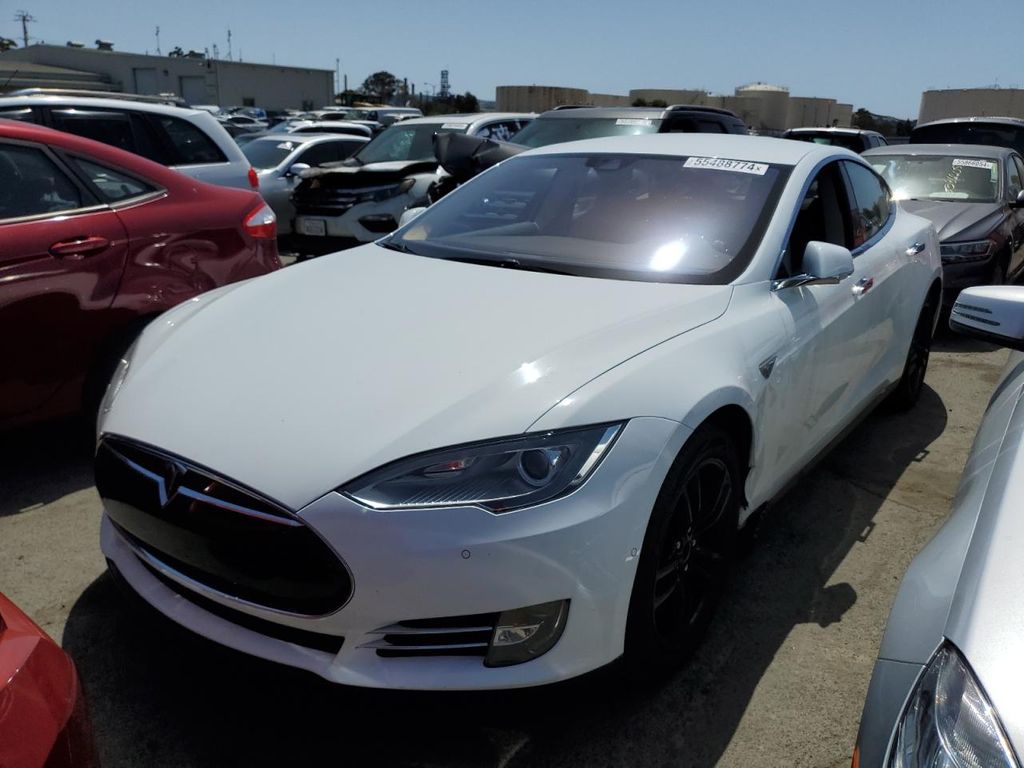
All photos above are REAL and display ACTUAL car. After you get the report you will see full resolution photos.
Tech Specs
| Color | WHITE |
| Transmission | AUTOMATIC |
| Engine | 6.2L 8 |
| Drive | 4x4 w/Rear Wheel Drv |
| Fuel Type | GAS |
Model Analytics & Market Report
We've analyzed more than 32,400 sales records of this model and here are some numbers.
The average price for new (MSRP) 2014 FORD F-250 in 2014 was $60,650.
The average price for used 2014 FORD F-250 nowadays in 2024 is $28,999 which is 48% from the original price.
Estimated mileage driven per year is 10,365 miles.
For this model we also have depreciation curve, photos, list of features and options, and other analytics.
Take a look at 2014 FORD F-250 model page in BADVIN vehicles catalog.
Depreciation
The graph below is a depreciation curve for 2014 FORD F-250. It shows how much this model looses per year in price. This analytics is calculated using sales records from BADVIN database.
The table below shows average price for used 2014 FORD F-250 in each year since the year of manufacturing, current year price and projected price in the future years.
You can scroll the table horizontally to see all columns.
| Year | Average Mileage | Average Price | % Left | % Lost | ||
|---|---|---|---|---|---|---|
| 2014 MSRP | 0 mi | $60,650 | — | — | 100% | 0% |
| 2014 | 10,365 mi | $88,472 | −$27,822 | −45.87% | 145.87% | -45.87% |
| 2015 | 20,730 mi | $77,996 | +$10,476 | +11.84% | 128.6% | -28.6% |
| 2016 | 31,095 mi | $59,657 | +$18,339 | +23.51% | 98.36% | 1.64% |
| 2017 | 41,460 mi | $55,995 | +$3,662 | +6.14% | 92.32% | 7.68% |
| 2018 | 51,825 mi | $53,747 | +$2,248 | +4.01% | 88.62% | 11.38% |
| → Visit 2014 FORD F-250 depreciation page to see full data. | ||||||
Price vs Mileage
The graph below shows how mileage affects the price for 2014 FORD F-250. This data was calculated using sales records from BADVIN database.
The table below shows average price for used 2014 FORD F-250 by mileage and number of sales.
You can scroll the table horizontally to see all columns.
| Mileage | Average Price | Sample Size |
|---|---|---|
| 10,000 mi | $31,989 | 12 sales |
| 20,000 mi | $33,980 | 33 sales |
| 25,000 mi | $31,838 | 42 sales |
| 30,000 mi | $35,989 | 39 sales |
| 35,000 mi | $36,988 | 46 sales |
| 40,000 mi | $36,438 | 66 sales |
| → Visit 2014 FORD F-250 depreciation page to see full data. | ||
Get FULL ACCESS to the vehicle history report and see all blurred info.
⭐ Read 205+ reviews from our customers who used BADVIN to avoid buying junk vehicles.
Testimonials from our customers
Purchased a badvin report before buying a used Lexus RX 350. It revealed a minor accident the seller hadn't mentioned. I still bought the car but used the info to negotiate a lower price. Well worth the cost for the leverage it gave me!

Aiden Patel
verified on Trustpilot
Was shopping for a used Range Rover and found one that seemed suspiciously cheap. The badVIN report revealed it had been in a major front end collision, with photos showing the damage. Steered clear of that one and saved myself a ton of headaches!!
Ava Patel
verified on Trustpilot
Ich hätte fast einen 2017 Mercedes-Benz C300 gekauft, bis der Bad Vin-Bericht zeigte, dass er als durch Überschwemmung beschädigt gemeldet wurde. Die detaillierten Schadensaufzeichnungen haben mich vor einem großen Fehler bewahrt!
Sophia Müller
verified on Trustpilot
BadVin's vehicle history report is a must-have before buying any used vehicle. It's saved me from a few lemons over the years - cars that looked great on the surface but had hidden issues like accidents or title problems. Well worth the price.
Camila Santos
verified on Trustpilot
Compare to other 2014 FORD F-250
2017 FORD F-250
4 days ago, 159,780 mi
est retail value $57,852
buy now price $11,200
VIN 1FT7W2BT4HEC77118

Other vehicles sales records


Frequently asked questions
The window sticker benefits car dealers by providing a standardized set of information that aids in promoting transparency and trust with customers, facilitating a smoother sales process.
A VIN decoder translates the 17-character Vehicle Identification Number into understandable information about the vehicle's specifications and history.
Yes, the Monroney label includes information about the vehicle’s manufacturing origin, specifying where the vehicle was assembled and the origin of its parts.
Test vehicle status, if reported, reveals use in trials or development, which may involve experimental features and adjustments in the 2014 FORD F-250.
To verify that a VIN has not been tampered with, check for inconsistencies in the VIN's font, alignment, and location, and compare the VIN displayed in various parts of the vehicle with that on the official documents.
If the 2014 FORD was used as a taxi, this information may be noted in the vehicle history report, including the duration and any relevant details affecting its wear and tear, if reported.
Total loss is usually determined when the cost of repairing the vehicle exceeds a certain percentage of its value before the damage occurred, as decided by the insurance company, if such data is recorded.


