
Photos
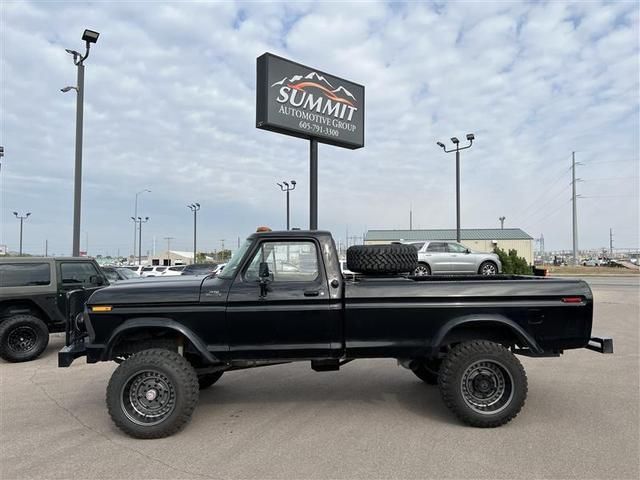
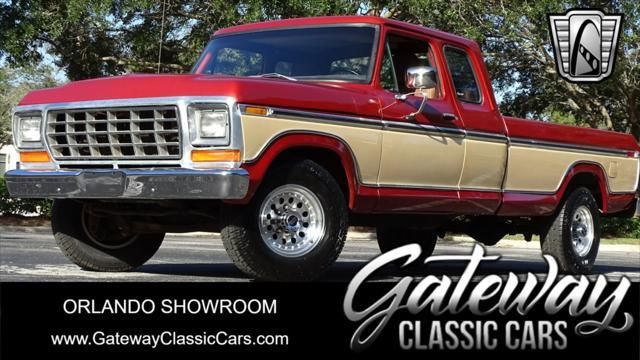
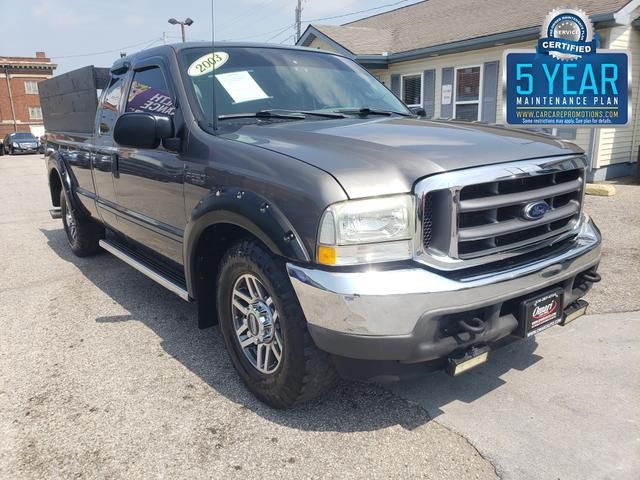
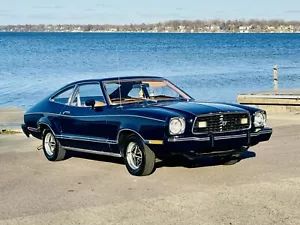
Pictures below are not fancy pictures from manufacturer catalog. It's all photos of real vehicles that were on sale on United States market. You can click on any picture to see specific vehicle and its VIN report.


The graph below is a depreciation curve for 1977 FORD F-250. It shows how much this model looses per year in price. This analytics is calculated using sales records from BADVIN database.
The table below shows average price for used 1977 FORD F-250 in each year since the year of manufacturing, current year price and projected price in the future years.
You can scroll the table horizontally to see all columns.
| Year | Average Mileage | Average Price | % Left | % Lost | ||
|---|---|---|---|---|---|---|
| 1977 MSRP | 0 mi | $60,650 | — | — | 100% | 0% |
| 1977 | 10,365 mi | $88,472 | −$27,822 | −45.87% | 145.87% | -45.87% |
| 1978 | 20,730 mi | $77,996 | +$10,476 | +11.84% | 128.6% | -28.6% |
| 1979 | 31,095 mi | $59,657 | +$18,339 | +23.51% | 98.36% | 1.64% |
| 1980 | 41,460 mi | $55,995 | +$3,662 | +6.14% | 92.32% | 7.68% |
| 1981 | 51,825 mi | $53,747 | +$2,248 | +4.01% | 88.62% | 11.38% |
| → Visit 1977 FORD F-250 depreciation page to see full data. | ||||||
The graph below shows how mileage affects the price for 1977 FORD F-250. This data was calculated using sales records from BADVIN database.
The table below shows average price for used 1977 FORD F-250 by mileage and number of sales.
You can scroll the table horizontally to see all columns.
| Mileage | Average Price | Sample Size |
|---|---|---|
| 5,000 mi | $57,900 | 41 sales |
| 10,000 mi | $12,500 | 10 sales |
| 65,000 mi | $36,995 | 15 sales |
| → Visit 1977 FORD F-250 depreciation page to see full data. | ||
Recent sales
BADVIN contain information about more than 360 sold 1977 FORD F-250 on US market. Below you may find some of recent sales with exact mileage and prices.
What's the difference between auctions and classifieds?Classifieds

93,676 mi
listed for $38,000
IL
3 months ago
VIN GCCLOU2993

128,453 mi
listed for $11,991
WA
10 months ago
VIN X25K087441
listed for $29,995
SD
a year ago
VIN F26HL070173
93,462 mi
listed for $29,000
IL
a year ago
VIN GCCORD2295

17,036 mi
listed for $55,000
IL
2 years ago
VIN GCCDEN1329

37,035 mi
listed for $11,311
MA
2 years ago
VIN X25SKY86459

20,519 mi
listed for $7,995
WA
2 years ago
VIN F25HR029239

59,413 mi
listed for $28,999
TN
2 years ago
VIN F26SZ08262

33,582 mi
listed for $19,900
MI
2 years ago
VIN F26SR021207

43,353 mi
listed for $39,999
OH
2 years ago

102,700 mi
listed for $26,900
MI
2 years ago
VIN F26SRY64653

63,346 mi
listed for $8,995
WI
2 years ago
Other years of FORD F-250

1996 FORD F-250
$17,850 average used price
2,900+ sales records
2003 FORD F-250
$11,997 average used price
10,800+ sales records

2009 FORD F-250
$16,995 average used price
10,700+ sales records

2018 FORD F-250
$44,566 average used price
66,200+ sales records

2021 FORD F-250
$55,995 average used price
82,400+ sales records

2022 FORD F-250
$59,657 average used price
66,600+ sales records
Similar Models

1977 FORD THUNDERBIRD
$19,790 MSRP
150+ sales records

1978 FORD THUNDERBIRD
$19,790 MSRP
230+ sales records
1978 FORD MUSTANG
$39,240 MSRP
160+ sales records

1978 FORD RANGER
$38,035 MSRP
110+ sales records

1978 FORD F-100
$42,495 MSRP
310+ sales records

1980 FORD F-150
$50,165 MSRP
120+ sales records
Frequently asked questions
Yes, the window sticker of a vehicle provides the EPA fuel efficiency ratings, showing expected mpg in city and highway conditions.
Repossession records, if included, indicate if the vehicle vehicle has been taken back by a lender due to payment defaults, which might affect its condition and value.
The report may include a history of odometer readings recorded during sales, services, or inspections, helping you verify the vehicle's actual mileage, if records are accessible.
Market value is generally estimated based on the vehicle vehicle’s history, condition, and comparable sales, helping to provide a guideline for buyers and sellers, though specific values can vary.
When buying a car, consider models with strong resale histories, opt for popular color and feature options, and evaluate current market trends for the best value retention.
The number of previous owners, if documented, may provide insights into how multiple ownerships might have influenced the vehicle vehicle’s condition and maintenance.
Safety Recalls
With over 1.9 million Fords sold yearly in the U.S., up to 30% may have unresolved safety recalls. A VIN check identifies any open recalls.
Accident History
Decoding the VIN reveals if a used Ford has been in accidents, flooded, or sustained other damage that could affect its safety and value.
Maintenance Records
A VIN check provides detailed maintenance records, ensuring the used Ford you buy has been properly serviced and cared for.


