
BADVIN vehicle history report for
2016 FORD F-250VIN: 1FT7W2BT6GEA06365
Get FULL ACCESS to the vehicle history report and see all blurred info.
⭐ Read 206+ reviews from our customers who used BADVIN to avoid buying junk vehicles.
Historical Records
events
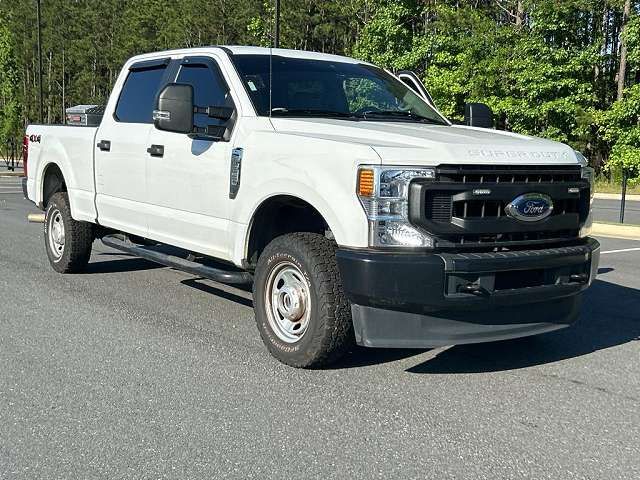
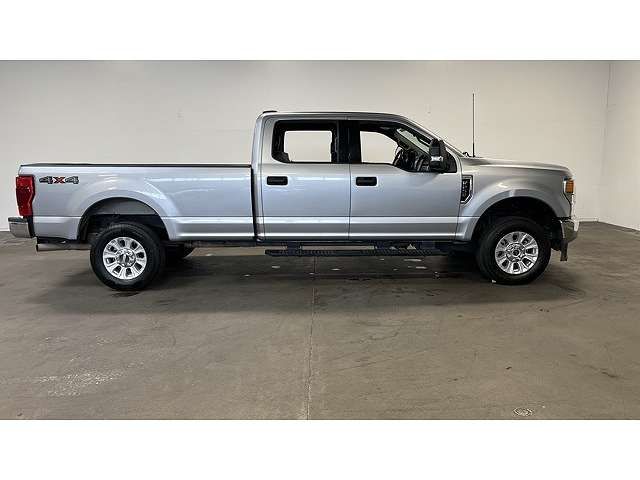
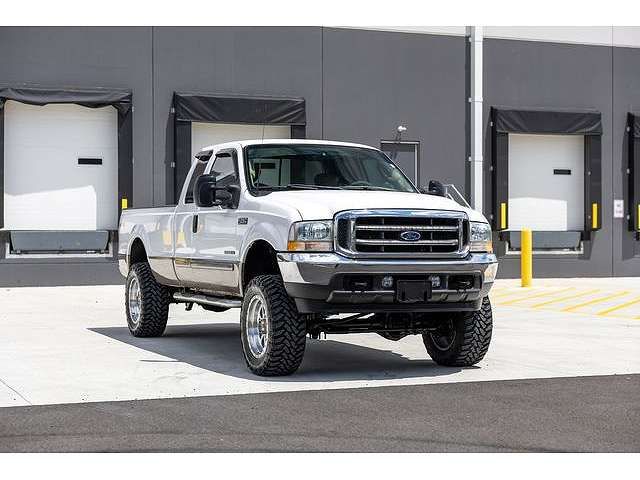
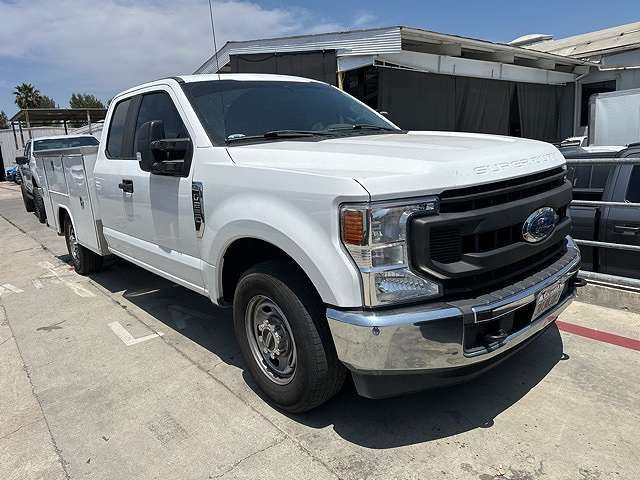
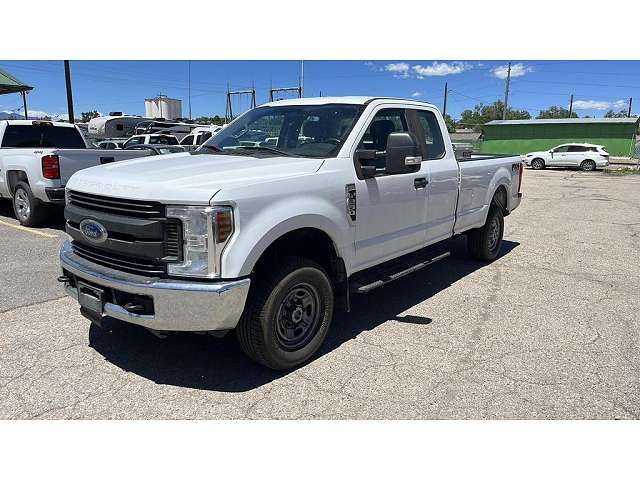
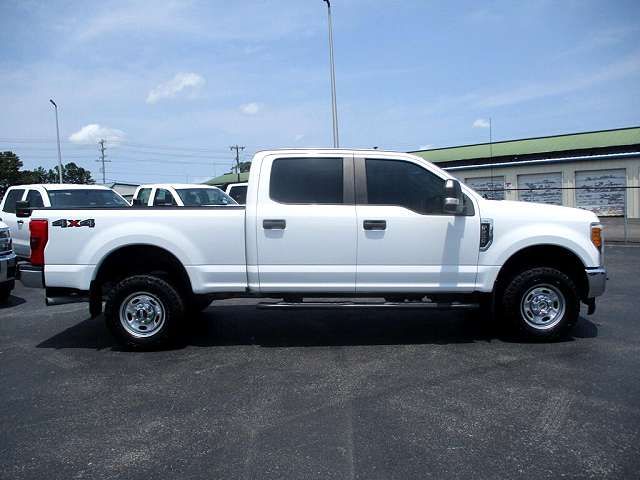
Photos
24 images
Sales History
2 records
Sale Prices
2 records
Market report
Price analytics
Historical Records
Historical records may include service and maintenance records, title status (clean, junk, salvage), insurance records, number of owners, registration events and states, and other information.
You can find more information about historical records in BADVIN reports and see more examples here.
Available historical records for VIN 1FT7W2BT6GEA06365
Latest reported mileage: 221 mi
Below you can see some examples of what these records could look like.
2022-10-15
2 years ago
86,393 mi
Accident reported: minor damage with another motor vehicle
Damage to rear
Damage to rear
2021-12-31
2 years ago
14,194 mi
TOTAL LOSS VEHICLE
Collision damage reported
Collision damage reported
2020-09-29
4 years ago
30,227 mi
Damage reported: minor to moderate damage
Damage to right rear
Damage to rear
Damage to right rear
Damage to rear
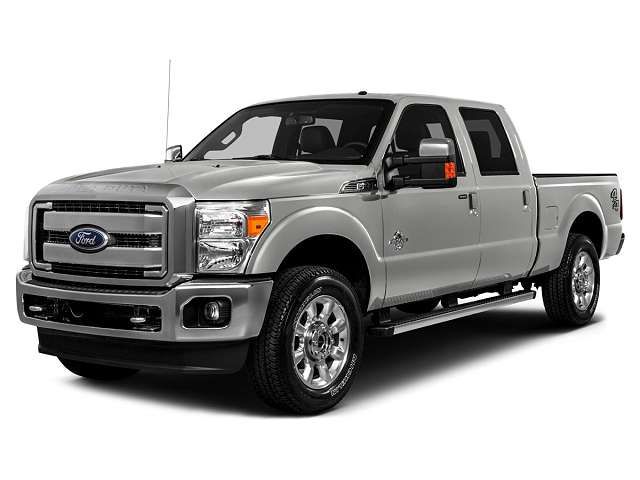
| Year | 2016 |
| ODO | 7480 mi |
| Condition | Hidden text |
| Seller | Hidden text |
| Location | Tacoma, WA, 98444 |
| Date | appeared 4 years ago latest price $7287 |
| Sale Website Type | classifieds |
sale information provided by user #227530


All photos above are REAL and display ACTUAL car. After you get the report you will see full resolution photos.
Tech Specs
| Body Style | Pickup |
| Color | Black |
| Transmission | Automatic |
| Engine | 6.7 L |
| Cylinders | 8 Cyl |
| Drive | 4WD |
| Fuel Type | Diesel |
Extra Features
- Side Airbags
Standard Features
All these features are based on a model in general. This specific vehicle may differ.
- 3-Point Seat Belts
- Hidden text
- Adjustable Steering Wheel
- Hidden text
- Anti-Lock Brakes
- Hidden text
- Engine Immobilizer
- Hidden text
- Front Airbags (Passenger)
- Hidden text
- MP3
- Hidden text
- Rear Head Airbags
- Hidden text
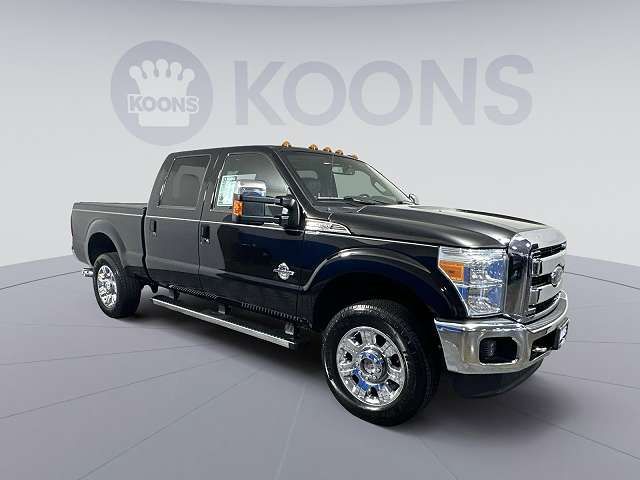
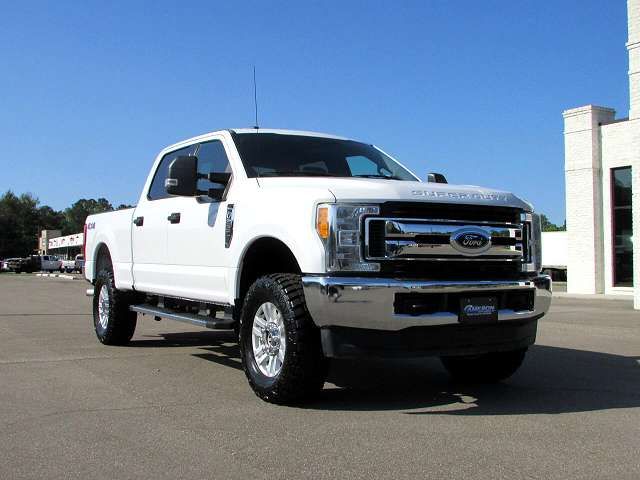
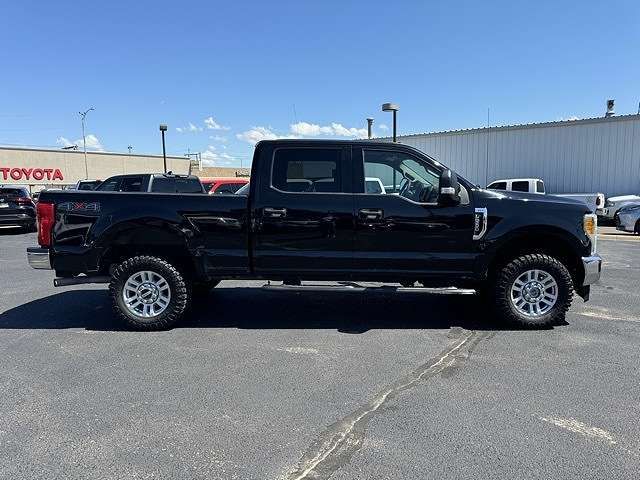
2016 Ford F250 4x4 Crew Cab Super Duty
| Year | 2016 |
| ODO | 9909 mi |
| Seller | Hidden text (Hidden text) |
| Location | Puyallup, WA, 98371 |
| Date | appeared 4 years ago latest price $9741 sale post disappeared 2020-05-19 |
| Sale Website Type | classifieds |
sale information provided by user #689235


All photos above are REAL and display ACTUAL car. After you get the report you will see full resolution photos.
Tech Specs
| Color | Black |
| Transmission | 6-Speed Automatic |
| Engine | 8-Cylinder Turbo |
| Drive | 4 wheel drive |
| Fuel Type | Diesel |
Standard Features
All these features are based on a model in general. This specific vehicle may differ.
- Air Conditioning
- 9525
- All Wheel ABS
- Hidden text
- AM/FM
- Hidden text
- Power Steering
- Hidden text
- Crew Cab
- Hidden text
- AM/FM Cd/Mp3
- Hidden text
- Regular Bed
- Hidden text
- Satellite
- Hidden text
- Tilt wheel
Model Analytics & Market Report
We've analyzed more than 73,300 sales records of this model and here are some numbers.
The average price for new (MSRP) 2016 FORD F-250 in 2016 was $60,650.
The average price for used 2016 FORD F-250 nowadays in 2024 is $34,712 which is 57% from the original price.
Estimated mileage driven per year is 10,365 miles.
For this model we also have depreciation curve, photos, list of features and options, and other analytics.
Take a look at 2016 FORD F-250 model page in BADVIN vehicles catalog.
Depreciation
The graph below is a depreciation curve for 2016 FORD F-250. It shows how much this model looses per year in price. This analytics is calculated using sales records from BADVIN database.
The table below shows average price for used 2016 FORD F-250 in each year since the year of manufacturing, current year price and projected price in the future years.
You can scroll the table horizontally to see all columns.
| Year | Average Mileage | Average Price | % Left | % Lost | ||
|---|---|---|---|---|---|---|
| 2016 MSRP | 0 mi | $60,650 | — | — | 100% | 0% |
| 2016 | 10,365 mi | $88,472 | −$27,822 | −45.87% | 145.87% | -45.87% |
| 2017 | 20,730 mi | $77,996 | +$10,476 | +11.84% | 128.6% | -28.6% |
| 2018 | 31,095 mi | $59,657 | +$18,339 | +23.51% | 98.36% | 1.64% |
| 2019 | 41,460 mi | $55,995 | +$3,662 | +6.14% | 92.32% | 7.68% |
| 2020 | 51,825 mi | $53,747 | +$2,248 | +4.01% | 88.62% | 11.38% |
| → Visit 2016 FORD F-250 depreciation page to see full data. | ||||||
Price vs Mileage
The graph below shows how mileage affects the price for 2016 FORD F-250. This data was calculated using sales records from BADVIN database.
The table below shows average price for used 2016 FORD F-250 by mileage and number of sales.
You can scroll the table horizontally to see all columns.
| Mileage | Average Price | Sample Size |
|---|---|---|
| 10,000 mi | $32,900 | 10 sales |
| 15,000 mi | $35,900 | 30 sales |
| 20,000 mi | $33,997 | 34 sales |
| 25,000 mi | $38,248 | 46 sales |
| 30,000 mi | $37,299 | 40 sales |
| 35,000 mi | $34,136 | 52 sales |
| → Visit 2016 FORD F-250 depreciation page to see full data. | ||
Get FULL ACCESS to the vehicle history report and see all blurred info.
⭐ Read 206+ reviews from our customers who used BADVIN to avoid buying junk vehicles.
Testimonials from our customers
I almost bought a 2019 Malibu that seemed like a great deal - low miles and price. But the badvin report showed it used to be a rental fleet vehicle, which the seller didn't disclose. Glad I found out before buying someone else's abused rental!

Benjamin Torres
verified on Trustpilot
As a first time used car buyer, I was nervous about getting ripped off. The vehicle report from badvin gave me so much more confidence - it confirmed the car had a clean history and the mileage lined up. Such a relief to have that peace of mind.
Chloe Martin
verified on Trustpilot
Bad Vin's vehicle history report showed that the 2018 Audi A4 I was about to buy had been in a major accident that was not disclosed by the seller. The severity analysis helped me avoid a bad purchase. Great service!
Sophie Dubois
verified on Trustpilot
I buy rebuilt title cars at copart to fix and resell. was hoping BadVin reports wud have more detail on damage history to help me value cars before bidding, Carfax is better for that. but for clean title vehicles it seems pretty useful
Fatima
verified on Trustpilot
Compare to other 2016 FORD F-250


Other vehicles sales records


Frequently asked questions
Crashed status, if reported, details past accidents and collisions, essential for evaluating the operational history and current state of the 2016 FORD.
The manufacturing location can be interpreted from the first character of the VIN, which indicates the country of assembly, and sometimes more specific location details are included in the first few characters.
Accident reports might detail the occurrence, damage severity, and repairs, offering insights into the operational history of the 2016 FORD, if such data is documented.
Documentation, if available, includes details of theft and vandalism incidents, showing the extent of damage and any recovery actions taken for the 2016 FORD vehicle.
The number of previous owners, if documented, may provide insights into how multiple ownerships might have influenced the 2016 FORD vehicle’s condition and maintenance.
Depreciation, which reflects the decline in a 2016 FORD vehicle's value over time due to factors like age, mileage, and condition, may directly impact its resale value, based on recorded information.
Economic downturns can lead to decreased demand and lower resale values for vehicles, as buyers may defer purchasing vehicles or opt for less expensive alternatives.


