
BADVIN vehicle history report for
2015 FORD F-250VIN: 1FT7W2B66FEA18248
Get FULL ACCESS to the vehicle history report and see all blurred info.
⭐ Read 205+ reviews from our customers who used BADVIN to avoid buying junk vehicles.
Historical Records
43 events
Market report
Price analytics
Historical Records
Historical records may include service and maintenance records, title status (clean, junk, salvage), insurance records, number of owners, registration events and states, and other information.
You can find more information about historical records in BADVIN reports and see more examples here.
Available 43 historical records for VIN 1FT7W2B66FEA18248
Latest reported mileage: 626 mi
Below you can see some examples of what these records could look like.
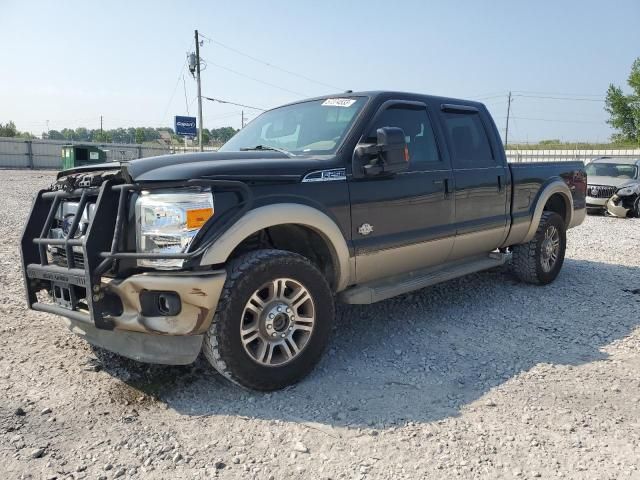
2023-02-07
a year ago
45,294 mi
TOTAL LOSS VEHICLE
Vehicle declared a total loss by an insurance company
Collision damage reported
Vehicle declared a total loss by an insurance company
Collision damage reported
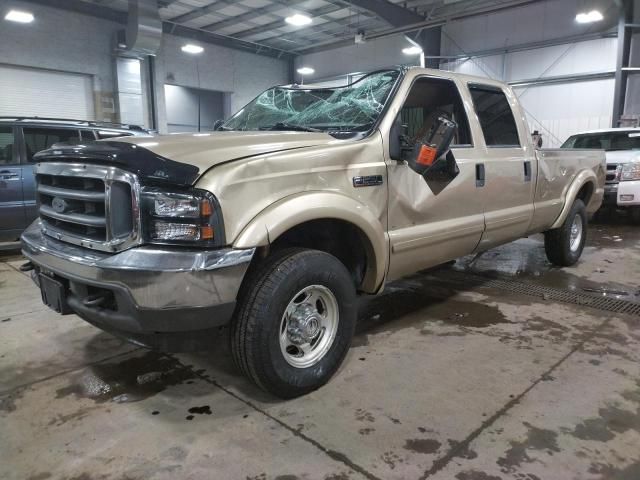
2021-09-24
3 years ago
15,990 mi
TOTAL LOSS VEHICLE
Collision damage reported
Collision damage reported
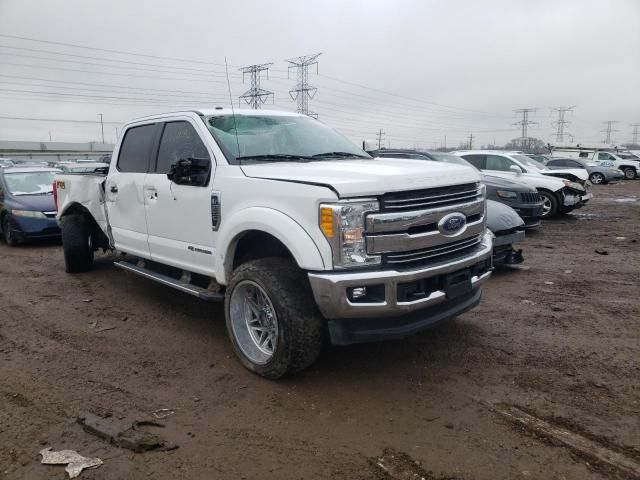
2020-12-26
3 years ago
27,860 mi
Fire damage reported: minor damage
Vandalism damage reported
Damage to front
Vandalism damage reported
Damage to front
Model Analytics & Market Report
We've analyzed more than 67,200 sales records of this model and here are some numbers.
The average price for new (MSRP) 2015 FORD F-250 in 2015 was $60,650.
The average price for used 2015 FORD F-250 nowadays in 2024 is $31,416 which is 52% from the original price.
Estimated mileage driven per year is 10,365 miles.
For this model we also have depreciation curve, photos, list of features and options, and other analytics.
Take a look at 2015 FORD F-250 model page in BADVIN vehicles catalog.
Depreciation
The graph below is a depreciation curve for 2015 FORD F-250. It shows how much this model looses per year in price. This analytics is calculated using sales records from BADVIN database.
The table below shows average price for used 2015 FORD F-250 in each year since the year of manufacturing, current year price and projected price in the future years.
You can scroll the table horizontally to see all columns.
| Year | Average Mileage | Average Price | % Left | % Lost | ||
|---|---|---|---|---|---|---|
| 2015 MSRP | 0 mi | $60,650 | — | — | 100% | 0% |
| 2015 | 10,365 mi | $88,472 | −$27,822 | −45.87% | 145.87% | -45.87% |
| 2016 | 20,730 mi | $77,996 | +$10,476 | +11.84% | 128.6% | -28.6% |
| 2017 | 31,095 mi | $59,657 | +$18,339 | +23.51% | 98.36% | 1.64% |
| 2018 | 41,460 mi | $55,995 | +$3,662 | +6.14% | 92.32% | 7.68% |
| 2019 | 51,825 mi | $53,747 | +$2,248 | +4.01% | 88.62% | 11.38% |
| → Visit 2015 FORD F-250 depreciation page to see full data. | ||||||
Price vs Mileage
The graph below shows how mileage affects the price for 2015 FORD F-250. This data was calculated using sales records from BADVIN database.
The table below shows average price for used 2015 FORD F-250 by mileage and number of sales.
You can scroll the table horizontally to see all columns.
| Mileage | Average Price | Sample Size |
|---|---|---|
| 10,000 mi | $32,998 | 23 sales |
| 15,000 mi | $29,995 | 23 sales |
| 20,000 mi | $36,500 | 35 sales |
| 25,000 mi | $32,995 | 75 sales |
| 30,000 mi | $33,910 | 65 sales |
| 35,000 mi | $36,322 | 67 sales |
| → Visit 2015 FORD F-250 depreciation page to see full data. | ||
Testimonials from our customers
Report showed a car I was considering had a prior salvage title from a major accident, even though carfax listed it as clean. Messaged seller asking about it and they made shady excuses. Def avoided a scam thanks to badvin!

Mia Johnson
verified on Trustpilot
Was about to buy a used 2016 Camry but decided to get the badvin report first. Turns out the car had been in a serious crash and was declared a total loss by insurance, even tho carfax showed it as clean! Dodged a bullet on that one. ty badvin
Jessica Nguyen
verified on Trustpilot
Ich hätte fast einen 2017 Mercedes-Benz C300 gekauft, bis der Bad Vin-Bericht zeigte, dass er als durch Überschwemmung beschädigt gemeldet wurde. Die detaillierten Schadensaufzeichnungen haben mich vor einem großen Fehler bewahrt!
Sophia Müller
verified on Trustpilot
After a bad experience buying a used car that turned out to have major issues, I now use Bad VIN to thoroughly check every vehicle i consider. It costs a bit more than other services but the detailed records and photos of past sales are wotrh it for the added peace of mind.
Olivia Johnson
verified on Trustpilot
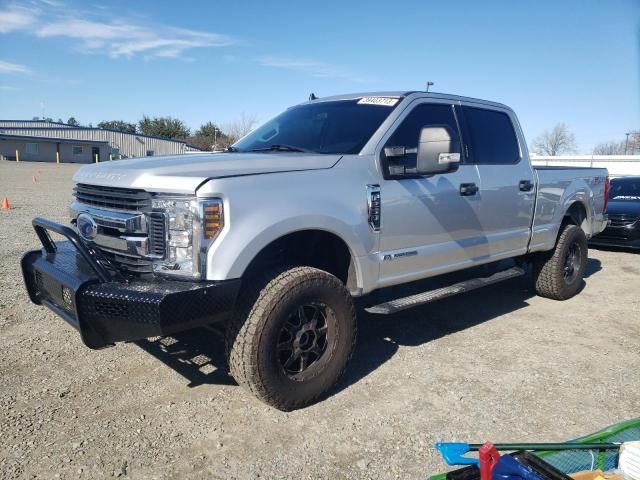
Compare to other 2015 FORD F-250
2017 FORD F-250
5 days ago, 159,780 mi
est retail value $57,852
buy now price $11,200
VIN 1FT7W2BT4HEC77118

Other vehicles sales records


2013 HYUNDAI SONATA
3 days ago, 115,677 mi
est retail value $6,980
buy now price $1,200
VIN 5NPEB4AC5DH514063

2012 FORD F450
in 2 days, 224,953 mi
est retail value $19,340
buy now price $1,600
VIN 1FDUF4HY2CED10705

Frequently asked questions
Our reports may include photos from previous sales, offering a visual history that helps assess the 2015 FORD vehicle’s condition over time, if such photos are available.
Regulatory changes can affect what is included on future Monroney labels, particularly as governments implement new requirements for transparency in vehicle pricing, fuel efficiency, and safety.
Repossession records, if included, indicate if the 2015 FORD vehicle has been taken back by a lender due to payment defaults, which might affect its condition and value.
Leasing history, if included, may detail the duration and terms under which the 2015 FORD F-250 was leased, which can influence its maintenance and condition, depending on the data provided.
Mileage is considered a major factor in the depreciation of vehicles because it directly correlates with the amount of use and potential wear and tear the vehicle has undergone.
To minimize depreciation costs, consider purchasing a model known for retaining its value or opting for a slightly used vehicle that has already undergone initial depreciation.
Most VIN decoders do not provide color information as this is not typically encoded in the VIN; color information is usually obtained from vehicle registration documents or manufacturer records.


