
BADVIN vehicle history report for
2019 FORD F-250VIN: 1FT7W2A68KEC51110
Get FULL ACCESS to the vehicle history report and see all blurred info.
⭐ Read 206+ reviews from our customers who used BADVIN to avoid buying junk vehicles.
Historical Records
events
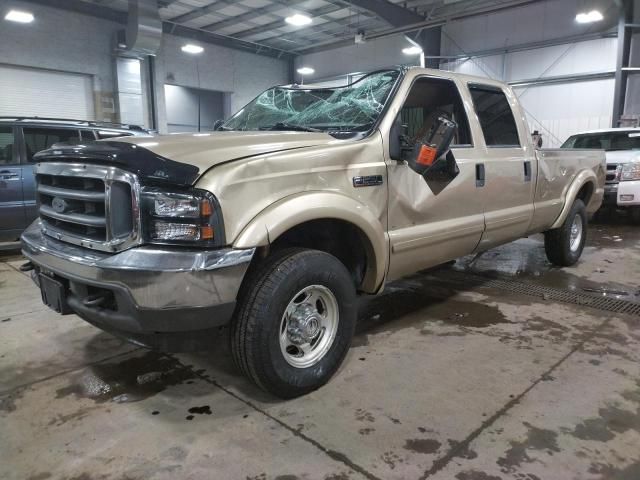
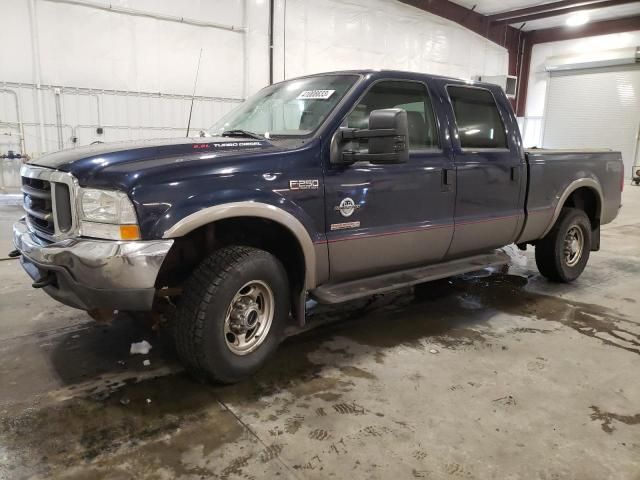
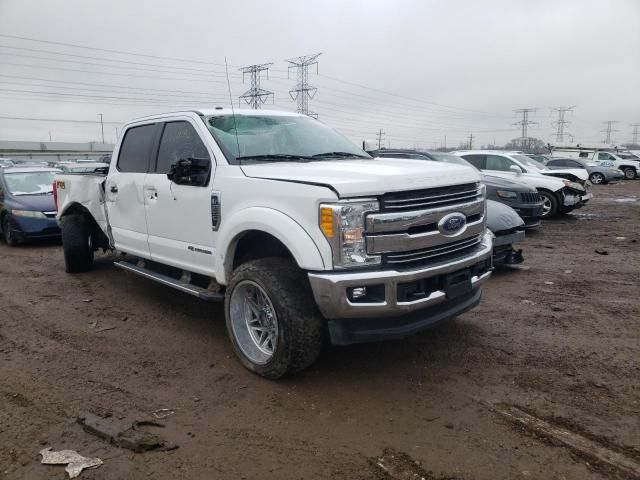
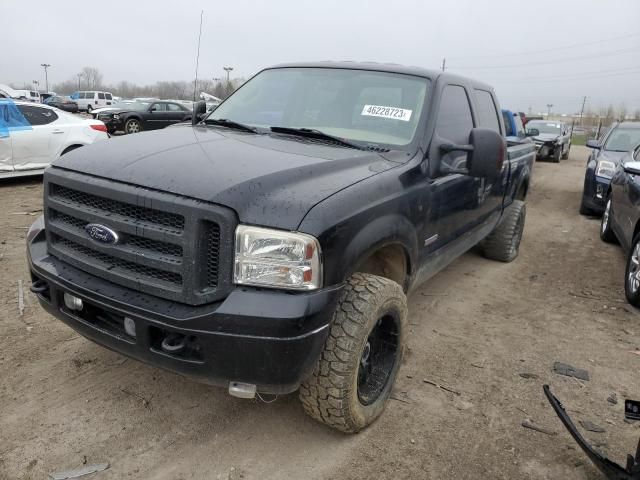
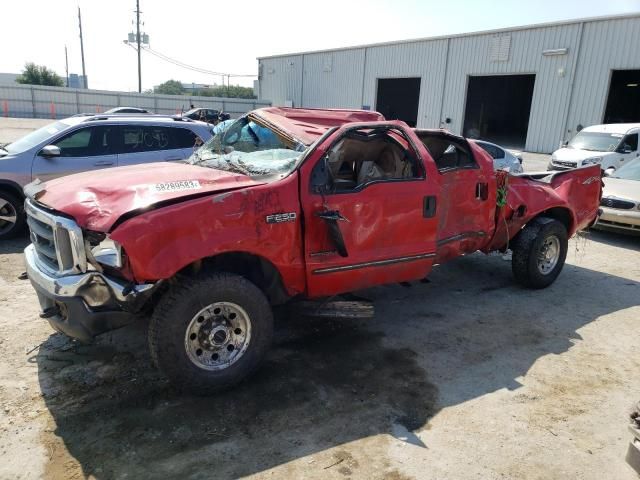
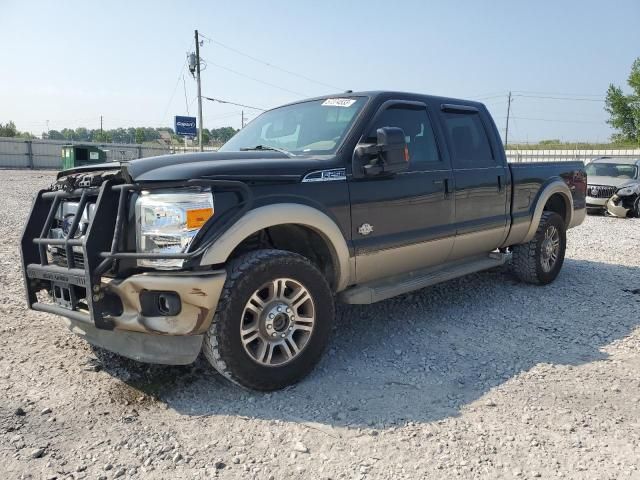
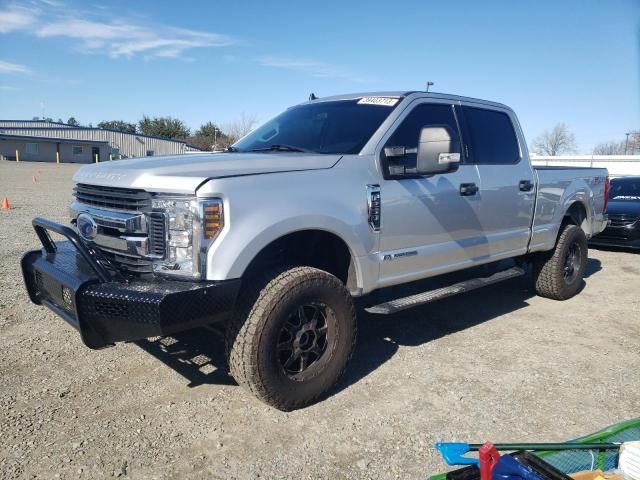
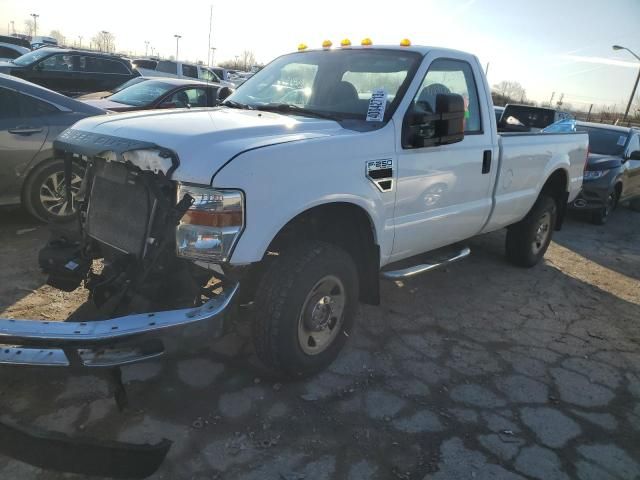
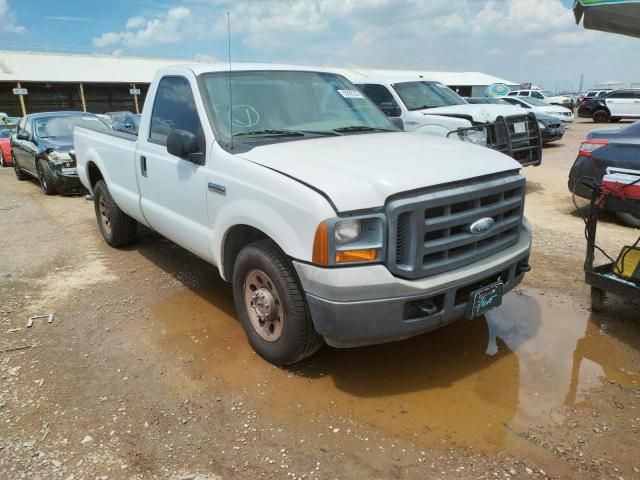
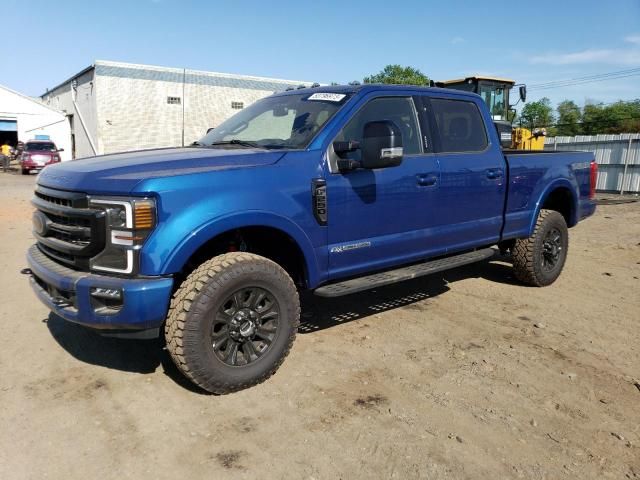
Photos
9 images
Sales History
1 records
Sale Prices
1 records
Market report
Price analytics
Historical Records
Historical records may include service and maintenance records, title status (clean, junk, salvage), insurance records, number of owners, registration events and states, and other information.
You can find more information about historical records in BADVIN reports and see more examples here.
Available historical records for VIN 1FT7W2A68KEC51110
Latest reported mileage: 575 mi
Below you can see some examples of what these records could look like.
2022-08-20
2 years ago
142,367 mi
SALVAGE TITLE/CERTIFICATE ISSUED
2021-10-13
3 years ago
20,014 mi
TOTAL LOSS VEHICLE
Vehicle declared a total loss by an insurance company
Collision damage reported
Vehicle declared a total loss by an insurance company
Collision damage reported
2021-04-06
3 years ago
37,310 mi
Vehicle sold
MILEAGE INCONSISTENCY
MILEAGE INCONSISTENCY
2019 FORD F250 SUPER DUTY
sold
| Year | 2019 |
| Title | Hidden text (Hidden text) |
| ODO | 4324 mi (Hidden text) |
| Damage | Hidden text |
| Estimated Retail Value | $2665 |
| Estimated Repair Cost | $6154 (827%) |
| Seller | Hidden text |
| Location | Las Vegas, NV, 89121 |
| Date | ended 3 years ago |
| Sale Website Type | salvage or insurance auction |
sale information provided by user #88143


All photos above are REAL and display ACTUAL car. After you get the report you will see full resolution photos.
Tech Specs
| Color | WHITE |
| Transmission | AUTOMATIC |
| Engine | 6.2L 8 |
| Drive | Rear-wheel drive |
| Fuel Type | GAS |
Model Analytics & Market Report
We've analyzed more than 186,800 sales records of this model and here are some numbers.
The average price for new (MSRP) 2019 FORD F-250 in 2019 was $60,650.
The average price for used 2019 FORD F-250 nowadays in 2024 is $47,759 which is 79% from the original price.
Estimated mileage driven per year is 10,365 miles.
For this model we also have depreciation curve, photos, list of features and options, and other analytics.
Take a look at 2019 FORD F-250 model page in BADVIN vehicles catalog.
Depreciation
The graph below is a depreciation curve for 2019 FORD F-250. It shows how much this model looses per year in price. This analytics is calculated using sales records from BADVIN database.
The table below shows average price for used 2019 FORD F-250 in each year since the year of manufacturing, current year price and projected price in the future years.
You can scroll the table horizontally to see all columns.
| Year | Average Mileage | Average Price | % Left | % Lost | ||
|---|---|---|---|---|---|---|
| 2019 MSRP | 0 mi | $60,650 | — | — | 100% | 0% |
| 2019 | 10,365 mi | $88,472 | −$27,822 | −45.87% | 145.87% | -45.87% |
| 2020 | 20,730 mi | $77,996 | +$10,476 | +11.84% | 128.6% | -28.6% |
| 2021 | 31,095 mi | $59,657 | +$18,339 | +23.51% | 98.36% | 1.64% |
| 2022 | 41,460 mi | $55,995 | +$3,662 | +6.14% | 92.32% | 7.68% |
| 2023 | 51,825 mi | $53,747 | +$2,248 | +4.01% | 88.62% | 11.38% |
| → Visit 2019 FORD F-250 depreciation page to see full data. | ||||||
Price vs Mileage
The graph below shows how mileage affects the price for 2019 FORD F-250. This data was calculated using sales records from BADVIN database.
The table below shows average price for used 2019 FORD F-250 by mileage and number of sales.
You can scroll the table horizontally to see all columns.
| Mileage | Average Price | Sample Size |
|---|---|---|
| 5,000 mi | $46,900 | 19 sales |
| 10,000 mi | $39,525 | 24 sales |
| 15,000 mi | $43,943 | 56 sales |
| 20,000 mi | $46,000 | 93 sales |
| 25,000 mi | $52,247 | 90 sales |
| 30,000 mi | $51,900 | 145 sales |
| → Visit 2019 FORD F-250 depreciation page to see full data. | ||
Get FULL ACCESS to the vehicle history report and see all blurred info.
⭐ Read 206+ reviews from our customers who used BADVIN to avoid buying junk vehicles.
Testimonials from our customers
BadVin's vehicle history report is a must-have before buying any used vehicle. It's saved me from a few lemons over the years - cars that looked great on the surface but had hidden issues like accidents or title problems. Well worth the price.

Camila Santos
verified on Trustpilot
Was about to buy a used 2016 Camry but decided to get the badvin report first. Turns out the car had been in a serious crash and was declared a total loss by insurance, even tho carfax showed it as clean! Dodged a bullet on that one. ty badvin
Jessica Nguyen
verified on Trustpilot
As a car dealer importing vehicles from the US to Mexico, I rely on badvin for comprehensive history reports before bidding at auctions. Their info has helped me avoid several salvage vehicles and is more thorough than carfax. A must-have service!
Javier Ramirez
verified on Trustpilot
As a broke college kid I almost settled for a sketchy 2005 Altima cuz it was cheap. but splurged on the report from badvin 1st. soooo glad I did - turned out it had been totalled and rebuilt. spending a little saved me from wasting $1000s!
Sophie
verified on Trustpilot
Compare to other 2019 FORD F-250
2017 FORD F-250
13 days ago, 159,780 mi
est retail value $57,852
buy now price $11,200
VIN 1FT7W2BT4HEC77118

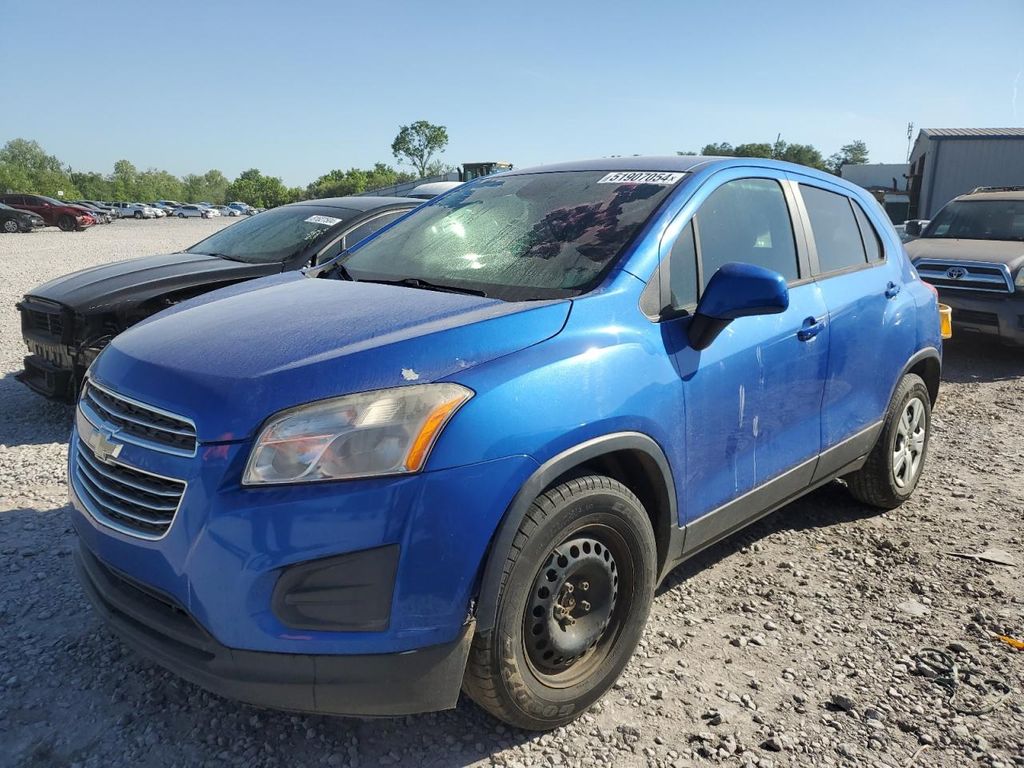
Other vehicles sales records
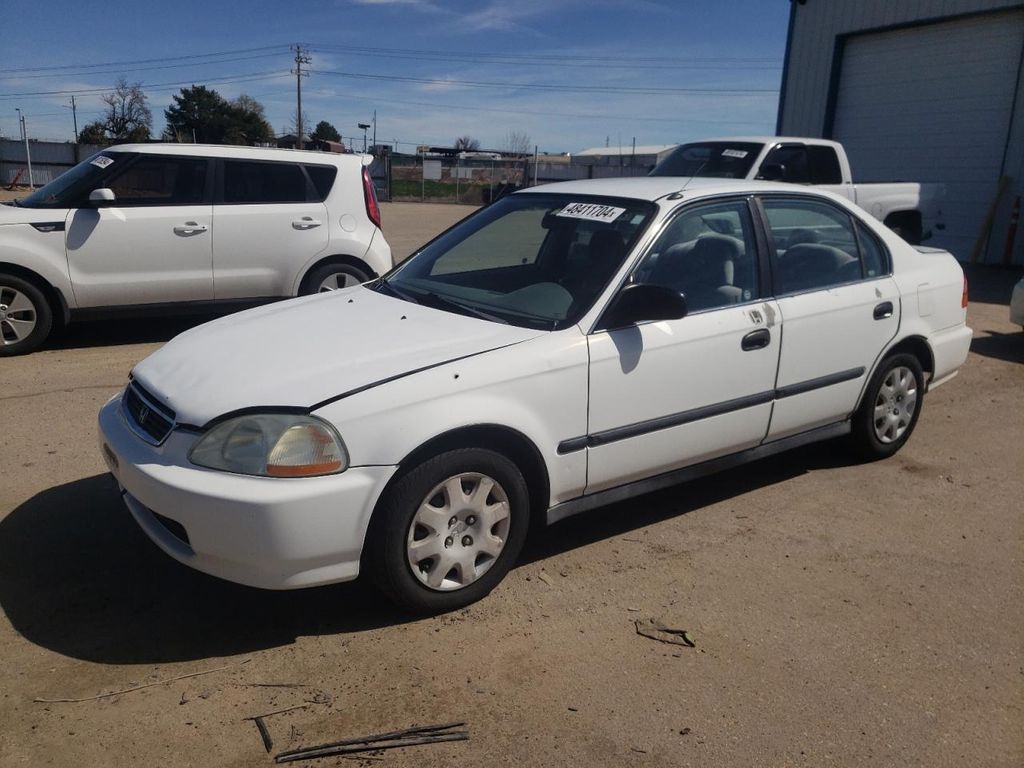

2011 BMW 5 SERIES
in 2 days, 167,942 mi
est retail value $6,600
buy now price $2,181
VIN WBAFR1C56BC739918

2020 CHEVROLET MALIBU
in 2 days, 58,254 mi
est retail value $21,713
buy now price $2,875
VIN 1G1ZD5ST9LF115156

Frequently asked questions
Factors to consider when estimating the future resale value include the car's historical depreciation rate, current market trends, overall vehicle condition, and mileage.
The last six digits of a VIN are the vehicle's unique serial number, which identifies the specific unit among others from the same model and production line.
These records, if available, detail instances of major damage and subsequent dispositions, essential for evaluating the past treatment and current state of the 2019 FORD F-250.
Yes, the Monroney label includes information about the vehicle’s manufacturing origin, specifying where the vehicle was assembled and the origin of its parts.
High mileage typically accelerates the depreciation of a vehicle, as it may indicate increased wear and tear and potential future repairs.
Sales prices from past transactions may be documented in our reports, providing a price history that aids in determining current market value, if such data is available.


