
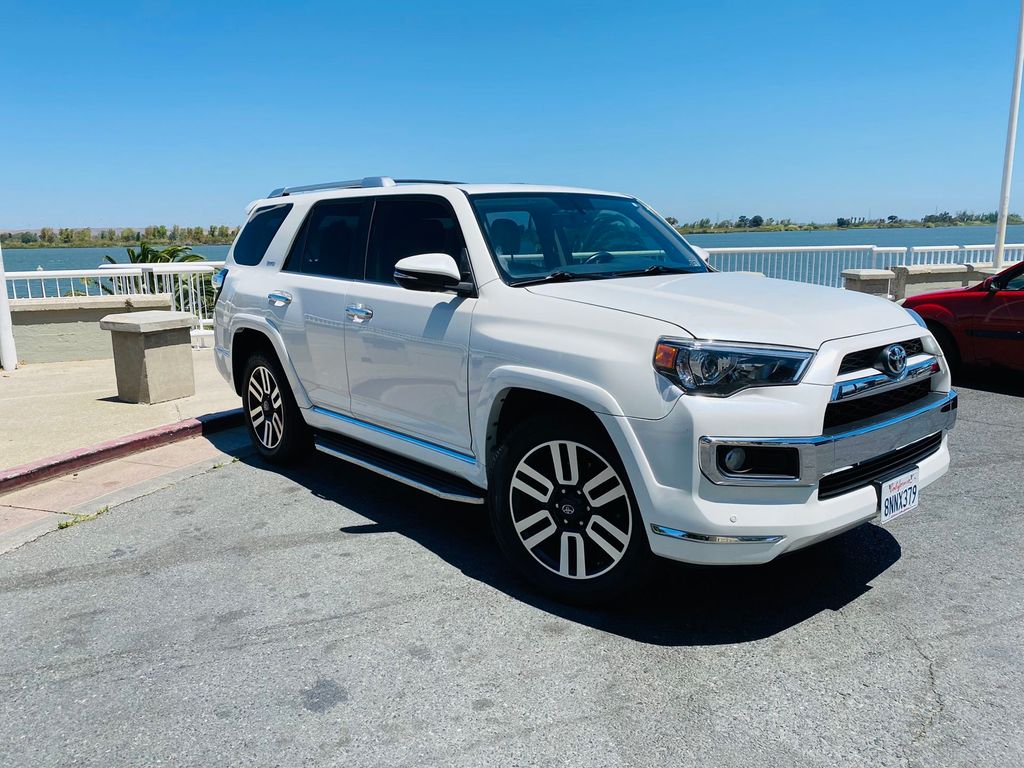
Photos
Pictures below are not fancy pictures from manufacturer catalog. It's all photos of real vehicles that were on sale on United States market. You can click on any picture to see specific vehicle and its VIN report.


The graph below is a depreciation curve for 2016 TOYOTA OTHER. It shows how much this model looses per year in price. This analytics is calculated using sales records from BADVIN database.
The table below shows average price for used 2016 TOYOTA OTHER in each year since the year of manufacturing, current year price and projected price in the future years.
You can scroll the table horizontally to see all columns.
| Year | Average Mileage | Average Price | % Left | % Lost | ||
|---|---|---|---|---|---|---|
| 2016 MSRP | 0 mi | $45,975 | — | — | 100% | 0% |
| 2016 | 7,823 mi | $44,405 | +$1,570 | +3.41% | 96.59% | 3.41% |
| 2017 | 15,646 mi | $39,500 | +$4,905 | +11.05% | 85.92% | 14.08% |
| → Visit 2016 TOYOTA OTHER depreciation page to see full data. | ||||||
The graph below shows how mileage affects the price for 2016 TOYOTA OTHER. This data was calculated using sales records from BADVIN database.
The table below shows average price for used 2016 TOYOTA OTHER by mileage and number of sales.
You can scroll the table horizontally to see all columns.
| Mileage | Average Price | Sample Size |
|---|---|---|
| 15,000 mi | $24,495 | 14 sales |
| 20,000 mi | $21,498 | 19 sales |
| 25,000 mi | $21,999 | 16 sales |
| 30,000 mi | $22,895 | 43 sales |
| 35,000 mi | $25,894 | 55 sales |
| 40,000 mi | $18,724 | 49 sales |
| → Visit 2016 TOYOTA OTHER depreciation page to see full data. | ||
Other years of TOYOTA OTHER

1992 TOYOTA OTHER
90+ sales records

1993 TOYOTA OTHER
70+ sales records

2001 TOYOTA OTHER
130+ sales records

2011 TOYOTA OTHER
230+ sales records

2018 TOYOTA OTHER
2,800+ sales records

2019 TOYOTA OTHER
2,700+ sales records
Similar Models

2018 TOYOTA COROLLA
$21,900 MSRP
$16,042 average used price
182,100+ sales records

2018 TOYOTA SEQUOIA
$66,120 MSRP
$38,619 average used price
13,000+ sales records

2018 TOYOTA PRIUS
$26,860 MSRP
$21,762 average used price
44,600+ sales records
2019 TOYOTA AVALON
$37,825 MSRP
$27,476 average used price
33,500+ sales records

2019 TOYOTA SEQUOIA
$66,120 MSRP
$42,891 average used price
14,800+ sales records

2019 TOYOTA PRIUS
$26,860 MSRP
$22,998 average used price
40,400+ sales records
Frequently asked questions
A salvage title generally indicates that the vehicle was declared a total loss by an insurance company due to severe damage from an accident, flood, or other causes, if such information is recorded.
A vehicle window sticker includes information such as MSRP, fuel efficiency, safety ratings, and optional equipment.
A VIN alone does not typically provide fuel economy details directly; however, it can identify the vehicle model and engine type, which you can cross-reference with fuel economy data from other sources.
The Monroney label helps you understand the added features on a vehicle by listing optional equipment and packages included in the vehicle, along with their pricing.
Advanced safety features can influence the resale value and slow the depreciation of vehicles by making them more attractive to safety-conscious buyers.
No, vehicle history reports do not include personal contact information of previous owners due to privacy regulations.
Recall and Safety Checks
Given Toyota's annual sales of 9,528,438 vehicles, checking the VIN is essential as recalls can affect between 2% and 10% of vehicles, ensuring safety and compliance.
Verification of Ownership History
A VIN check confirms the ownership history and service records of a Toyota, helping to verify that the vehicle has been maintained properly and is free from unresolved legal issues.
Protection Against Fraud
Checking the VIN helps ensure the Toyota has not been stolen or undergone major undocumented repairs, safeguarding the buyer's investment.


