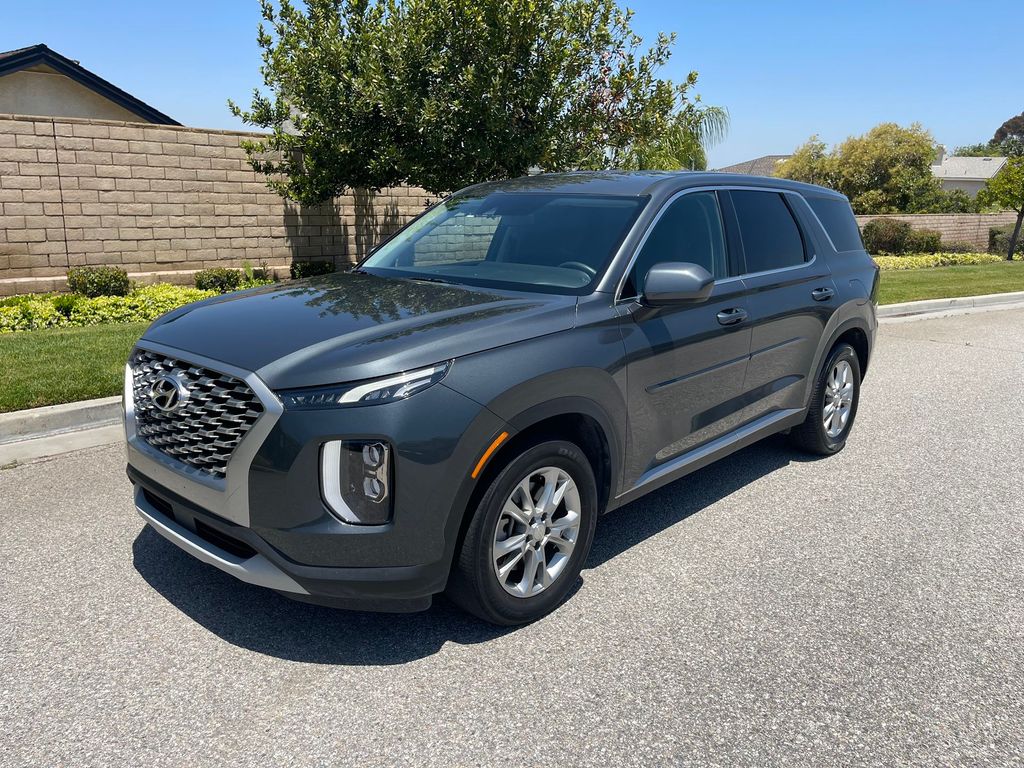
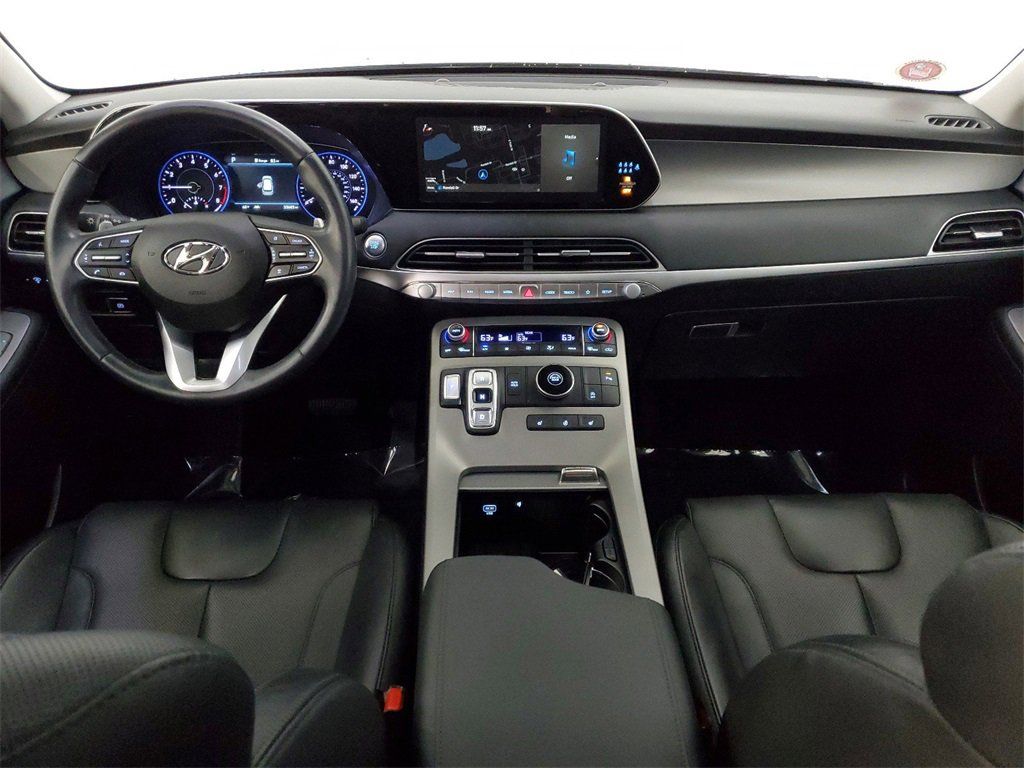
Photos
Pictures below are not fancy pictures from manufacturer catalog. It's all photos of real vehicles that were on sale on United States market. You can click on any picture to see specific vehicle and its VIN report.


The graph below is a depreciation curve for 2021 HYUNDAI PALISADE. It shows how much this model looses per year in price. This analytics is calculated using sales records from BADVIN database.
The table below shows average price for used 2021 HYUNDAI PALISADE in each year since the year of manufacturing, current year price and projected price in the future years.
You can scroll the table horizontally to see all columns.
| Year | Average Mileage | Average Price | % Left | % Lost | ||
|---|---|---|---|---|---|---|
| 2021 MSRP | 0 mi | $46,295 | — | — | 100% | 0% |
| 2021 | 14,801 mi | $46,911 | −$616 | −1.33% | 101.33% | -1.33% |
| 2022 | 29,602 mi | $42,953 | +$3,958 | +8.44% | 92.78% | 7.22% |
| 2023 | 44,403 mi | $37,495 | +$5,458 | +12.71% | 80.99% | 19.01% |
| 2024 | 59,204 mi | $33,998 | +$3,497 | +9.33% | 73.44% | 26.56% |
| 2025 | 74,005 mi | $30,000 | +$3,998 | +11.76% | 64.8% | 35.2% |
| → Visit 2021 HYUNDAI PALISADE depreciation page to see full data. | ||||||
The graph below shows how mileage affects the price for 2021 HYUNDAI PALISADE. This data was calculated using sales records from BADVIN database.
The table below shows average price for used 2021 HYUNDAI PALISADE by mileage and number of sales.
You can scroll the table horizontally to see all columns.
| Mileage | Average Price | Sample Size |
|---|---|---|
| 5,000 mi | $37,247 | 18 sales |
| 10,000 mi | $38,495 | 90 sales |
| 15,000 mi | $37,988 | 220 sales |
| 20,000 mi | $37,399 | 463 sales |
| 25,000 mi | $36,850 | 655 sales |
| 30,000 mi | $35,998 | 925 sales |
| → Visit 2021 HYUNDAI PALISADE depreciation page to see full data. | ||
Recent sales
BADVIN contain information about more than 62,600 sold 2021 HYUNDAI PALISADE on US market. Below you may find some of recent sales with exact mileage and prices.
What's the difference between auctions and classifieds?Classifieds

35,215 mi
listed for $34,998
TX
7 days ago

41,014 mi
listed for $37,998
TX
7 days ago

87,067 mi
listed for $27,840
GA
7 days ago

35,542 mi
listed for $37,900
AL
7 days ago

32,878 mi
listed for $38,998
NE
7 days ago

62,950 mi
listed for $33,998
IL
7 days ago

121,489 mi
listed for $21,750
TN
7 days ago

24,369 mi
listed for $37,900
CO
7 days ago

62,458 mi
listed for $30,451
SC
7 days ago

26,501 mi
listed for $35,713
OH
7 days ago

28,818 mi
listed for $31,995
FL
7 days ago

57,121 mi
listed for $31,198
OH
7 days ago
Other years of HYUNDAI PALISADE

2020 HYUNDAI PALISADE
$30,000 average used price
75,200+ sales records
2022 HYUNDAI PALISADE
$37,495 average used price
39,800+ sales records

2023 HYUNDAI PALISADE
$42,953 average used price
820+ sales records

2024 HYUNDAI PALISADE
$46,911 average used price
4,300+ sales records
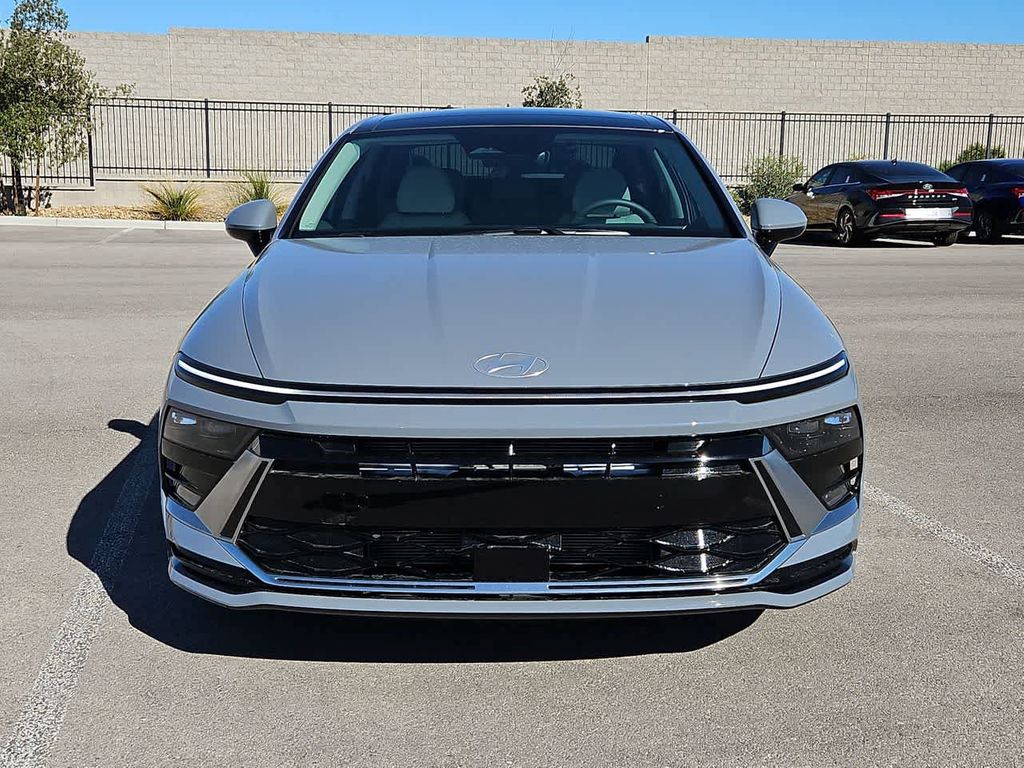
Similar Models

2022 HYUNDAI VENUE
$22,388 MSRP
$19,000 average used price
14,700+ sales records

2022 HYUNDAI ELANTRA
$20,800 MSRP
$19,998 average used price
36,600+ sales records

2023 HYUNDAI SANTA CRUZ
$37,155 MSRP
$29,895 average used price
810+ sales records

2023 HYUNDAI TUCSON HYBRID
$34,350 MSRP
$31,485 average used price
60+ sales records
2024 HYUNDAI SONATA
$25,559 MSRP
$29,626 average used price
2,200+ sales records

2024 HYUNDAI VENUE
$22,388 MSRP
$22,644 average used price
3,300+ sales records
Frequently asked questions
Safety ratings, if available, provide information from crash tests and safety evaluations, which can help assess the vehicle vehicle's protection level in accidents.
Stolen or repossessed status, if recorded, can affect the vehicle vehicle’s legal and financial status, impacting its marketability and insurability.
A used car might not have a window sticker because it is only legally required on new vehicles; once the vehicle is sold initially, the label might be removed or lost.
Vehicles that have been flooded may have a specific flood title or watermark in the vehicle history report, indicating significant water damage, if such events are documented.
Our reports might specify the point of impact and damage location on the vehicle vehicle, offering a clearer understanding of the accident, if such details are available.
Safety Recalls
With over 738,000 Hyundais sold annually in the U.S., up to 25% may have unaddressed safety recalls. A VIN check reveals any open recalls.
Accident History
Decoding the VIN uncovers any previous accident damage, flood damage, or other issues that could affect the safety and value of a used Hyundai.
Warranty Coverage
A VIN check confirms the original warranty details and remaining coverage, which is crucial for Hyundais known for their long warranties.


