
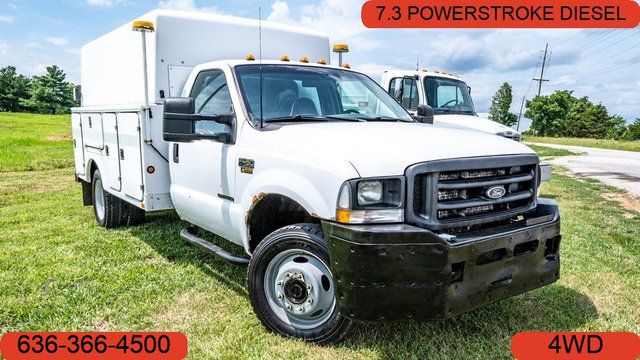
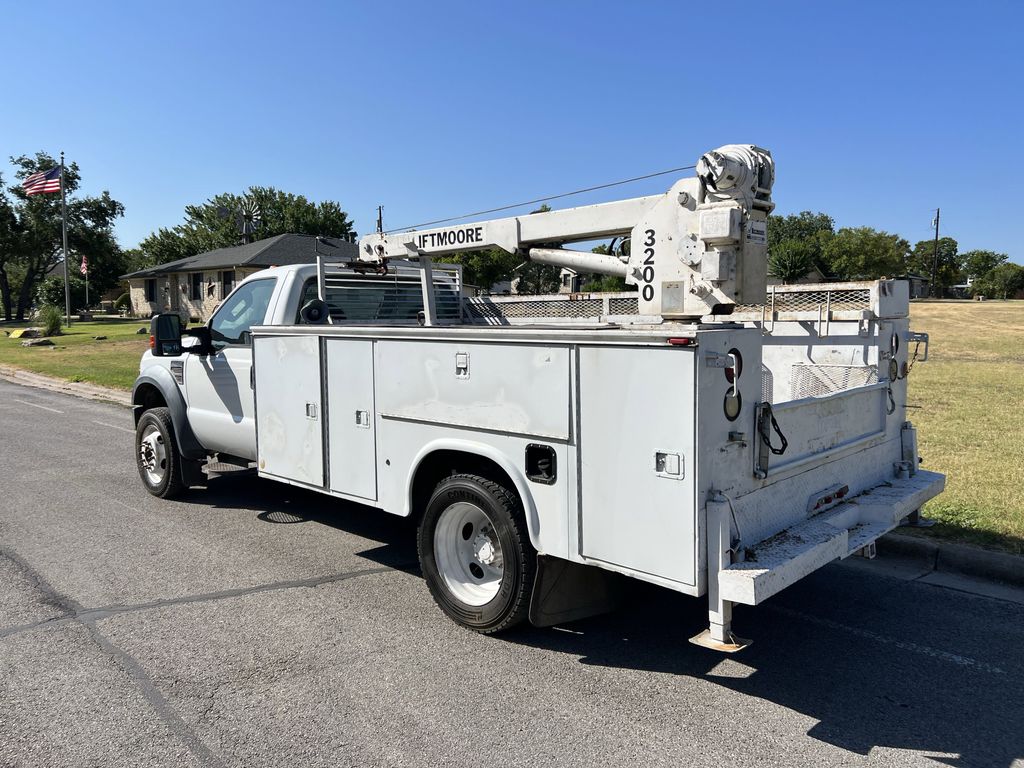
Depreciation
The depreciation graph and accompanying table on our page detail how the 2017 FORD F450's price has changed annually.
For instance, while the car initially depreciated slightly in its first year, subsequent years show a significant decrease, reflecting market trends and vehicle condition over time.
Such precise data is crucial for understanding how age and market dynamics impact car values.
The average price for new (MSRP) 2017 FORD F450 in 2017 was $66,915.
The average price for used 2017 FORD F450 nowadays in 2024 is $59,900 which is 90% from the original price.
Estimated mileage driven per year is 11,412 miles.
The graph below is a depreciation curve for 2017 FORD F450. It shows how much this model looses per year in price. This analytics is calculated using sales records from BADVIN database.
The table below shows average price for used 2017 FORD F450 in each year since the year of manufacturing, current year price and projected price in the future years.
You can scroll the table horizontally to see all columns.
| Year | Average Mileage | Average Price | % Left | % Lost | ||
|---|---|---|---|---|---|---|
| 2017 MSRP | 0 mi | $66,915 | — | — | 100% | 0% |
| 2018 | 22,824 mi | $87,360 | +$0 | +0% | 130.55% | -30.55% |
| 2019 | 34,236 mi | $84,995 | +$2,365 | +2.71% | 127.02% | -27.02% |
| 2020 | 45,648 mi | $77,000 | +$7,995 | +9.41% | 115.07% | -15.07% |
| 2021 | 57,060 mi | $73,480 | +$3,520 | +4.57% | 109.81% | -9.81% |
| 2022 | 68,472 mi | $65,997 | +$7,483 | +10.18% | 98.63% | 1.37% |
| 2023 | 79,884 mi | $63,848 | +$2,149 | +3.26% | 95.42% | 4.58% |
| 2024 | 91,296 mi | $59,900 | +$3,948 | +6.18% | 89.52% | 10.48% |
| 2025 | 102,708 mi | $45,940 | +$13,960 | +23.31% | 68.65% | 31.35% |
| 2026 | 114,120 mi | $39,942 | +$5,998 | +13.06% | 59.69% | 40.31% |
| 2027 | 125,532 mi | $39,992 | −$50 | −0.13% | 59.77% | 40.23% |
| 2028 | 136,944 mi | $36,348 | +$3,644 | +9.11% | 54.32% | 45.68% |
| 2029 | 148,356 mi | $31,995 | +$4,353 | +11.98% | 47.81% | 52.19% |
| 2030 | 159,768 mi | $31,390 | +$605 | +1.89% | 46.91% | 53.09% |
| 2031 | 171,180 mi | $27,965 | +$3,425 | +10.91% | 41.79% | 58.21% |
Price vs Mileage
Our comprehensive analysis does not stop at depreciation; it also covers how mileage affects the FORD F450’s price.
With data showing detailed price points at various mileage milestones, this section helps in identifying trends and making informed decisions.
For instance, price drops at higher mileages compared to lower mileages provides insights into potential maintenance or value thresholds.
This block is particularly useful for buyers and sellers aiming to gauge the best value proposition based on vehicle mileage.
The graph below shows how mileage affects the price for 2017 FORD F450. This data was calculated using sales records from BADVIN database.
The table below shows average price for used 2017 FORD F450 by mileage and number of sales.
You can scroll the table horizontally to see all columns.
| Mileage | Average Price | Sample Size |
|---|---|---|
| 5,000 mi | $72,984 | 27 sales |
| 10,000 mi | $69,475 | 42 sales |
| 15,000 mi | $69,945 | 54 sales |
| 20,000 mi | $68,275 | 98 sales |
| 25,000 mi | $67,998 | 90 sales |
| 30,000 mi | $68,994 | 118 sales |
| 35,000 mi | $68,597 | 137 sales |
| 40,000 mi | $68,683 | 134 sales |
| 45,000 mi | $69,925 | 124 sales |
| 50,000 mi | $68,594 | 133 sales |
| 55,000 mi | $70,744 | 121 sales |
| 60,000 mi | $69,926 | 100 sales |
| 65,000 mi | $71,998 | 108 sales |
| 70,000 mi | $68,148 | 96 sales |
| 75,000 mi | $66,988 | 109 sales |
| 80,000 mi | $64,825 | 98 sales |
| 85,000 mi | $64,991 | 83 sales |
| 90,000 mi | $64,765 | 74 sales |
| 95,000 mi | $65,978 | 75 sales |
| 100,000 mi | $60,000 | 45 sales |
| 105,000 mi | $61,948 | 60 sales |
| 110,000 mi | $60,748 | 36 sales |
| 115,000 mi | $62,493 | 44 sales |
| 120,000 mi | $61,992 | 39 sales |
| 125,000 mi | $59,998 | 35 sales |
| 130,000 mi | $59,960 | 40 sales |
| 135,000 mi | $61,495 | 24 sales |
| 140,000 mi | $52,995 | 19 sales |
| 145,000 mi | $56,000 | 15 sales |
| 150,000 mi | $53,995 | 23 sales |
| 155,000 mi | $59,997 | 12 sales |
| 160,000 mi | $52,995 | 11 sales |
| 165,000 mi | $53,728 | 13 sales |
| 170,000 mi | $53,767 | 12 sales |
| 180,000 mi | $49,998 | 11 sales |
Frequently asked questions
To minimize depreciation costs, consider purchasing a model known for retaining its value or opting for a slightly used vehicle that has already undergone initial depreciation.
Factors to consider when estimating the future resale value include the car's historical depreciation rate, current market trends, overall vehicle condition, and mileage.
To maximize value, consider buying a vehicle that is a few years old, as it has already undergone significant depreciation but likely remains reliable.
The best time of year to sell your car to minimize depreciation might be just before the release of a new model, when demand for used models could be higher.
Some models may depreciate faster due to factors like lower demand, higher maintenance costs, or outdated technology compared to newer versions.
On average, a new car can depreciate by approximately 23% after the first year, reflecting the premium paid for new technology and immediate depreciation once it's considered used.
Mileage is considered a major factor in the depreciation of vehicles because it directly correlates with the amount of use and potential wear and tear the vehicle has undergone.
Advanced safety features can influence the resale value and slow the depreciation of vehicles by making them more attractive to safety-conscious buyers.
The economic climate can significantly affect the depreciation of vehicles, with higher demand and better economic conditions typically slowing depreciation rates.
A CPO vehicle offers the reliability of a new car at a lower price, backed by a comprehensive warranty, making it a great option for those seeking value and peace of mind.
Other years of FORD F450

1997 FORD F450
$9,900 average used price
110+ sales records
2000 FORD F450
$16,988 average used price
180+ sales records
2009 FORD F450
$25,000 average used price
330+ sales records

2010 FORD F450
$27,965 average used price
370+ sales records

2012 FORD F450
$31,995 average used price
1,200+ sales records

2019 FORD F450
$65,997 average used price
5,100+ sales records
Similar Models

2019 FORD SUPER DUTY
$58,300 MSRP
$42,890 average used price
3,000+ sales records

2019 FORD ESCAPE
$30,415 MSRP
$16,999 average used price
180,700+ sales records

2020 FORD OTHER
$31,710 MSRP
$52,923 average used price
16,000+ sales records

2020 FORD EXPEDITION
$61,900 MSRP
$39,395 average used price
129,600+ sales records

2020 FORD F-250
$60,650 MSRP
$53,747 average used price
137,800+ sales records

2020 FORD TRANSIT
$40,890 MSRP
$35,999 average used price
68,700+ sales records


