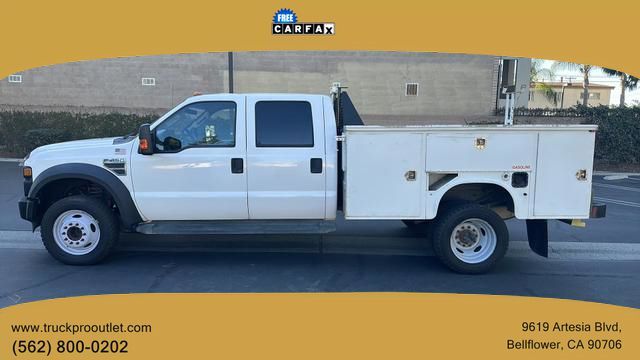
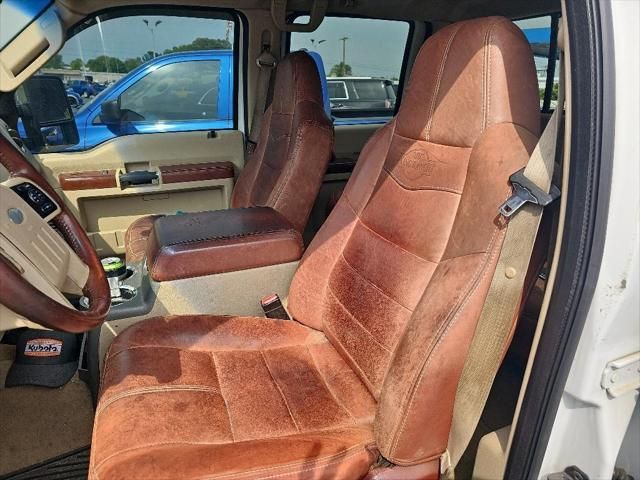
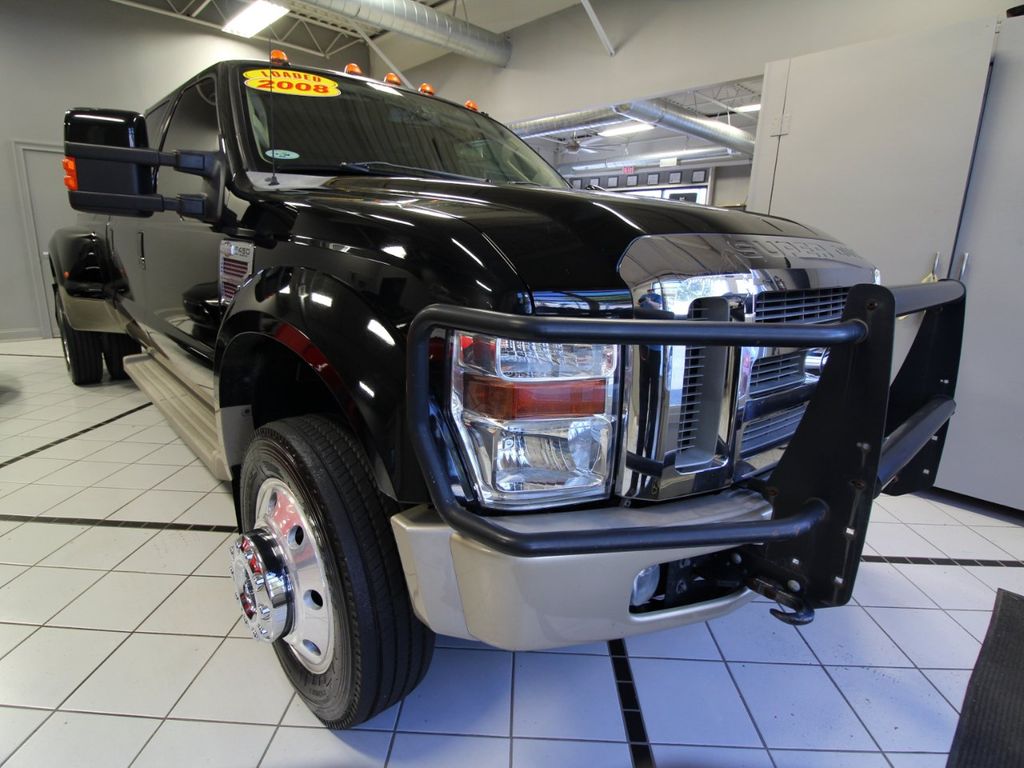
Photos
Pictures below are not fancy pictures from manufacturer catalog. It's all photos of real vehicles that were on sale on United States market. You can click on any picture to see specific vehicle and its VIN report.


The graph below is a depreciation curve for 2008 FORD F450. It shows how much this model looses per year in price. This analytics is calculated using sales records from BADVIN database.
The table below shows average price for used 2008 FORD F450 in each year since the year of manufacturing, current year price and projected price in the future years.
You can scroll the table horizontally to see all columns.
| Year | Average Mileage | Average Price | % Left | % Lost | ||
|---|---|---|---|---|---|---|
| 2008 MSRP | 0 mi | $66,915 | — | — | 100% | 0% |
| 2009 | 22,824 mi | $87,360 | +$0 | +0% | 130.55% | -30.55% |
| 2010 | 34,236 mi | $84,995 | +$2,365 | +2.71% | 127.02% | -27.02% |
| 2011 | 45,648 mi | $77,000 | +$7,995 | +9.41% | 115.07% | -15.07% |
| 2012 | 57,060 mi | $73,480 | +$3,520 | +4.57% | 109.81% | -9.81% |
| → Visit 2008 FORD F450 depreciation page to see full data. | ||||||
The graph below shows how mileage affects the price for 2008 FORD F450. This data was calculated using sales records from BADVIN database.
The table below shows average price for used 2008 FORD F450 by mileage and number of sales.
You can scroll the table horizontally to see all columns.
| Mileage | Average Price | Sample Size |
|---|---|---|
| 30,000 mi | $38,592 | 24 sales |
| 35,000 mi | $29,993 | 24 sales |
| 40,000 mi | $33,990 | 32 sales |
| 45,000 mi | $33,569 | 38 sales |
| 50,000 mi | $32,949 | 50 sales |
| 55,000 mi | $32,991 | 72 sales |
| → Visit 2008 FORD F450 depreciation page to see full data. | ||
Recent sales
BADVIN contain information about more than 2,900 sold 2008 FORD F450 on US market. Below you may find some of recent sales with exact mileage and prices.
What's the difference between auctions and classifieds?Dealer and insurance auctions

70,125 mi
sold for $9,000
MA
4 years ago
Classifieds
166,729 mi
listed for $19,925
TN
23 days ago

160,000 mi
listed for $24,500
CA
23 days ago

136,943 mi
listed for $23,899
OH
23 days ago

194,000 mi
listed for $19,999
MO
23 days ago

93,903 mi
listed for $28,995
UT
23 days ago
108,351 mi
listed for $27,995
OH
23 days ago

76,798 mi
listed for $29,997
KY
23 days ago

125,000 mi
listed for $28,000
TX
23 days ago

66,038 mi
listed for $16,790
MN
24 days ago

15,124 mi
listed for $36,988
FL
24 days ago
236,450 mi
listed for $15,999
IA
24 days ago

92,569 mi
listed for $29,995
WA
25 days ago
Features and options
We've collected all possible options and features that you may find in sales listings for 2008 FORD F450 and organized it in two lists.
- AIR CONDITIONING
- AIRBAG FRONT LEFT
- AIRBAG FRONT RIGHT
- AM/FM
- SIDE STEPS
- VINYL INTERIOR
- WARRANTY BOOK
Other years of FORD F450

2002 FORD F450
$15,500 average used price
170+ sales records

2007 FORD F450
$16,650 average used price
290+ sales records

2013 FORD F450
$36,348 average used price
660+ sales records

2019 FORD F450
$65,997 average used price
5,100+ sales records

2020 FORD F450
$73,480 average used price
3,600+ sales records

2023 FORD F450
$87,360 average used price
180+ sales records
Similar Models

2011 FORD E-350
$34,455 MSRP
$15,997 average used price
1,200+ sales records

2011 FORD ESCAPE
$30,415 MSRP
$6,999 average used price
39,800+ sales records

2011 FORD SUPER DUTY
$58,300 MSRP
$24,990 average used price
2,400+ sales records

2011 FORD F-SERIES
$33,100 MSRP
10+ sales records

2011 FORD RANGER
$38,035 MSRP
$13,995 average used price
28,000+ sales records

2011 FORD ECONOLINE
$30,978 MSRP
$14,988 average used price
4,900+ sales records
Frequently asked questions
Use as a police or taxi vehicle, if noted, indicates high-intensity use which may affect the vehicle vehicle's condition and lifespan, if such use is documented.
Regulatory changes can affect what is included on future Monroney labels, particularly as governments implement new requirements for transparency in vehicle pricing, fuel efficiency, and safety.
Vehicle history reports may include details and photographs from auto auctions, showing the vehicle vehicle’s condition and specifications when it was up for sale, if available.
These records, if available, show if the vehicle has been reported stolen or recovered, impacting its legal status and potential purchase risk.
While a VIN decoder can provide the model year that can suggest warranty status, verifying the actual warranty status usually requires direct contact with the manufacturer or dealer.
Advanced safety features can influence the resale value and slow the depreciation of vehicles by making them more attractive to safety-conscious buyers.
Safety Recalls
With over 1.9 million Fords sold yearly in the U.S., up to 30% may have unresolved safety recalls. A VIN check identifies any open recalls.
Accident History
Decoding the VIN reveals if a used Ford has been in accidents, flooded, or sustained other damage that could affect its safety and value.
Maintenance Records
A VIN check provides detailed maintenance records, ensuring the used Ford you buy has been properly serviced and cared for.


