
BADVIN vehicle history report for
2016 KIA FORTEVIN: KNAFX4A65G5504439
Get FULL ACCESS to the vehicle history report and see all blurred info.
⭐ Read 206+ reviews from our customers who used BADVIN to avoid buying junk vehicles.
Historical Records
events
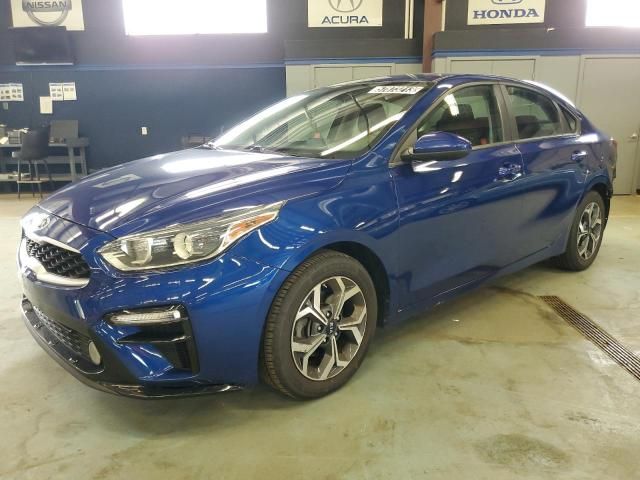
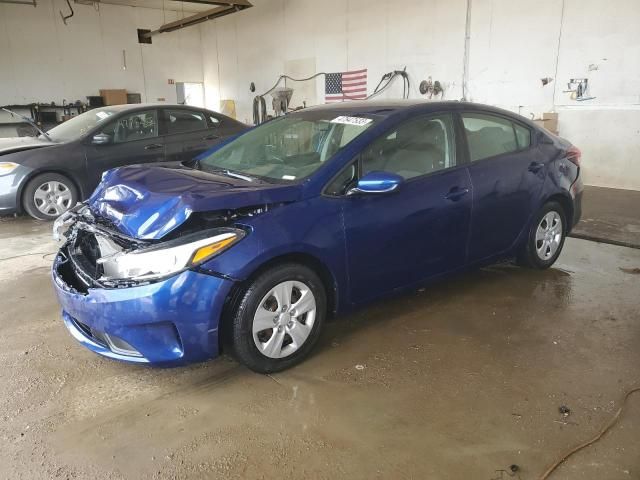
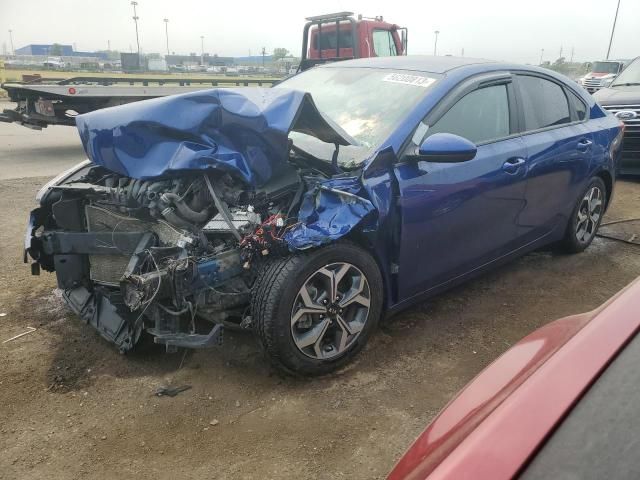
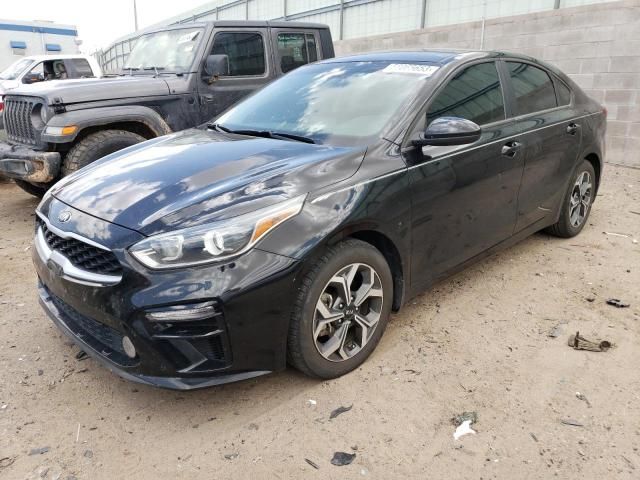
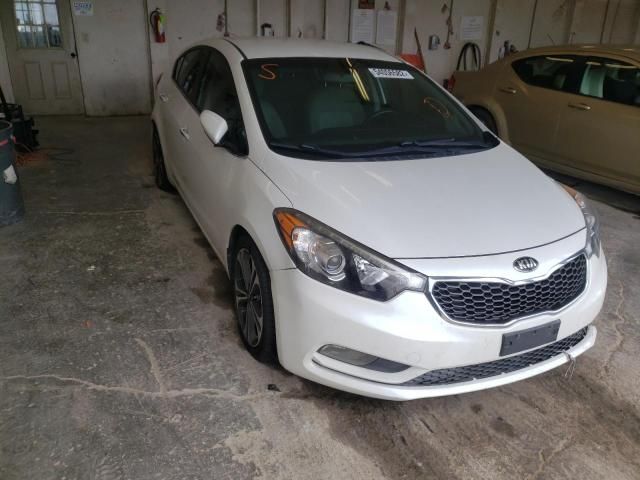
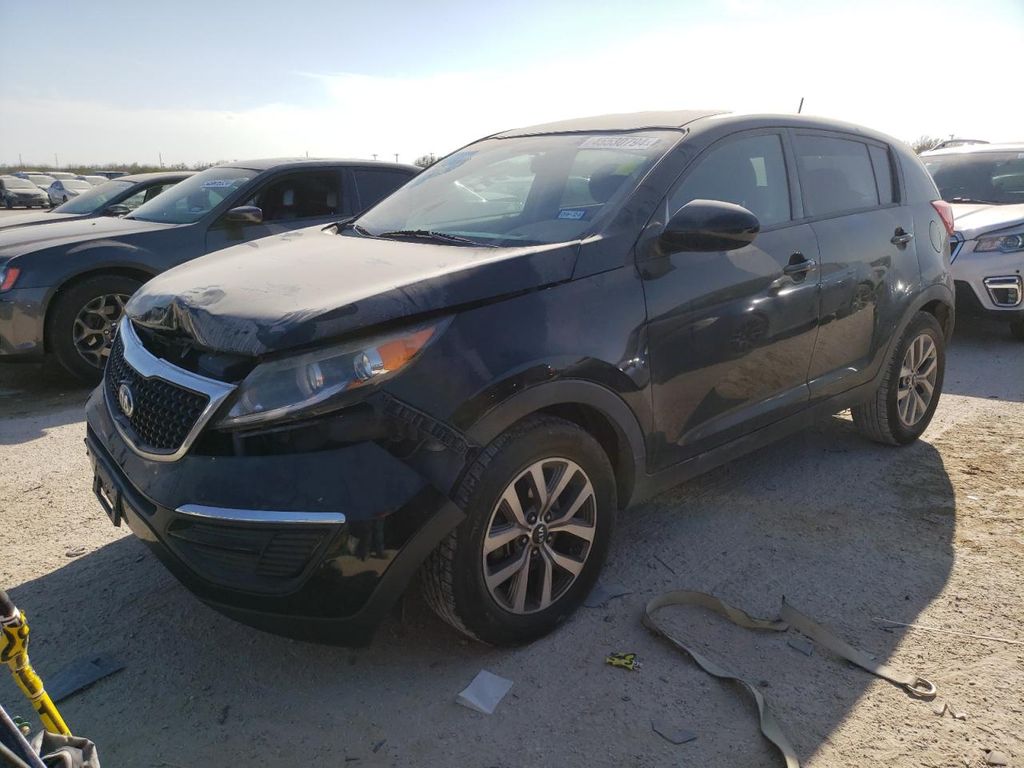
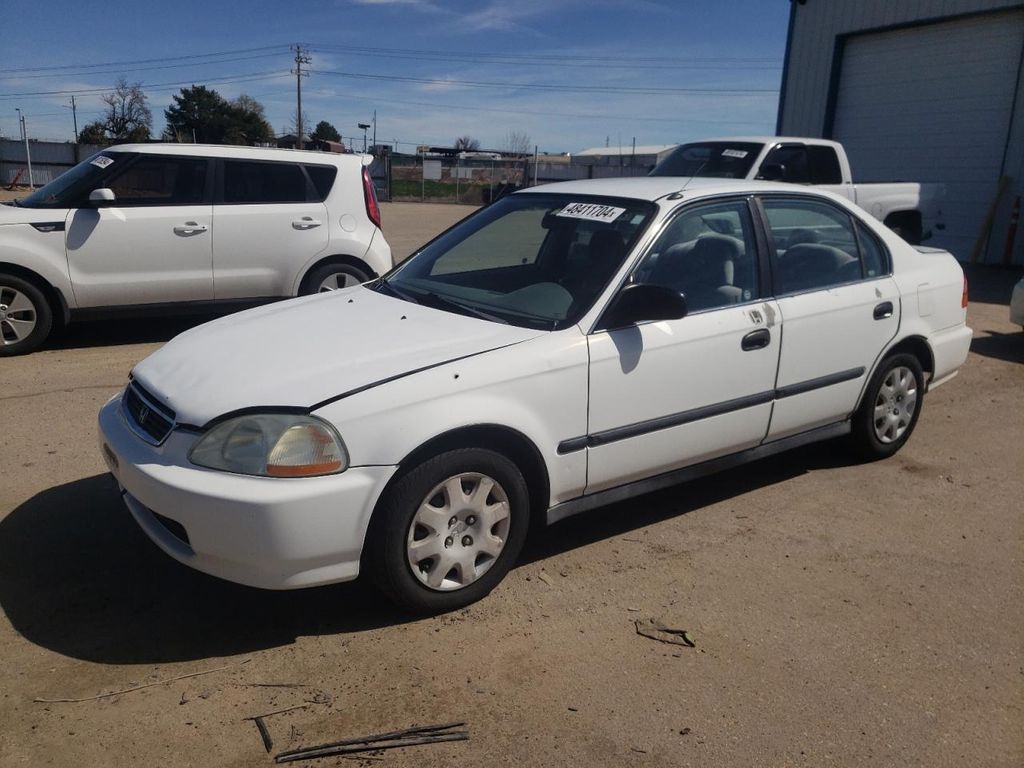
Photos
7 images
Sales History
1 records
Market report
Price analytics
Historical Records
Historical records may include service and maintenance records, title status (clean, junk, salvage), insurance records, number of owners, registration events and states, and other information.
You can find more information about historical records in BADVIN reports and see more examples here.
Available historical records for VIN KNAFX4A65G5504439
Latest reported mileage: 798 mi
Below you can see some examples of what these records could look like.
2023-07-17
a year ago
71,189 mi
Vehicle serviced
Tire repaired
Tire repaired
2021-10-28
3 years ago
18,518 mi
Odometer reading reported
2019-10-09
5 years ago
42,675 mi
NOT ACTUAL MILEAGE TITLE ISSUED
Titled or registered as lease vehicle
Titled or registered as lease vehicle
Sale Record
Sale Date
2 years ago
Location
St. Louis, MO, 63136
2016 KIA FORTE LX
sold
| Year | 2016 |
| ODO | — |
| Location | St. Louis, MO, 63136 |
| Date | ended 2 years ago |
| Sale Website Type | salvage or insurance auction |
sale information provided by user #566970


All photos above are REAL and display ACTUAL car. After you get the report you will see full resolution photos.
Tech Specs
Model Analytics & Market Report
We've analyzed more than 63,000 sales records of this model and here are some numbers.
The average price for new (MSRP) 2016 KIA FORTE in 2016 was $22,145.
The average price for used 2016 KIA FORTE nowadays in 2024 is $9,999 which is 45% from the original price.
Estimated mileage driven per year is 11,809 miles.
For this model we also have depreciation curve, photos, list of features and options, and other analytics.
Take a look at 2016 KIA FORTE model page in BADVIN vehicles catalog.
Depreciation
The graph below is a depreciation curve for 2016 KIA FORTE. It shows how much this model looses per year in price. This analytics is calculated using sales records from BADVIN database.
The table below shows average price for used 2016 KIA FORTE in each year since the year of manufacturing, current year price and projected price in the future years.
You can scroll the table horizontally to see all columns.
| Year | Average Mileage | Average Price | % Left | % Lost | ||
|---|---|---|---|---|---|---|
| 2016 MSRP | 0 mi | $22,145 | — | — | 100% | 0% |
| 2016 | 11,809 mi | $21,710 | +$435 | +1.96% | 98.04% | 1.96% |
| 2017 | 23,618 mi | $19,888 | +$1,822 | +8.39% | 89.81% | 10.19% |
| 2018 | 35,427 mi | $19,000 | +$888 | +4.47% | 85.8% | 14.2% |
| 2019 | 47,236 mi | $17,552 | +$1,448 | +7.62% | 79.26% | 20.74% |
| 2020 | 59,045 mi | $16,199 | +$1,353 | +7.71% | 73.15% | 26.85% |
| → Visit 2016 KIA FORTE depreciation page to see full data. | ||||||
Price vs Mileage
The graph below shows how mileage affects the price for 2016 KIA FORTE. This data was calculated using sales records from BADVIN database.
The table below shows average price for used 2016 KIA FORTE by mileage and number of sales.
You can scroll the table horizontally to see all columns.
| Mileage | Average Price | Sample Size |
|---|---|---|
| 10,000 mi | $16,998 | 11 sales |
| 15,000 mi | $14,952 | 21 sales |
| 20,000 mi | $14,999 | 37 sales |
| 25,000 mi | $14,488 | 47 sales |
| 30,000 mi | $14,428 | 53 sales |
| 35,000 mi | $13,998 | 55 sales |
| → Visit 2016 KIA FORTE depreciation page to see full data. | ||
Get FULL ACCESS to the vehicle history report and see all blurred info.
⭐ Read 206+ reviews from our customers who used BADVIN to avoid buying junk vehicles.
Testimonials from our customers
I've tried a bunch of different vehicle history reports over the years and badvin.org has been the most comprehensive by far. Stuff like service records, ownership history, lien and repo info that I haven't found elsewhere. Def go-to resource when shopping for used vehicles now.

Levi Johnson
verified on Trustpilot
I almost bought a 2019 Malibu that seemed like a great deal - low miles and price. But the badvin report showed it used to be a rental fleet vehicle, which the seller didn't disclose. Glad I found out before buying someone else's abused rental!
Benjamin Torres
verified on Trustpilot
BadVin's vehicle history report is a must-have before buying any used vehicle. It's saved me from a few lemons over the years - cars that looked great on the surface but had hidden issues like accidents or title problems. Well worth the price.
Camila Santos
verified on Trustpilot
I import used luxury cars from US auctions to resell in Russia. The vehicle history reports from badVIN are essential for avoiding problem cars. For a BMW I was bidding on, it uncovered a salvage title from flood damage that other reports missed! That alone pays for the service.
Dmitry Volkov
verified on Trustpilot
Compare to other 2016 KIA FORTE


2018 KIA FORTE
3 days ago, 55,048 mi
est retail value $14,257
buy now price $3,350
VIN 3KPFK4A77JE262694
2015 KIA FORTE
13 days ago, 81,591 mi
est retail value $14,830
buy now price $1,975
VIN KNAFX4A82F5352040
Other vehicles sales records


2017 CHEVROLET CAMARO
in an hour, 77,654 mi
est retail value $17,734
buy now price $6,400
VIN 1G1FB1RX2H0149797


Frequently asked questions
Yes, it is generally safe to share your VIN online for decoding, as the VIN is a public figure and does not contain sensitive personal information.
Our reports may include information on any past recalls issued for 2016 KIA vehicles, detailing the nature of the recall and whether it was addressed, if data is available.
Transmission replacement history, if applicable, might be detailed in our reports, providing insights into major repairs and vehicle reliability, if available.
The window sticker plays a crucial role in the car buying process by ensuring transparency about the vehicle's features, costs, and certifications, aiding consumers in making informed purchasing decisions.
Clunker repair records, if available, detail repairs under cash-for-clunkers programs, indicating major overhauls or updates to the 2016 KIA vehicle.
Keeping your vehicle for about three to five years can optimize its resale value, balancing depreciation with usage and maintenance costs.


