
BADVIN vehicle history report for
2019 HYUNDAI KONAVIN: KM8K5CA5XKU246695
Get FULL ACCESS to the vehicle history report and see all blurred info.
⭐ Read 206+ reviews from our customers who used BADVIN to avoid buying junk vehicles.
Historical Records
20 events
Window Sticker
PDF found
Photos
12 images
Sales History
1 records
Sale Prices
1 records
Market report
Price analytics
Historical Records
Historical records may include service and maintenance records, title status (clean, junk, salvage), insurance records, number of owners, registration events and states, and other information.
You can find more information about historical records in BADVIN reports and see more examples here.
Available 20 historical records for VIN KM8K5CA5XKU246695
Latest reported mileage: 7409 mi
Below you can see some examples of what these records could look like.
2024-01-05
6 months ago
152,728 mi
Accident reported: minor damage with another motor vehicle
Damage to rear
Damage to rear
2021-12-03
3 years ago
13,356 mi
Damage reported
Damage to front
Damage to front
2021-07-15
3 years ago
35,203 mi
Accident reported
Vehicle involved in a sideswipe collision with another motor vehicle
Airbag deployed
Vehicle involved in a sideswipe collision with another motor vehicle
Airbag deployed
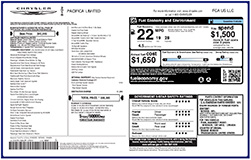
Window Sticker
A PDF of a window sticker is available for VIN KM8K5CA5XKU246695.
Also called Monroney label, it's a label required in the United States to be displayed in all new automobiles.
It may include certain official information about the car such as:
- Manufacturer's Suggested Retail Price (MSRP)
- Engine and Transmission Specifications
- Equipment, Packages, and Extra Features
- Fuel Economy Rating
- Other Information
Read more about window stickers and see some examples here.
| Year | 2019 |
| ODO | 3909 mi |
| Condition | Hidden text |
| Seller | Hidden text |
| Location | Danbury, CT, 06810 |
| Date | appeared 2 years ago latest price $1644 |
| Sale Website Type | classifieds |
| Notes | |
| Hidden text | |
sale information provided by user #246142


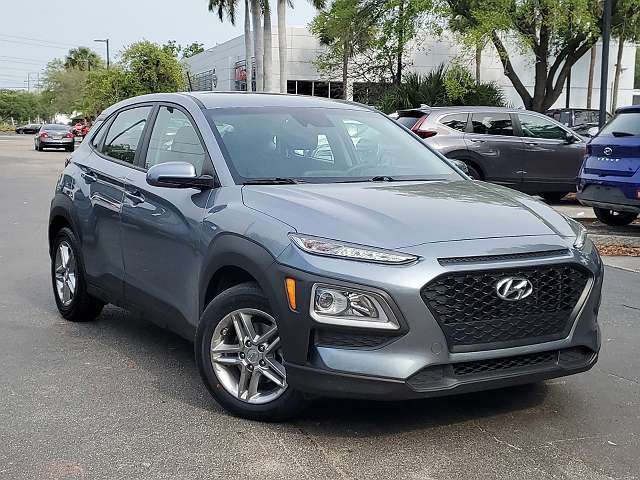
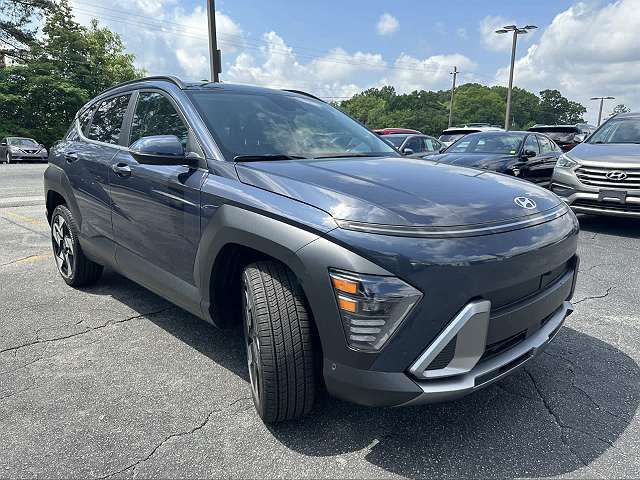
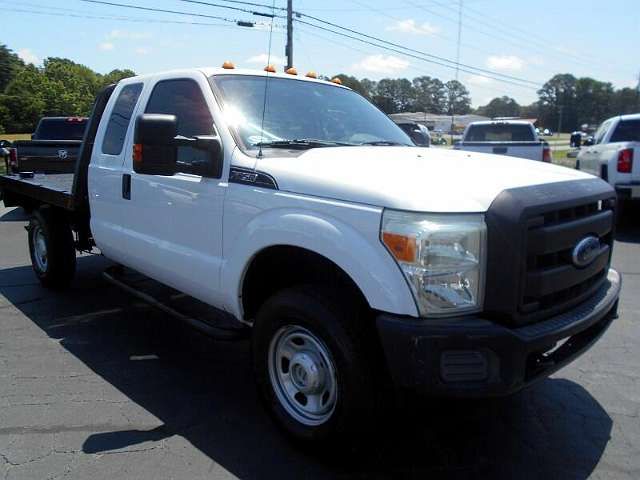
All photos above are REAL and display ACTUAL car. After you get the report you will see full resolution photos.
Tech Specs
| Body Style | SUV |
| Color | White |
| Color (Interior) | Gray |
| Transmission | Automatic |
| Engine | 1.6 L |
| Cylinders | 4 Cyl |
| Drive | AWD |
| Fuel Type | Gasoline |
Extra Features
- Alloy Wheels
- Hidden text
- Bucket Seats
- Hidden text
- Heated Seats
- Hidden text
- Leather Seats
- Hidden text
- Navigation System
- Hidden text
Standard Features
All these features are based on a model in general. This specific vehicle may differ.
- 4-Wheel Disc Brakes
- Hidden text
- Adjustable Steering Wheel
- Hidden text
- Android Auto
- Hidden text
- Anti-Theft System
- Hidden text
- Auto-Dimming Mirror
- Hidden text
- Braking Assist
- Hidden text
- Cross Traffic Alert
- Hidden text
- Daytime Running Lights
- Hidden text
- Front Airbags (Driver)
- Hidden text
- Heated Mirrors
- Hidden text
- Integrated Garage Door Opener
- Hidden text
- Lane Keeping System
- Hidden text
- MP3
- Hidden text
- Pass-Through Rear Seat
- Hidden text
- Power Mirrors
- Hidden text
- Power Steering
- Hidden text
- Premium Sound System
- Hidden text
- Rain-Sensing Wipers
- Hidden text
- Rear Spoiler
- Hidden text
- Rear-View Camera
- Hidden text
- Side Airbag
- Hidden text
- Stability Control
- Hidden text
- Sun/Moonroof
- Hidden text
- Trip Computer
- Hidden text
- Vanity Mirror/Light
- Hidden text
- iPod Adapter
Model Analytics & Market Report
We've analyzed more than 58,800 sales records of this model and here are some numbers.
The average price for new (MSRP) 2019 HYUNDAI KONA in 2019 was $26,075.
The average price for used 2019 HYUNDAI KONA nowadays in 2024 is $17,989 which is 69% from the original price.
Estimated mileage driven per year is 10,017 miles.
For this model we also have depreciation curve, photos, list of features and options, and other analytics.
Take a look at 2019 HYUNDAI KONA model page in BADVIN vehicles catalog.
Depreciation
The graph below is a depreciation curve for 2019 HYUNDAI KONA. It shows how much this model looses per year in price. This analytics is calculated using sales records from BADVIN database.
The table below shows average price for used 2019 HYUNDAI KONA in each year since the year of manufacturing, current year price and projected price in the future years.
You can scroll the table horizontally to see all columns.
| Year | Average Mileage | Average Price | % Left | % Lost | ||
|---|---|---|---|---|---|---|
| 2019 MSRP | 0 mi | $26,075 | — | — | 100% | 0% |
| 2019 | 10,017 mi | $25,999 | +$76 | +0.29% | 99.71% | 0.29% |
| 2020 | 20,034 mi | $22,577 | +$3,422 | +13.16% | 86.58% | 13.42% |
| 2021 | 30,051 mi | $20,995 | +$1,582 | +7.01% | 80.52% | 19.48% |
| 2022 | 40,068 mi | $19,990 | +$1,005 | +4.79% | 76.66% | 23.34% |
| 2023 | 50,085 mi | $18,998 | +$992 | +4.96% | 72.86% | 27.14% |
| → Visit 2019 HYUNDAI KONA depreciation page to see full data. | ||||||
Price vs Mileage
The graph below shows how mileage affects the price for 2019 HYUNDAI KONA. This data was calculated using sales records from BADVIN database.
The table below shows average price for used 2019 HYUNDAI KONA by mileage and number of sales.
You can scroll the table horizontally to see all columns.
| Mileage | Average Price | Sample Size |
|---|---|---|
| 0 mi | $23,988 | 11 sales |
| 5,000 mi | $21,999 | 71 sales |
| 10,000 mi | $21,998 | 143 sales |
| 15,000 mi | $21,936 | 254 sales |
| 20,000 mi | $21,000 | 375 sales |
| 25,000 mi | $21,327 | 456 sales |
| → Visit 2019 HYUNDAI KONA depreciation page to see full data. | ||
Get FULL ACCESS to the vehicle history report and see all blurred info.
⭐ Read 206+ reviews from our customers who used BADVIN to avoid buying junk vehicles.
Testimonials from our customers
After a bad experience buying a used car that turned out to have major issues, I now use Bad VIN to thoroughly check every vehicle i consider. It costs a bit more than other services but the detailed records and photos of past sales are wotrh it for the added peace of mind.

Olivia Johnson
verified on Trustpilot
Report showed a car I was considering had a prior salvage title from a major accident, even though carfax listed it as clean. Messaged seller asking about it and they made shady excuses. Def avoided a scam thanks to badvin!
Mia Johnson
verified on Trustpilot
Was shopping for a used Range Rover and found one that seemed suspiciously cheap. The badVIN report revealed it had been in a major front end collision, with photos showing the damage. Steered clear of that one and saved myself a ton of headaches!!
Ava Patel
verified on Trustpilot
As a used car dealer, I rely on badvin.org for checking every vehicle I'm considering purchasing at auction. The comprehensive reports give me peace of mind and help me avoid problem cars. Photos of past sales have saved me from overpaying many times. Worth every penny!
Misha
verified on Trustpilot
Compare to other 2019 HYUNDAI KONA


Other vehicles sales records


Frequently asked questions
A VIN decoder can reveal engine details such as the engine size, configuration, and fuel type, which are encoded in specific characters of the VIN.
To verify that a VIN has not been tampered with, check for inconsistencies in the VIN's font, alignment, and location, and compare the VIN displayed in various parts of the vehicle with that on the official documents.
Repossession records, if included, indicate if the 2019 HYUNDAI vehicle has been taken back by a lender due to payment defaults, which might affect its condition and value.
Economic downturns can lead to decreased demand and lower resale values for vehicles, as buyers may defer purchasing vehicles or opt for less expensive alternatives.
Such title brands might indicate significant past damage and repairs, crucial for assessing the safety and value of the 2019 HYUNDAI KONA, if such brands are applied.
Information from junk yards and salvage auctions may detail major damage and repairs, potentially impacting the 2019 HYUNDAI KONA's value and safety, depending on the records obtained.
The exterior and interior condition of vehicles significantly affects their depreciation, as well-maintained vehicles generally retain more value.
The 9th character in a VIN is the check digit, which is used to verify the authenticity of the VIN itself through a specific calculation.
Yes, the choice of vehicle color can impact the depreciation rate, with neutral colors typically being easier to sell and potentially holding their value better than more unconventional colors.


