
BADVIN vehicle history report for
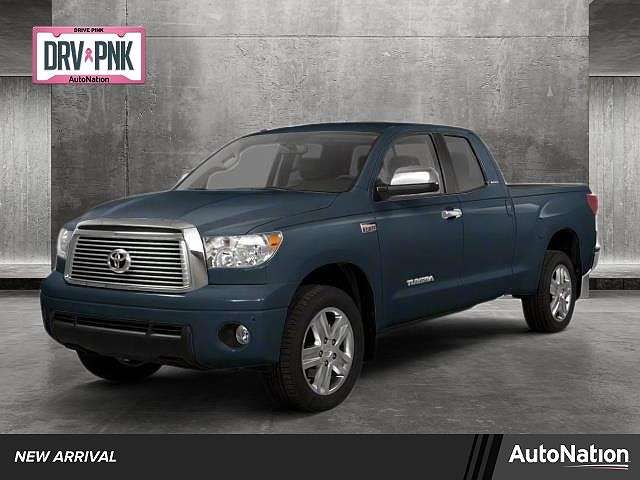
2018 TOYOTA TUNDRAVIN: 5TFUY5F17JX696744
Get FULL ACCESS to the vehicle history report and see all blurred info.
⭐ Read 206+ reviews from our customers who used BADVIN to avoid buying junk vehicles.
Historical Records
14 events
Sales History
1 records
Market report
Price analytics
Historical Records
Historical records may include service and maintenance records, title status (clean, junk, salvage), insurance records, number of owners, registration events and states, and other information.
You can find more information about historical records in BADVIN reports and see more examples here.
Available 14 historical records for VIN 5TFUY5F17JX696744
Latest reported mileage: 1017 mi
Below you can see some examples of what these records could look like.
2022-08-29
2 years ago
149,124 mi
Sold as a BMW Certified Pre-Owned Vehicle
2021-12-31
2 years ago
16,402 mi
Accident reported: minor damage with another motor vehicle
Damage to rear
Damage to rear
2021-02-27
3 years ago
36,917 mi
Odometer reading reported
Sale Record
| Year | 2018 |
| ODO | 9625 mi |
| Condition | Hidden text |
| Seller | Hidden text |
| Location | Westborough, MA, 01581 |
| Date | appeared 2 years ago |
| Sale Website Type | classifieds |
| Notes | |
| 7931 | |
sale information provided by user #31411
Tech Specs
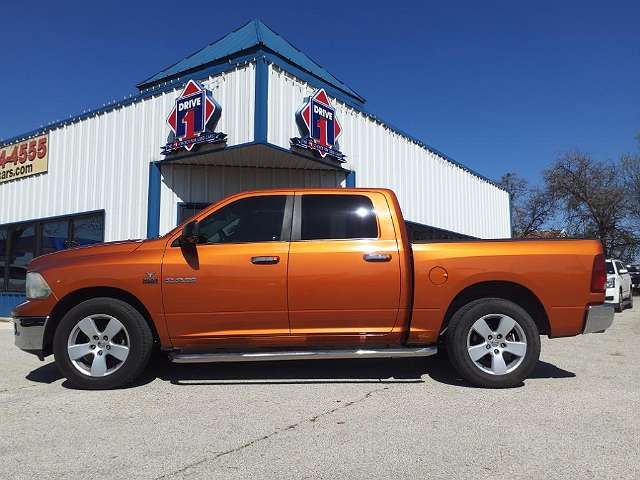
| Body Style | Pickup |
| Color | Silver |
| Transmission | Automatic |
| Engine | 5.7 L |
| Cylinders | 8 Cyl |
| Drive | 4WD |
| Fuel Type | Gasoline |
Extra Features
- Double Cab
- Hidden text
- Independent Suspension
- Hidden text
Standard Features
All these features are based on a model in general. This specific vehicle may differ.
- 4-Wheel Disc Brakes
- Hidden text
- Air Conditioning
- Hidden text
- Automatic Headlights
- Hidden text
- CD (Single Disc)
- Hidden text
- Delay-Off Headlights
- Hidden text
- Front Airbags (Driver)
- Hidden text
- Front Anti-Roll Bar
- Hidden text
- Front Side Airbags (Driver)
- Hidden text
- High-Beam Assist
- Hidden text
- Overhead Airbag
- Hidden text
- Panic Button
- Hidden text
- Power Mirrors
- Hidden text
- Power Windows
- Hidden text
- Rear-View Camera
- Hidden text
- Speed-Sensing Steering
- Hidden text
- Stability Control
- Hidden text
- Tachometer
- Hidden text
- Tire Pressure Monitoring System
- Hidden text
- Trip Computer
Model Analytics & Market Report
We've analyzed more than 102,800 sales records of this model and here are some numbers.
The average price for new (MSRP) 2018 TOYOTA TUNDRA in 2018 was $50,857.
The average price for used 2018 TOYOTA TUNDRA nowadays in 2024 is $35,499 which is 70% from the original price.
Estimated mileage driven per year is 11,272 miles.
For this model we also have depreciation curve, photos, list of features and options, and other analytics.
Take a look at 2018 TOYOTA TUNDRA model page in BADVIN vehicles catalog.
Depreciation
The graph below is a depreciation curve for 2018 TOYOTA TUNDRA. It shows how much this model looses per year in price. This analytics is calculated using sales records from BADVIN database.
The table below shows average price for used 2018 TOYOTA TUNDRA in each year since the year of manufacturing, current year price and projected price in the future years.
You can scroll the table horizontally to see all columns.
| Year | Average Mileage | Average Price | % Left | % Lost | ||
|---|---|---|---|---|---|---|
| 2018 MSRP | 0 mi | $50,857 | — | — | 100% | 0% |
| 2018 | 11,272 mi | $59,999 | −$9,142 | −17.98% | 117.98% | -17.98% |
| 2019 | 22,544 mi | $56,989 | +$3,010 | +5.02% | 112.06% | -12.06% |
| 2020 | 33,816 mi | $48,974 | +$8,015 | +14.06% | 96.3% | 3.7% |
| 2021 | 45,088 mi | $42,729 | +$6,245 | +12.75% | 84.02% | 15.98% |
| 2022 | 56,360 mi | $40,764 | +$1,965 | +4.6% | 80.15% | 19.85% |
| → Visit 2018 TOYOTA TUNDRA depreciation page to see full data. | ||||||
Price vs Mileage
The graph below shows how mileage affects the price for 2018 TOYOTA TUNDRA. This data was calculated using sales records from BADVIN database.
The table below shows average price for used 2018 TOYOTA TUNDRA by mileage and number of sales.
You can scroll the table horizontally to see all columns.
| Mileage | Average Price | Sample Size |
|---|---|---|
| 5,000 mi | $45,000 | 15 sales |
| 10,000 mi | $45,490 | 19 sales |
| 15,000 mi | $39,938 | 48 sales |
| 20,000 mi | $41,988 | 63 sales |
| 25,000 mi | $42,731 | 124 sales |
| 30,000 mi | $39,958 | 184 sales |
| → Visit 2018 TOYOTA TUNDRA depreciation page to see full data. | ||
Get FULL ACCESS to the vehicle history report and see all blurred info.
⭐ Read 206+ reviews from our customers who used BADVIN to avoid buying junk vehicles.
Testimonials from our customers
As a used car dealer, I rely on badvin.org for checking every vehicle I'm considering purchasing at auction. The comprehensive reports give me peace of mind and help me avoid problem cars. Photos of past sales have saved me from overpaying many times. Worth every penny!

Misha
verified on Trustpilot
I almost bought a 2019 Malibu that seemed like a great deal - low miles and price. But the badvin report showed it used to be a rental fleet vehicle, which the seller didn't disclose. Glad I found out before buying someone else's abused rental!
Benjamin Torres
verified on Trustpilot
As a broke college kid I almost settled for a sketchy 2005 Altima cuz it was cheap. but splurged on the report from badvin 1st. soooo glad I did - turned out it had been totalled and rebuilt. spending a little saved me from wasting $1000s!
Sophie
verified on Trustpilot
I buy rebuilt title cars at copart to fix and resell. was hoping BadVin reports wud have more detail on damage history to help me value cars before bidding, Carfax is better for that. but for clean title vehicles it seems pretty useful
Fatima
verified on Trustpilot
Compare to other 2018 TOYOTA TUNDRA


Other vehicles sales records


Frequently asked questions
The Monroney label can indirectly reflect the resale value of 2018 TOYOTA vehicles by detailing features and specifications that are valued in the used car market.
Yes, by law, all new 2018 TOYOTA vehicles are required to display a Monroney label to provide clear pricing and feature information to consumers.
Most VIN decoders do not provide color information as this is not typically encoded in the VIN; color information is usually obtained from vehicle registration documents or manufacturer records.
Market value is generally estimated based on the 2018 TOYOTA vehicle’s history, condition, and comparable sales, helping to provide a guideline for buyers and sellers, though specific values can vary.
Discrepancies between a window sticker and actual dealer pricing can occur due to additional dealer markup, optional add-ons not included in the sticker, or regional pricing differences.
Mileage data, collected over time, helps verify the actual use and condition of the 2018 TOYOTA vehicle, indicating wear and potential issues, if accurately recorded.


