
BADVIN vehicle history report for
2010 TOYOTA TUNDRAVIN: 5TFUY5F17AX131992
Get FULL ACCESS to the vehicle history report and see all blurred info.
⭐ Read 206+ reviews from our customers who used BADVIN to avoid buying junk vehicles.
Historical Records
events
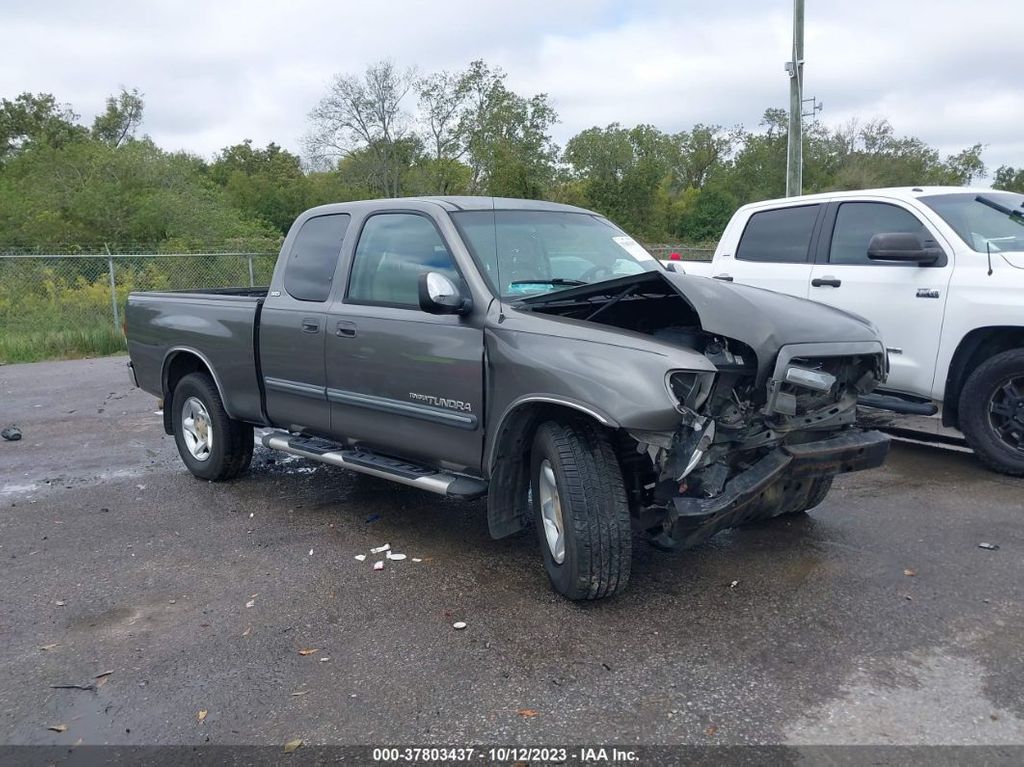
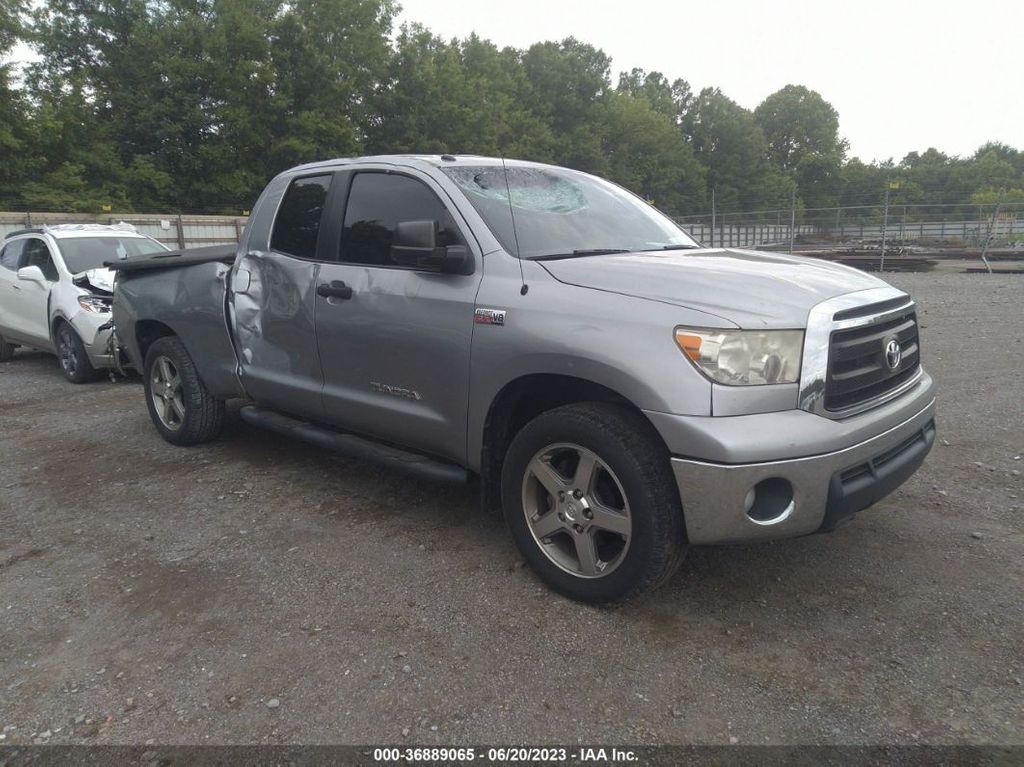
Photos
11 images
Sales History
1 records
Sale Prices
2 records
Market report
Price analytics
Historical Records
Historical records may include service and maintenance records, title status (clean, junk, salvage), insurance records, number of owners, registration events and states, and other information.
You can find more information about historical records in BADVIN reports and see more examples here.
Available historical records for VIN 5TFUY5F17AX131992
Latest reported mileage: 949 mi
Below you can see some examples of what these records could look like.
2023-05-17
a year ago
113,401 mi
Odometer reading reported
2022-02-03
2 years ago
8,581 mi
Vehicle serviced
40,000 mile service performed
40,000 mile service performed
2019-11-16
5 years ago
40,798 mi
Passed emissions inspection
| Year | 2010 |
| Title | Hidden text |
| ODO | 6884 mi (Hidden text) |
| Loss | Hidden text |
| Damage | Hidden text |
| Estimated Retail Value | $9321 |
| Seller | Hidden text |
| Location | Boston - Shirley, MA, 01464 |
| Date | ended 2 years ago sold for $9696 |
| Sale Website Type | salvage or insurance auction |
sale information provided by user #617353


All photos above are REAL and display ACTUAL car. After you get the report you will see full resolution photos.
Tech Specs
| Color | Silver, Gray |
| Transmission | Automatic Transmission |
| Engine | 5.7L DOHC 32-VALVE I-FORCE V8 |
| Cylinders | 8 Cylinders |
| Drive | 4X4 Drive |
| Fuel Type | Gasoline |
Model Analytics & Market Report
We've analyzed more than 28,400 sales records of this model and here are some numbers.
The average price for new (MSRP) 2010 TOYOTA TUNDRA in 2010 was $50,857.
The average price for used 2010 TOYOTA TUNDRA nowadays in 2024 is $16,635 which is 33% from the original price.
Estimated mileage driven per year is 11,272 miles.
For this model we also have depreciation curve, photos, list of features and options, and other analytics.
Take a look at 2010 TOYOTA TUNDRA model page in BADVIN vehicles catalog.
Depreciation
The graph below is a depreciation curve for 2010 TOYOTA TUNDRA. It shows how much this model looses per year in price. This analytics is calculated using sales records from BADVIN database.
The table below shows average price for used 2010 TOYOTA TUNDRA in each year since the year of manufacturing, current year price and projected price in the future years.
You can scroll the table horizontally to see all columns.
| Year | Average Mileage | Average Price | % Left | % Lost | ||
|---|---|---|---|---|---|---|
| 2010 MSRP | 0 mi | $50,857 | — | — | 100% | 0% |
| 2010 | 11,272 mi | $59,999 | −$9,142 | −17.98% | 117.98% | -17.98% |
| 2011 | 22,544 mi | $56,989 | +$3,010 | +5.02% | 112.06% | -12.06% |
| 2012 | 33,816 mi | $48,974 | +$8,015 | +14.06% | 96.3% | 3.7% |
| 2013 | 45,088 mi | $42,729 | +$6,245 | +12.75% | 84.02% | 15.98% |
| 2014 | 56,360 mi | $40,764 | +$1,965 | +4.6% | 80.15% | 19.85% |
| → Visit 2010 TOYOTA TUNDRA depreciation page to see full data. | ||||||
Price vs Mileage
The graph below shows how mileage affects the price for 2010 TOYOTA TUNDRA. This data was calculated using sales records from BADVIN database.
The table below shows average price for used 2010 TOYOTA TUNDRA by mileage and number of sales.
You can scroll the table horizontally to see all columns.
| Mileage | Average Price | Sample Size |
|---|---|---|
| 25,000 mi | $24,999 | 13 sales |
| 35,000 mi | $22,996 | 12 sales |
| 40,000 mi | $22,849 | 13 sales |
| 45,000 mi | $24,950 | 19 sales |
| 50,000 mi | $23,999 | 30 sales |
| 55,000 mi | $23,495 | 22 sales |
| → Visit 2010 TOYOTA TUNDRA depreciation page to see full data. | ||
Get FULL ACCESS to the vehicle history report and see all blurred info.
⭐ Read 206+ reviews from our customers who used BADVIN to avoid buying junk vehicles.
Testimonials from our customers
Bad Vin's vehicle history report showed that the 2018 Audi A4 I was about to buy had been in a major accident that was not disclosed by the seller. The severity analysis helped me avoid a bad purchase. Great service!

Sophie Dubois
verified on Trustpilot
I almost bought a 2019 Malibu that seemed like a great deal - low miles and price. But the badvin report showed it used to be a rental fleet vehicle, which the seller didn't disclose. Glad I found out before buying someone else's abused rental!
Benjamin Torres
verified on Trustpilot
I've tried many vehicle reports but badvin's is by far the most comprehensive. It shows accident photos, past sales, repairs and so much more. I won't buy a car now without getting a report first. It's a must-have.
Alexander Hunt
verified on Trustpilot
Purchased a badvin report before buying a used Lexus RX 350. It revealed a minor accident the seller hadn't mentioned. I still bought the car but used the info to negotiate a lower price. Well worth the cost for the leverage it gave me!
Aiden Patel
verified on Trustpilot
Compare to other 2010 TOYOTA TUNDRA

2018 TOYOTA TUNDRA
in 2 days, 140,132 mi
est retail value $27,519
buy now price $12,375
VIN 5TFUY5F14JX772694


Other vehicles sales records


2006 TOYOTA MATRIX
in a day, 205,033 mi
est retail value $2,525
buy now price $1,325
VIN 2T1KR32EX6C622676


2022 TOYOTA TUNDRA
25 days ago, 51,422 mi
est retail value $56,232
sold for $31,075
VIN 5TFJA5DB8NX033546


2013 BUICK LACROSSE
in a day, 121,012 mi
est retail value $4,700
buy now price $1,100
VIN 1G4GF5E37DF189001


2011 HYUNDAI ELANTRA
in a day, 210,969 mi
est retail value $2,475
buy now price $850
VIN 5NPDH4AE5BH005826
Frequently asked questions
Safety recall reports, if available, detail the nature of the defect, risk severity, and recommended actions, ensuring the safety and reliability of the 2010 TOYOTA vehicle.
To possibly get a vehicle history report by VIN, you can enter the VIN on our website's search tool; the availability and detail of the report will depend on the data accessible for that specific VIN.
Yes, the fuel type of a vehicle is listed on the window sticker, providing important information for buyers about whether the car operates on gasoline, diesel, electricity, or hybrid technology.
Discrepancies between a window sticker and actual dealer pricing can occur due to additional dealer markup, optional add-ons not included in the sticker, or regional pricing differences.
To find the correct VIN, check multiple locations where it is typically displayed, such as the dashboard, driver's door jamb, and vehicle registration documents, ensuring all instances match exactly.
A hazardous label, if applied, indicates significant safety risks, potentially from accidents or chemical exposure, critical for the safety evaluation of the 2010 TOYOTA.
Sales prices from past transactions may be documented in our reports, providing a price history that aids in determining current market value, if such data is available.
A VIN decoder can reveal engine details such as the engine size, configuration, and fuel type, which are encoded in specific characters of the VIN.


