
BADVIN vehicle history report for
2016 TOYOTA TUNDRAVIN: 5TFRW5F1XGX204342
Get FULL ACCESS to the vehicle history report and see all blurred info.
⭐ Read 205+ reviews from our customers who used BADVIN to avoid buying junk vehicles.
Historical Records
events
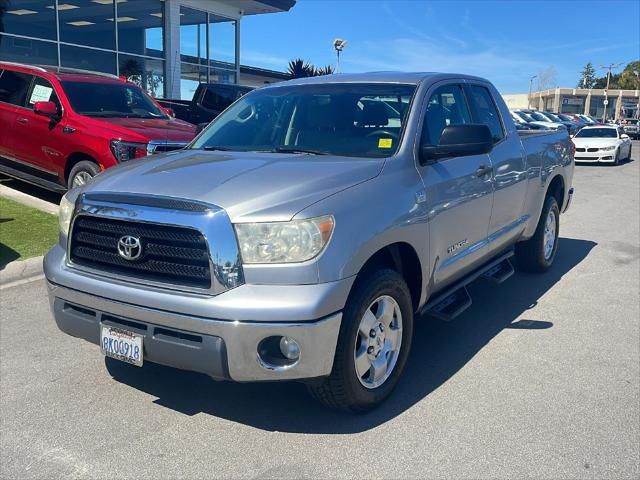
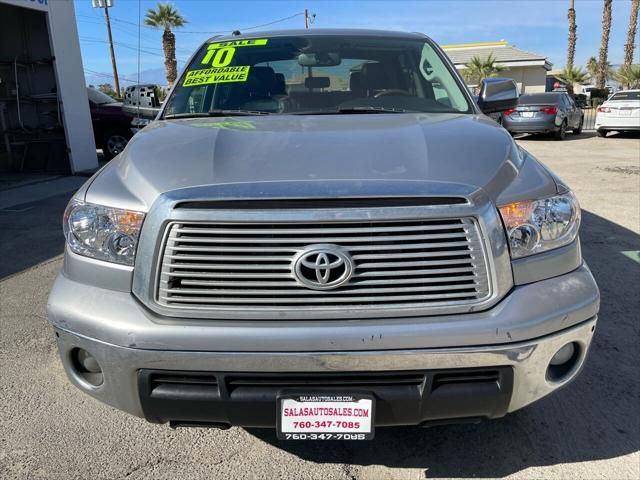
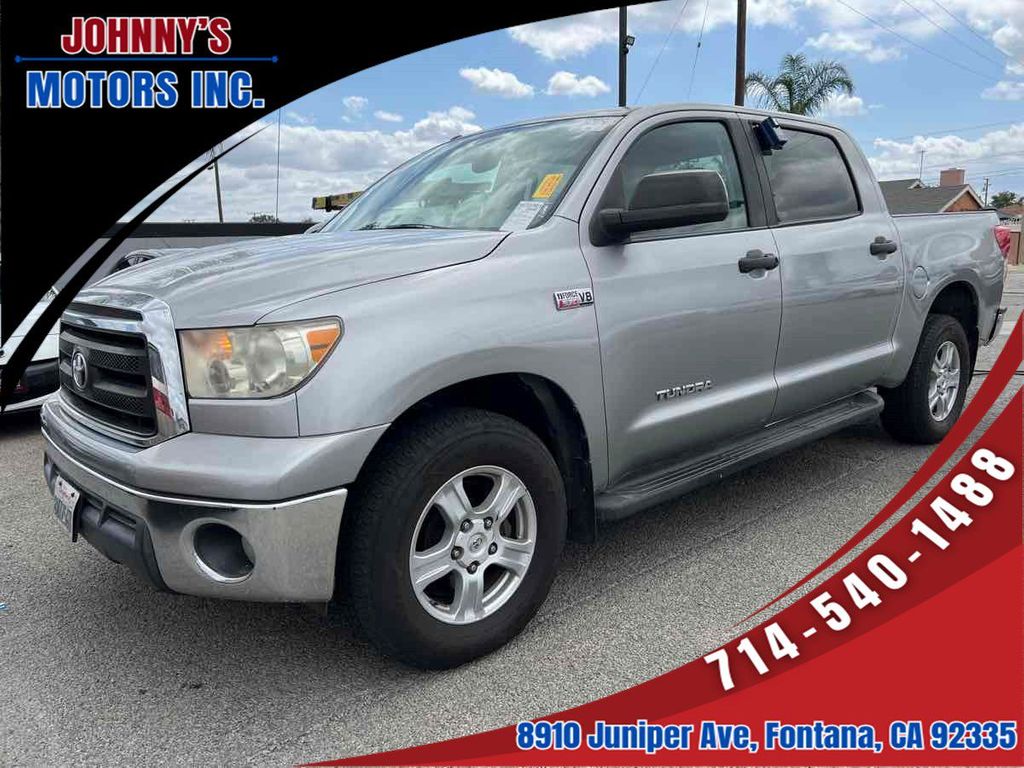
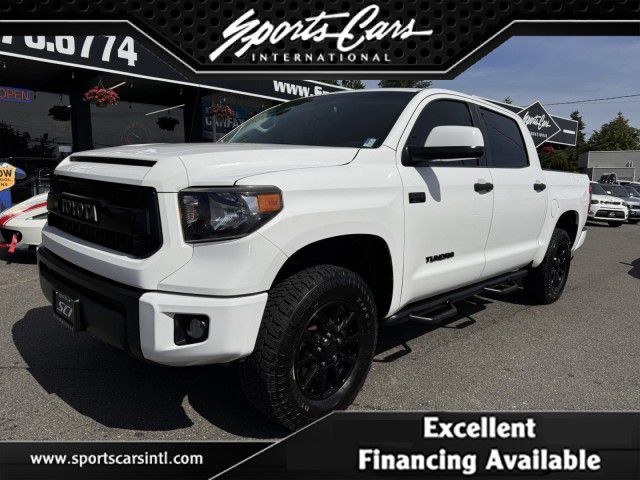
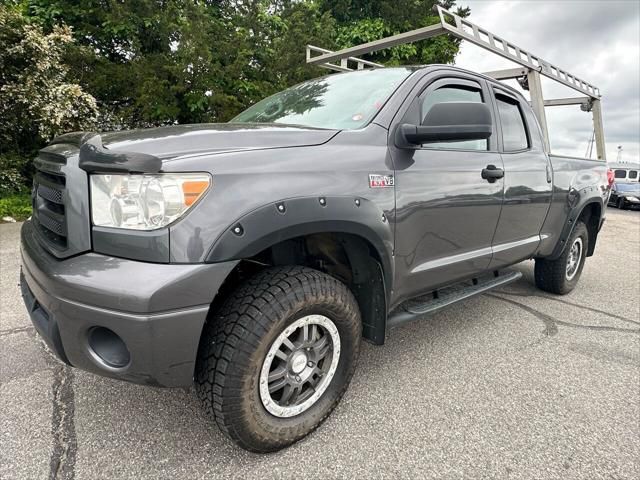
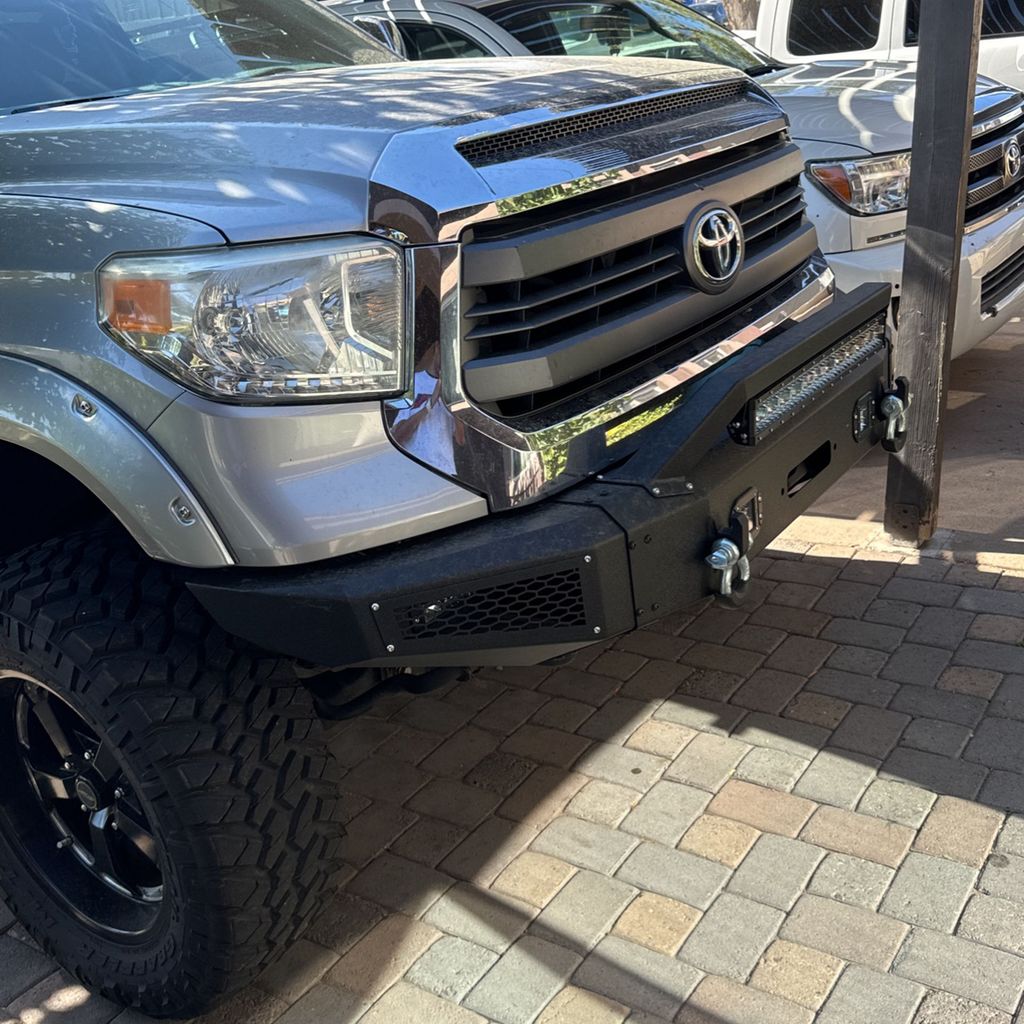
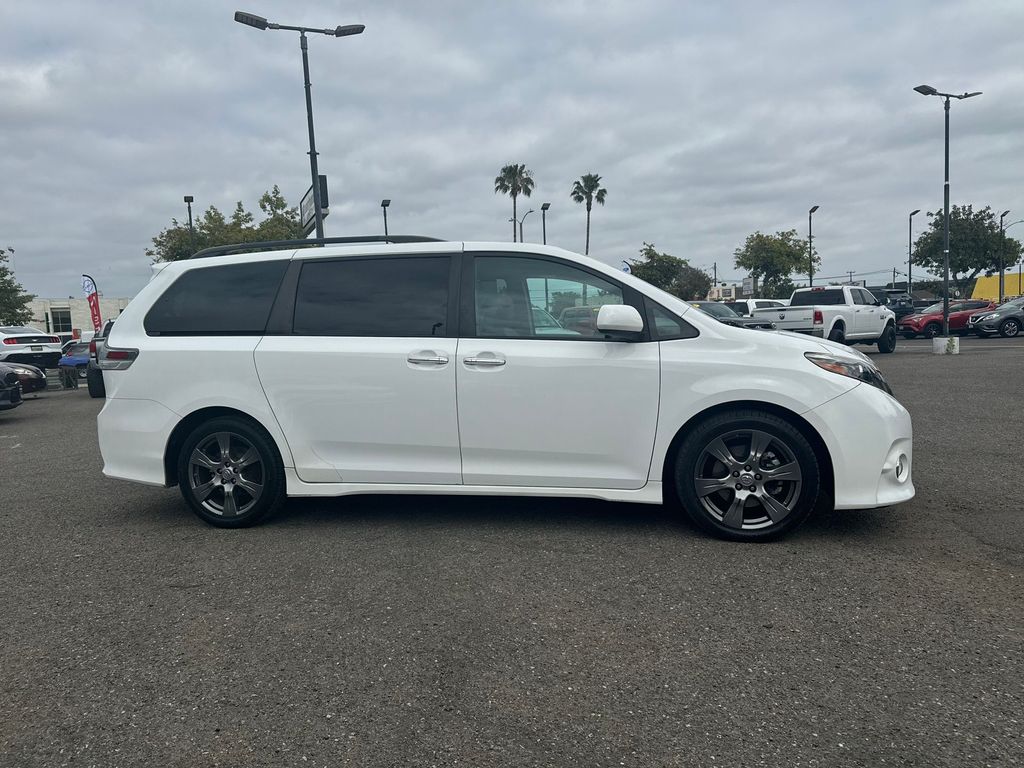
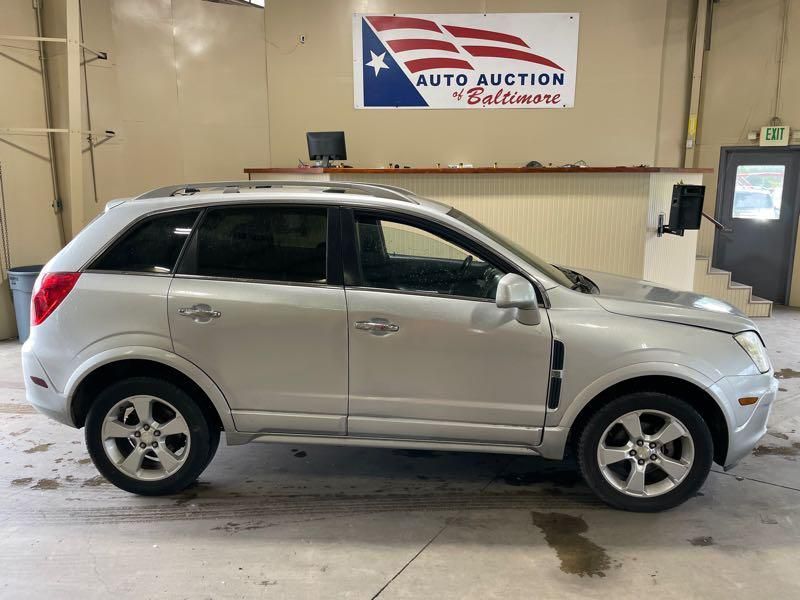
Photos
12 images
Sales History
1 records
Sale Prices
1 records
Market report
Price analytics
Historical Records
Historical records may include service and maintenance records, title status (clean, junk, salvage), insurance records, number of owners, registration events and states, and other information.
You can find more information about historical records in BADVIN reports and see more examples here.
Available historical records for VIN 5TFRW5F1XGX204342
Latest reported mileage: 521 mi
Below you can see some examples of what these records could look like.
2022-11-11
2 years ago
131,103 mi
New owner reported
REBUILT TITLE ISSUED
REBUILT TITLE ISSUED
2022-02-28
2 years ago
6,405 mi
NOT ACTUAL MILEAGE TITLE ISSUED
Titled or registered as lease vehicle
Titled or registered as lease vehicle
2020-03-02
4 years ago
29,592 mi
Vehicle serviced
Tire repaired
Tire repaired
2016 Toyota Tundra
| Year | 2016 |
| ODO | 5509 mi |
| Seller | Hidden text (Hidden text) |
| Location | Houston, TX, 77041 |
| Date | appeared 2 days ago latest price $5971 |
| Sale Website Type | classifieds |
| Notes | |
| 8271 | |
sale information provided by user #147160


All photos above are REAL and display ACTUAL car. After you get the report you will see full resolution photos.
Tech Specs
| Body Style | Double Cab |
| Color | silver |
| Cylinders | 8 |
| Drive | 2WD |
| Fuel Type | Regular Unleaded |
Model Analytics & Market Report
We've analyzed more than 72,400 sales records of this model and here are some numbers.
The average price for new (MSRP) 2016 TOYOTA TUNDRA in 2016 was $50,857.
The average price for used 2016 TOYOTA TUNDRA nowadays in 2024 is $29,981 which is 59% from the original price.
Estimated mileage driven per year is 11,272 miles.
For this model we also have depreciation curve, photos, list of features and options, and other analytics.
Take a look at 2016 TOYOTA TUNDRA model page in BADVIN vehicles catalog.
Depreciation
The graph below is a depreciation curve for 2016 TOYOTA TUNDRA. It shows how much this model looses per year in price. This analytics is calculated using sales records from BADVIN database.
The table below shows average price for used 2016 TOYOTA TUNDRA in each year since the year of manufacturing, current year price and projected price in the future years.
You can scroll the table horizontally to see all columns.
| Year | Average Mileage | Average Price | % Left | % Lost | ||
|---|---|---|---|---|---|---|
| 2016 MSRP | 0 mi | $50,857 | — | — | 100% | 0% |
| 2016 | 11,272 mi | $59,999 | −$9,142 | −17.98% | 117.98% | -17.98% |
| 2017 | 22,544 mi | $56,989 | +$3,010 | +5.02% | 112.06% | -12.06% |
| 2018 | 33,816 mi | $48,974 | +$8,015 | +14.06% | 96.3% | 3.7% |
| 2019 | 45,088 mi | $42,729 | +$6,245 | +12.75% | 84.02% | 15.98% |
| 2020 | 56,360 mi | $40,764 | +$1,965 | +4.6% | 80.15% | 19.85% |
| → Visit 2016 TOYOTA TUNDRA depreciation page to see full data. | ||||||
Price vs Mileage
The graph below shows how mileage affects the price for 2016 TOYOTA TUNDRA. This data was calculated using sales records from BADVIN database.
The table below shows average price for used 2016 TOYOTA TUNDRA by mileage and number of sales.
You can scroll the table horizontally to see all columns.
| Mileage | Average Price | Sample Size |
|---|---|---|
| 10,000 mi | $42,995 | 17 sales |
| 15,000 mi | $38,500 | 23 sales |
| 20,000 mi | $37,000 | 19 sales |
| 25,000 mi | $35,950 | 37 sales |
| 30,000 mi | $36,900 | 57 sales |
| 35,000 mi | $37,543 | 77 sales |
| → Visit 2016 TOYOTA TUNDRA depreciation page to see full data. | ||
Get FULL ACCESS to the vehicle history report and see all blurred info.
⭐ Read 205+ reviews from our customers who used BADVIN to avoid buying junk vehicles.
Testimonials from our customers
After a bad experience buying a used car that turned out to have major issues, I now use Bad VIN to thoroughly check every vehicle i consider. It costs a bit more than other services but the detailed records and photos of past sales are wotrh it for the added peace of mind.

Olivia Johnson
verified on Trustpilot
Was shopping for a used Range Rover and found one that seemed suspiciously cheap. The badVIN report revealed it had been in a major front end collision, with photos showing the damage. Steered clear of that one and saved myself a ton of headaches!!
Ava Patel
verified on Trustpilot
Report showed a car I was considering had a prior salvage title from a major accident, even though carfax listed it as clean. Messaged seller asking about it and they made shady excuses. Def avoided a scam thanks to badvin!
Mia Johnson
verified on Trustpilot
Bad Vin's vehicle history report showed that the 2018 Audi A4 I was about to buy had been in a major accident that was not disclosed by the seller. The severity analysis helped me avoid a bad purchase. Great service!
Sophie Dubois
verified on Trustpilot
Compare to other 2016 TOYOTA TUNDRA


Other vehicles sales records


Frequently asked questions
The pricing information on a Monroney label for 2016 TOYOTA TUNDRA is very detailed, including the base price, cost of added options, destination charges, and any additional fees.
Information on structural damage, including the extent and location of the damage, may be detailed in our vehicle history reports for 2016 TOYOTA vehicles, if available.
When buying a car, consider models with strong resale histories, opt for popular color and feature options, and evaluate current market trends for the best value retention.
To maximize value, consider buying a vehicle that is a few years old, as it has already undergone significant depreciation but likely remains reliable.
A lemon title, if issued, indicates repeated, unfixable issues, significantly affecting the usability and resale value of the 2016 TOYOTA TUNDRA, if such a title is applied.
You can track the depreciation of your car by monitoring market trends, checking online valuation tools, and staying informed about new model releases.
Registration information, if available, includes current and historical registration data, offering insights into the 2016 TOYOTA TUNDRA's ownership timeline.


