
BADVIN vehicle history report for
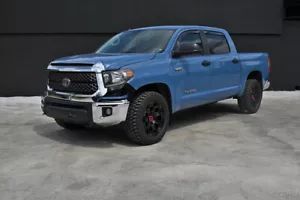
2018 TOYOTA TUNDRAVIN: 5TFFY5F18JX243838
Get FULL ACCESS to the vehicle history report and see all blurred info.
⭐ Read 206+ reviews from our customers who used BADVIN to avoid buying junk vehicles.
Historical Records
events
Photos
12 images
Sales History
1 records
Sale Prices
1 records
Market report
Price analytics
Historical Records
Historical records may include service and maintenance records, title status (clean, junk, salvage), insurance records, number of owners, registration events and states, and other information.
You can find more information about historical records in BADVIN reports and see more examples here.
Available historical records for VIN 5TFFY5F18JX243838
Latest reported mileage: 866 mi
Below you can see some examples of what these records could look like.
2023-01-20
a year ago
82,045 mi
Vehicle serviced
Outer tie rod(s) replaced
Alignment performed
Outer tie rod(s) replaced
Alignment performed
2022-05-04
2 years ago
10,931 mi
Passed emissions inspection
2020-04-15
4 years ago
27,692 mi
TOTAL LOSS VEHICLE
Vehicle declared a total loss by an insurance company
Collision damage reported
Vehicle declared a total loss by an insurance company
Collision damage reported
Sale Record
6322
| Year | 2018 |
| Title | Hidden text |
| ODO | 4590 mi |
| Condition | Hidden text |
| Seller | Hidden text (Hidden text) |
| Location | Buford, GA, 30518 |
| Date | ended 3 years ago |
| Sale Website Type | classifieds |
sale information provided by user #183803


All photos above are REAL and display ACTUAL car. After you get the report you will see full resolution photos.
Tech Specs
| Body Style | Crew Cab Pickup |
| Color | Gray |
| Transmission | Automatic |
| Engine | Regular Unleaded V-8 5.7 L/346 |
| Drive | SR5 CrewMax 5.5' Bed 5.7L (SE) |
| Fuel Type | Gasoline |
Model Analytics & Market Report
We've analyzed more than 102,800 sales records of this model and here are some numbers.
The average price for new (MSRP) 2018 TOYOTA TUNDRA in 2018 was $50,857.
The average price for used 2018 TOYOTA TUNDRA nowadays in 2024 is $35,499 which is 70% from the original price.
Estimated mileage driven per year is 11,272 miles.
For this model we also have depreciation curve, photos, list of features and options, and other analytics.
Take a look at 2018 TOYOTA TUNDRA model page in BADVIN vehicles catalog.
Depreciation
The graph below is a depreciation curve for 2018 TOYOTA TUNDRA. It shows how much this model looses per year in price. This analytics is calculated using sales records from BADVIN database.
The table below shows average price for used 2018 TOYOTA TUNDRA in each year since the year of manufacturing, current year price and projected price in the future years.
You can scroll the table horizontally to see all columns.
| Year | Average Mileage | Average Price | % Left | % Lost | ||
|---|---|---|---|---|---|---|
| 2018 MSRP | 0 mi | $50,857 | — | — | 100% | 0% |
| 2018 | 11,272 mi | $59,999 | −$9,142 | −17.98% | 117.98% | -17.98% |
| 2019 | 22,544 mi | $56,989 | +$3,010 | +5.02% | 112.06% | -12.06% |
| 2020 | 33,816 mi | $48,974 | +$8,015 | +14.06% | 96.3% | 3.7% |
| 2021 | 45,088 mi | $42,729 | +$6,245 | +12.75% | 84.02% | 15.98% |
| 2022 | 56,360 mi | $40,764 | +$1,965 | +4.6% | 80.15% | 19.85% |
| → Visit 2018 TOYOTA TUNDRA depreciation page to see full data. | ||||||
Price vs Mileage
The graph below shows how mileage affects the price for 2018 TOYOTA TUNDRA. This data was calculated using sales records from BADVIN database.
The table below shows average price for used 2018 TOYOTA TUNDRA by mileage and number of sales.
You can scroll the table horizontally to see all columns.
| Mileage | Average Price | Sample Size |
|---|---|---|
| 5,000 mi | $45,000 | 15 sales |
| 10,000 mi | $45,490 | 19 sales |
| 15,000 mi | $39,938 | 48 sales |
| 20,000 mi | $41,988 | 63 sales |
| 25,000 mi | $42,731 | 124 sales |
| 30,000 mi | $39,958 | 184 sales |
| → Visit 2018 TOYOTA TUNDRA depreciation page to see full data. | ||
Get FULL ACCESS to the vehicle history report and see all blurred info.
⭐ Read 206+ reviews from our customers who used BADVIN to avoid buying junk vehicles.
Testimonials from our customers
Ich hätte fast einen 2017 Mercedes-Benz C300 gekauft, bis der Bad Vin-Bericht zeigte, dass er als durch Überschwemmung beschädigt gemeldet wurde. Die detaillierten Schadensaufzeichnungen haben mich vor einem großen Fehler bewahrt!

Sophia Müller
verified on Trustpilot
Was shopping for a used Range Rover and found one that seemed suspiciously cheap. The badVIN report revealed it had been in a major front end collision, with photos showing the damage. Steered clear of that one and saved myself a ton of headaches!!
Ava Patel
verified on Trustpilot
I almost bought a used Honda but luckily checked the BadVin report first. Turned out it had a salvage title from flood damage that the seller didn't disclose. Phew, dodged a huge issue!
Emily Turner
verified on Trustpilot
Was about to buy a used 2016 Camry but decided to get the badvin report first. Turns out the car had been in a serious crash and was declared a total loss by insurance, even tho carfax showed it as clean! Dodged a bullet on that one. ty badvin
Jessica Nguyen
verified on Trustpilot
Compare to other 2018 TOYOTA TUNDRA


Other vehicles sales records


Frequently asked questions
Repossession records, if included, indicate if the 2018 TOYOTA vehicle has been taken back by a lender due to payment defaults, which might affect its condition and value.
Information from junk yards and salvage auctions may detail major damage and repairs, potentially impacting the 2018 TOYOTA TUNDRA's value and safety, depending on the records obtained.
Reports might include collision data, crash ratings, vehicle specifications from VIN decode, and more, providing a detailed profile of the 2018 TOYOTA vehicle, depending on data availability.
The window sticker plays a crucial role in the car buying process by ensuring transparency about the vehicle's features, costs, and certifications, aiding consumers in making informed purchasing decisions.
A 2018 TOYOTA TUNDRA window sticker includes information such as MSRP, fuel efficiency, safety ratings, and optional equipment.
Hail damage, if noted, is detailed with specifics on the impact to the body and glass, which can affect the aesthetic and structural integrity of the 2018 TOYOTA.
A window sticker provides detailed information about a vehicle's fuel economy, including city, highway, and combined mpg figures, helping buyers understand expected fuel costs.
The economic climate can significantly affect the depreciation of vehicles, with higher demand and better economic conditions typically slowing depreciation rates.


