
BADVIN vehicle history report for
2018 TOYOTA TUNDRAVIN: 5TFEM5F12JX130037
Get FULL ACCESS to the vehicle history report and see all blurred info.
⭐ Read 206+ reviews from our customers who used BADVIN to avoid buying junk vehicles.
Historical Records
events
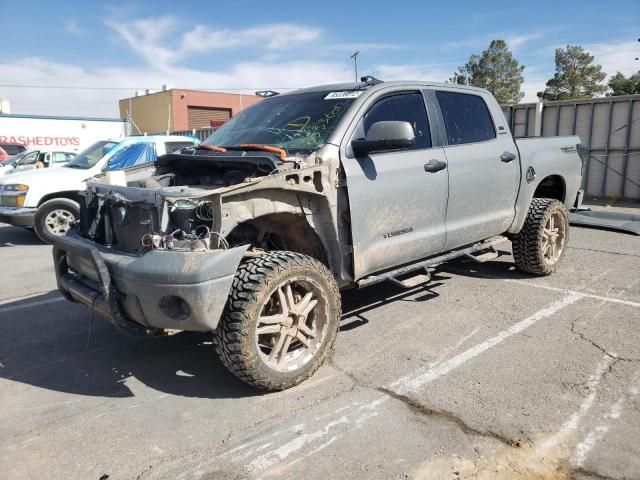
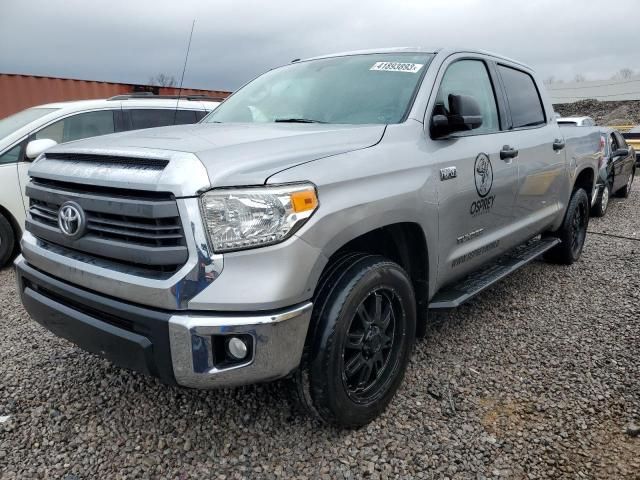
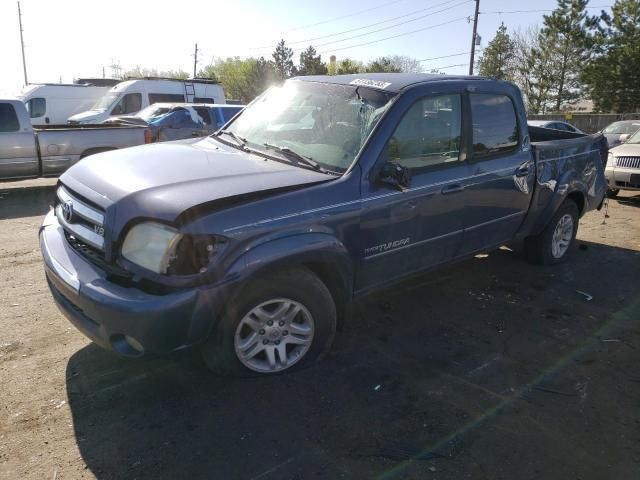
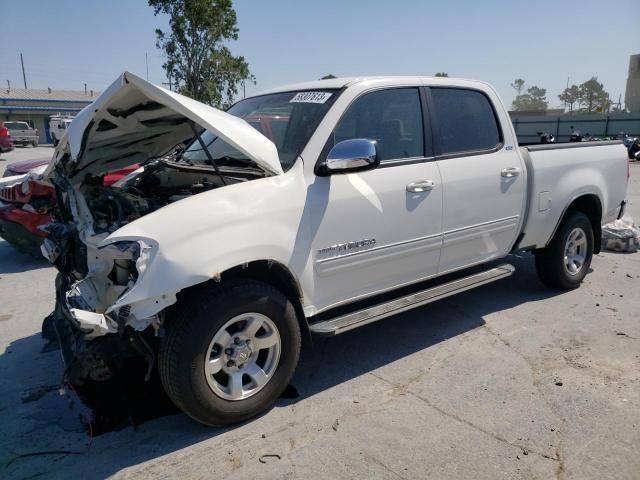
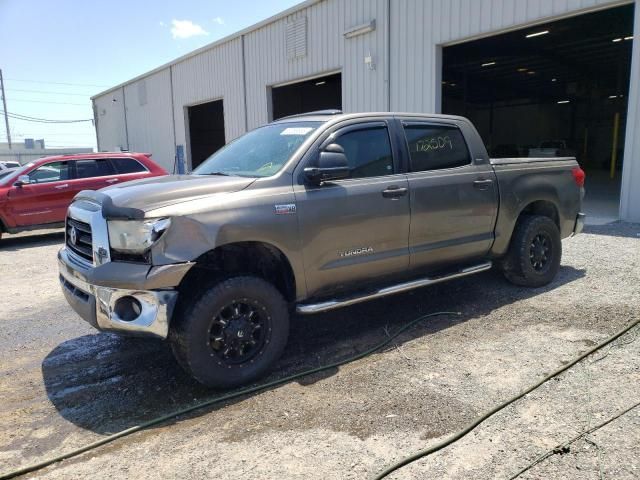
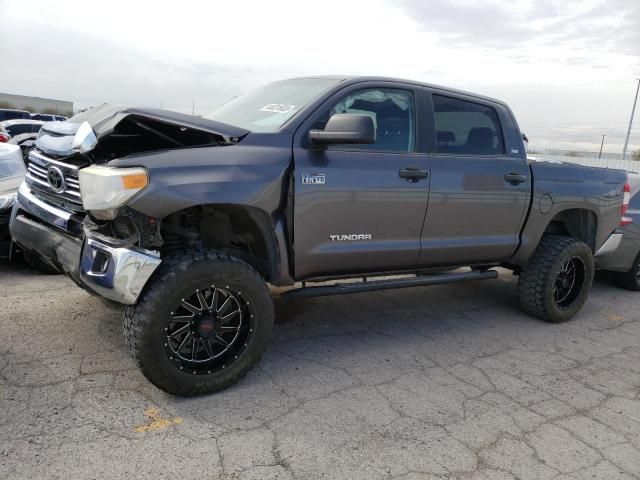
Photos
9 images
Sales History
1 records
Sale Prices
1 records
Market report
Price analytics
Historical Records
Historical records may include service and maintenance records, title status (clean, junk, salvage), insurance records, number of owners, registration events and states, and other information.
You can find more information about historical records in BADVIN reports and see more examples here.
Available historical records for VIN 5TFEM5F12JX130037
Latest reported mileage: 216 mi
Below you can see some examples of what these records could look like.
2022-12-25
a year ago
121,099 mi
Vehicle sold
MILEAGE INCONSISTENCY
MILEAGE INCONSISTENCY
2022-07-09
2 years ago
6,086 mi
SALVAGE TITLE/CERTIFICATE ISSUED
2019-07-10
5 years ago
49,783 mi
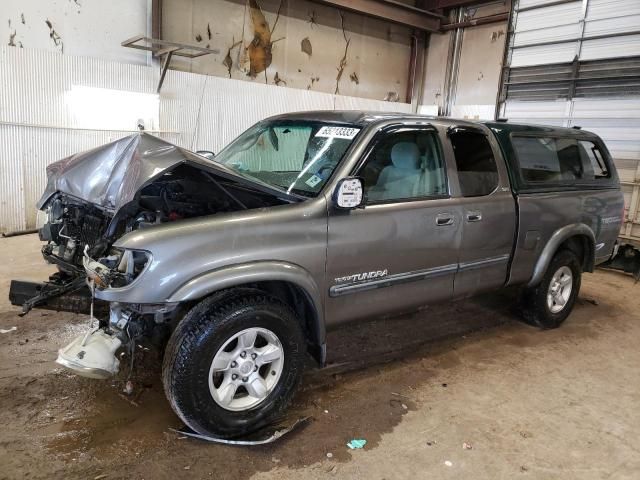
Accident reported
Vehicle involved in a sideswipe collision with another motor vehicle
Airbag deployed
Vehicle involved in a sideswipe collision with another motor vehicle
Airbag deployed
2018 TOYOTA TUNDRA CREWMAX SR5
sold
| Year | 2018 |
| Title | Hidden text (Hidden text) |
| ODO | 9620 mi (Hidden text) |
| Damage | Hidden text, Hidden text |
| Estimated Retail Value | $6417 |
| Estimated Repair Cost | $8310 (208%) |
| Seller | Hidden text |
| Location | San Antonio, TX, 78233 |
| Date | ended 2 years ago |
| Sale Website Type | salvage or insurance auction |
sale information provided by user #282356


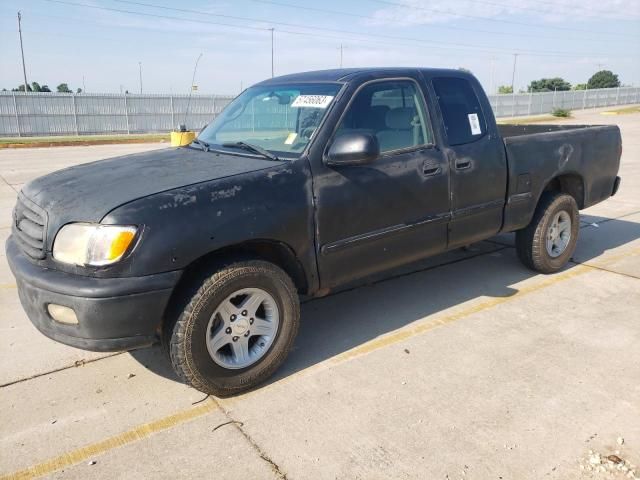
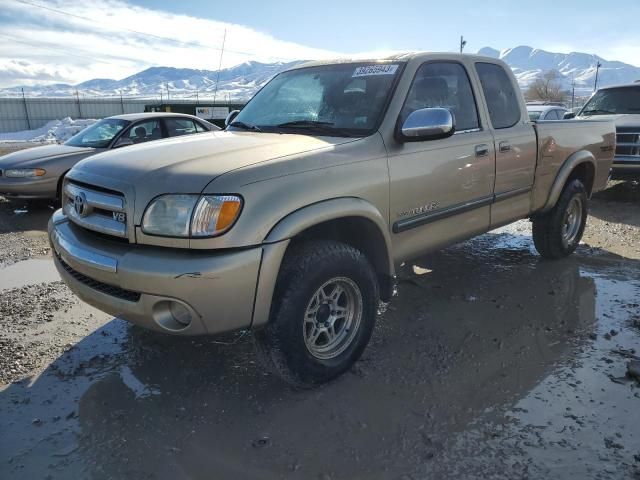
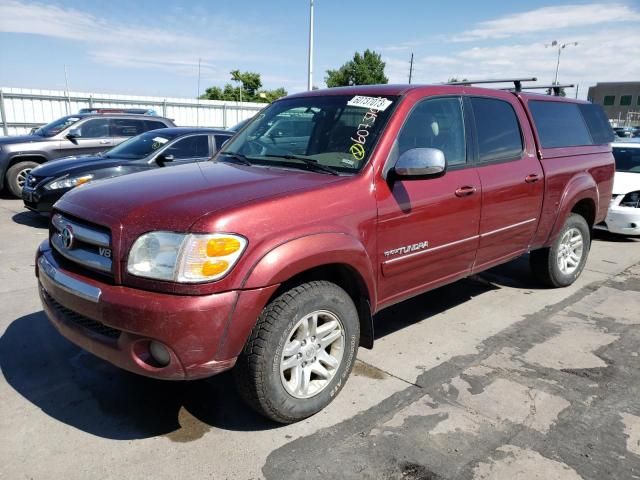
All photos above are REAL and display ACTUAL car. After you get the report you will see full resolution photos.
Tech Specs
| Color | GRAY |
| Transmission | AUTOMATIC |
| Engine | 4.6L 8 |
| Drive | Rear-wheel drive |
| Fuel Type | GAS |
Model Analytics & Market Report
We've analyzed more than 102,800 sales records of this model and here are some numbers.
The average price for new (MSRP) 2018 TOYOTA TUNDRA in 2018 was $50,857.
The average price for used 2018 TOYOTA TUNDRA nowadays in 2024 is $35,499 which is 70% from the original price.
Estimated mileage driven per year is 11,272 miles.
For this model we also have depreciation curve, photos, list of features and options, and other analytics.
Take a look at 2018 TOYOTA TUNDRA model page in BADVIN vehicles catalog.
Depreciation
The graph below is a depreciation curve for 2018 TOYOTA TUNDRA. It shows how much this model looses per year in price. This analytics is calculated using sales records from BADVIN database.
The table below shows average price for used 2018 TOYOTA TUNDRA in each year since the year of manufacturing, current year price and projected price in the future years.
You can scroll the table horizontally to see all columns.
| Year | Average Mileage | Average Price | % Left | % Lost | ||
|---|---|---|---|---|---|---|
| 2018 MSRP | 0 mi | $50,857 | — | — | 100% | 0% |
| 2018 | 11,272 mi | $59,999 | −$9,142 | −17.98% | 117.98% | -17.98% |
| 2019 | 22,544 mi | $56,989 | +$3,010 | +5.02% | 112.06% | -12.06% |
| 2020 | 33,816 mi | $48,974 | +$8,015 | +14.06% | 96.3% | 3.7% |
| 2021 | 45,088 mi | $42,729 | +$6,245 | +12.75% | 84.02% | 15.98% |
| 2022 | 56,360 mi | $40,764 | +$1,965 | +4.6% | 80.15% | 19.85% |
| → Visit 2018 TOYOTA TUNDRA depreciation page to see full data. | ||||||
Price vs Mileage
The graph below shows how mileage affects the price for 2018 TOYOTA TUNDRA. This data was calculated using sales records from BADVIN database.
The table below shows average price for used 2018 TOYOTA TUNDRA by mileage and number of sales.
You can scroll the table horizontally to see all columns.
| Mileage | Average Price | Sample Size |
|---|---|---|
| 5,000 mi | $45,000 | 15 sales |
| 10,000 mi | $45,490 | 19 sales |
| 15,000 mi | $39,938 | 48 sales |
| 20,000 mi | $41,988 | 63 sales |
| 25,000 mi | $42,731 | 124 sales |
| 30,000 mi | $39,958 | 184 sales |
| → Visit 2018 TOYOTA TUNDRA depreciation page to see full data. | ||
Get FULL ACCESS to the vehicle history report and see all blurred info.
⭐ Read 206+ reviews from our customers who used BADVIN to avoid buying junk vehicles.
Testimonials from our customers
Ich hätte fast einen 2017 Mercedes-Benz C300 gekauft, bis der Bad Vin-Bericht zeigte, dass er als durch Überschwemmung beschädigt gemeldet wurde. Die detaillierten Schadensaufzeichnungen haben mich vor einem großen Fehler bewahrt!

Sophia Müller
verified on Trustpilot
I've tried a bunch of different vehicle history reports over the years and badvin.org has been the most comprehensive by far. Stuff like service records, ownership history, lien and repo info that I haven't found elsewhere. Def go-to resource when shopping for used vehicles now.
Levi Johnson
verified on Trustpilot
I buy rebuilt title cars at copart to fix and resell. was hoping BadVin reports wud have more detail on damage history to help me value cars before bidding, Carfax is better for that. but for clean title vehicles it seems pretty useful
Fatima
verified on Trustpilot
As a first time used car buyer, I was nervous about getting ripped off. The vehicle report from badvin gave me so much more confidence - it confirmed the car had a clean history and the mileage lined up. Such a relief to have that peace of mind.
Chloe Martin
verified on Trustpilot
Compare to other 2018 TOYOTA TUNDRA
2004 TOYOTA TUNDRA
20 days ago, 127,894 mi
est retail value $15,973
buy now price $1,225
VIN 5TBDT44104S439603
2016 TOYOTA TUNDRA CREWMAX
a month ago, 96,247 mi
est retail value $30,999
buy now price $10,900
VIN 5TFDY5F13GX532111
Other vehicles sales records
2020 CHEVROLET MALIBU
in a day, 58,254 mi
est retail value $21,713
buy now price $2,875
VIN 1G1ZD5ST9LF115156
2011 BMW 5 SERIES
in a day, 167,942 mi
est retail value $6,600
buy now price $2,181
VIN WBAFR1C56BC739918

2018 VOLKSWAGEN TIGUAN
in a day, 49,376 mi
est retail value $19,345
buy now price $4,300
VIN 3VV3B7AX7JM215158

Frequently asked questions
Yes, the fuel type of a vehicle is listed on the window sticker, providing important information for buyers about whether the car operates on gasoline, diesel, electricity, or hybrid technology.
The depreciation rate can be influenced by factors such as the vehicle's condition, mileage, market demand, and the pace of technological advancements in newer models.
You can find your vehicle's VIN on the dashboard on the driver's side, visible through the windshield, and on your vehicle's registration documents.
Damage severity, if reported, is classified as minor, moderate, or severe, and may provide insights into the extent of damage the 2018 TOYOTA vehicle has sustained.
Transmission replacement history, if applicable, might be detailed in our reports, providing insights into major repairs and vehicle reliability, if available.
Frame damage can indicate severe impacts and is critical to the structural integrity and safety of the 2018 TOYOTA vehicle, if such damage is documented.
Warranty returns, if documented, are detailed with reasons for returns and repairs made, providing insight into past issues with the 2018 TOYOTA vehicle.
A Monroney label, commonly known as a window sticker, provides detailed information about a vehicle's specifications, features, and pricing when new.


