
BADVIN vehicle history report for
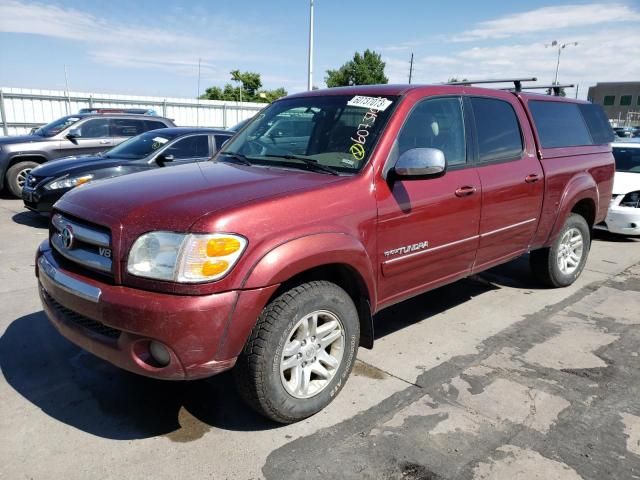
2010 TOYOTA TUNDRAVIN: 5TFDY5F15AX114382
Get FULL ACCESS to the vehicle history report and see all blurred info.
⭐ Read 206+ reviews from our customers who used BADVIN to avoid buying junk vehicles.
Historical Records
22 events
Market report
Price analytics
Historical Records
Historical records may include service and maintenance records, title status (clean, junk, salvage), insurance records, number of owners, registration events and states, and other information.
You can find more information about historical records in BADVIN reports and see more examples here.
Available 22 historical records for VIN 5TFDY5F15AX114382
Latest reported mileage: 801 mi
Below you can see some examples of what these records could look like.
2023-09-29
9 months ago
126,303 mi
Vehicle serviced
Outer tie rod(s) replaced
Alignment performed
Outer tie rod(s) replaced
Alignment performed
2021-09-17
3 years ago
12,197 mi
Fire damage reported: minor damage
Vandalism damage reported
Damage to front
Vandalism damage reported
Damage to front
2021-02-15
3 years ago
37,033 mi
SALVAGE TITLE/CERTIFICATE ISSUED
Model Analytics & Market Report
We've analyzed more than 28,400 sales records of this model and here are some numbers.
The average price for new (MSRP) 2010 TOYOTA TUNDRA in 2010 was $50,857.
The average price for used 2010 TOYOTA TUNDRA nowadays in 2024 is $16,635 which is 33% from the original price.
Estimated mileage driven per year is 11,272 miles.
For this model we also have depreciation curve, photos, list of features and options, and other analytics.
Take a look at 2010 TOYOTA TUNDRA model page in BADVIN vehicles catalog.
Depreciation
The graph below is a depreciation curve for 2010 TOYOTA TUNDRA. It shows how much this model looses per year in price. This analytics is calculated using sales records from BADVIN database.
The table below shows average price for used 2010 TOYOTA TUNDRA in each year since the year of manufacturing, current year price and projected price in the future years.
You can scroll the table horizontally to see all columns.
| Year | Average Mileage | Average Price | % Left | % Lost | ||
|---|---|---|---|---|---|---|
| 2010 MSRP | 0 mi | $50,857 | — | — | 100% | 0% |
| 2010 | 11,272 mi | $59,999 | −$9,142 | −17.98% | 117.98% | -17.98% |
| 2011 | 22,544 mi | $56,989 | +$3,010 | +5.02% | 112.06% | -12.06% |
| 2012 | 33,816 mi | $48,974 | +$8,015 | +14.06% | 96.3% | 3.7% |
| 2013 | 45,088 mi | $42,729 | +$6,245 | +12.75% | 84.02% | 15.98% |
| 2014 | 56,360 mi | $40,764 | +$1,965 | +4.6% | 80.15% | 19.85% |
| → Visit 2010 TOYOTA TUNDRA depreciation page to see full data. | ||||||
Price vs Mileage
The graph below shows how mileage affects the price for 2010 TOYOTA TUNDRA. This data was calculated using sales records from BADVIN database.
The table below shows average price for used 2010 TOYOTA TUNDRA by mileage and number of sales.
You can scroll the table horizontally to see all columns.
| Mileage | Average Price | Sample Size |
|---|---|---|
| 25,000 mi | $24,999 | 13 sales |
| 35,000 mi | $22,996 | 12 sales |
| 40,000 mi | $22,849 | 13 sales |
| 45,000 mi | $24,950 | 19 sales |
| 50,000 mi | $23,999 | 30 sales |
| 55,000 mi | $23,495 | 22 sales |
| → Visit 2010 TOYOTA TUNDRA depreciation page to see full data. | ||
Testimonials from our customers
BadVin's vehicle history report is a must-have before buying any used vehicle. It's saved me from a few lemons over the years - cars that looked great on the surface but had hidden issues like accidents or title problems. Well worth the price.

Camila Santos
verified on Trustpilot
Can't believe what badvin found on a used 2012 chevy silverado I almost bought - odometer had been rolled back 50k miles according to the mileage history! Carfax didnt show nething bout that. So glad I checked here first b4 handing over my hard earned $$
Jackson
verified on Trustpilot
After a bad experience buying a used car that turned out to have major issues, I now use Bad VIN to thoroughly check every vehicle i consider. It costs a bit more than other services but the detailed records and photos of past sales are wotrh it for the added peace of mind.
Olivia Johnson
verified on Trustpilot
As a first time used car buyer, I was nervous about getting ripped off. The vehicle report from badvin gave me so much more confidence - it confirmed the car had a clean history and the mileage lined up. Such a relief to have that peace of mind.
Chloe Martin
verified on Trustpilot
Compare to other 2010 TOYOTA TUNDRA
2004 TOYOTA TUNDRA
20 days ago, 127,894 mi
est retail value $15,973
buy now price $1,225
VIN 5TBDT44104S439603
Other vehicles sales records


Frequently asked questions
If theft records are present, it’s crucial to ensure the vehicle has been recovered and legally cleared for sale to avoid potential legal issues, depending on the accuracy of the data.
The number of previous owners, if documented, may provide insights into how multiple ownerships might have influenced the 2010 TOYOTA vehicle’s condition and maintenance.
The parts content information on a window sticker shows the percentage of vehicle components sourced from specific countries, important for consumers interested in the origin of their vehicle's parts.
Recall information may reveal if the vehicle has had any manufacturer defects that needed correction, impacting its safety and market value, depending on the completeness of recall data.
The window sticker is particularly important for electric and hybrid 2010 TOYOTA vehicles as it provides detailed information on battery range, charging times, and energy consumption.
Yes, the window sticker of a 2010 TOYOTA TUNDRA provides the EPA fuel efficiency ratings, showing expected mpg in city and highway conditions.
On average, a new car can depreciate by approximately 23% after the first year, reflecting the premium paid for new technology and immediate depreciation once it's considered used.
While a VIN decoder can provide the model year that can suggest warranty status, verifying the actual warranty status usually requires direct contact with the manufacturer or dealer.


