
BADVIN vehicle history report for
2017 TOYOTA TUNDRAVIN: 5TFDW5F18HX604413
Get FULL ACCESS to the vehicle history report and see all blurred info.
⭐ Read 206+ reviews from our customers who used BADVIN to avoid buying junk vehicles.
Historical Records
events
Photos
12 images
Sales History
1 records
Sale Prices
2 records
Market report
Price analytics
Historical Records
Historical records may include service and maintenance records, title status (clean, junk, salvage), insurance records, number of owners, registration events and states, and other information.
You can find more information about historical records in BADVIN reports and see more examples here.
Available historical records for VIN 5TFDW5F18HX604413
Latest reported mileage: 428 mi
Below you can see some examples of what these records could look like.
2023-10-16
8 months ago
34,437 mi
Odometer reading reported
2022-06-27
2 years ago
15,548 mi
TOTAL LOSS VEHICLE
Collision damage reported
Collision damage reported
2019-05-02
5 years ago
32,617 mi
Fire damage reported: minor damage
Vandalism damage reported
Damage to front
Vandalism damage reported
Damage to front
2017 Toyota Tundra SR5 4WD 5.7 8cyl. Gasoline
| Year | 2017 |
| ODO | 6903 mi (Hidden text) |
| Location | Lake Charles, LA, 70615 |
| Date | ended 3 years ago sold for $8772 |
| Sale Website Type | dealer auction |
sale information provided by user #92844


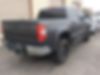
All photos above are REAL and display ACTUAL car. After you get the report you will see full resolution photos.
Tech Specs
| Color | GRAY |
| Color (Interior) | GRAY |
| Cylinders | 8 |
| Drive | 4WD |
| Fuel Type | Gasoline |
Standard Features
All these features are based on a model in general. This specific vehicle may differ.
- 4-Wheel Drive
- Hidden text
- air_conditioning
- Hidden text
- Aluminum Wheels
- Hidden text
- Auto Climate Control
- Hidden text
- Bed Liner
- Hidden text
- Cruise Control
- Hidden text
- Dual Airbags
- Hidden text
- Fog Lights
- Hidden text
- Keyless Entry
- Hidden text
- Navigation System
- Hidden text
- Power Brakes
- Hidden text
- Power Mirrors
- Hidden text
- Power Seats
- Hidden text
- Power Windows
- Hidden text
- Tilt Wheel
Model Analytics & Market Report
We've analyzed more than 89,700 sales records of this model and here are some numbers.
The average price for new (MSRP) 2017 TOYOTA TUNDRA in 2017 was $50,857.
The average price for used 2017 TOYOTA TUNDRA nowadays in 2024 is $32,990 which is 65% from the original price.
Estimated mileage driven per year is 11,272 miles.
For this model we also have depreciation curve, photos, list of features and options, and other analytics.
Take a look at 2017 TOYOTA TUNDRA model page in BADVIN vehicles catalog.
Depreciation
The graph below is a depreciation curve for 2017 TOYOTA TUNDRA. It shows how much this model looses per year in price. This analytics is calculated using sales records from BADVIN database.
The table below shows average price for used 2017 TOYOTA TUNDRA in each year since the year of manufacturing, current year price and projected price in the future years.
You can scroll the table horizontally to see all columns.
| Year | Average Mileage | Average Price | % Left | % Lost | ||
|---|---|---|---|---|---|---|
| 2017 MSRP | 0 mi | $50,857 | — | — | 100% | 0% |
| 2017 | 11,272 mi | $59,999 | −$9,142 | −17.98% | 117.98% | -17.98% |
| 2018 | 22,544 mi | $56,989 | +$3,010 | +5.02% | 112.06% | -12.06% |
| 2019 | 33,816 mi | $48,974 | +$8,015 | +14.06% | 96.3% | 3.7% |
| 2020 | 45,088 mi | $42,729 | +$6,245 | +12.75% | 84.02% | 15.98% |
| 2021 | 56,360 mi | $40,764 | +$1,965 | +4.6% | 80.15% | 19.85% |
| → Visit 2017 TOYOTA TUNDRA depreciation page to see full data. | ||||||
Price vs Mileage
The graph below shows how mileage affects the price for 2017 TOYOTA TUNDRA. This data was calculated using sales records from BADVIN database.
The table below shows average price for used 2017 TOYOTA TUNDRA by mileage and number of sales.
You can scroll the table horizontally to see all columns.
| Mileage | Average Price | Sample Size |
|---|---|---|
| 10,000 mi | $38,499 | 10 sales |
| 15,000 mi | $40,496 | 28 sales |
| 20,000 mi | $38,554 | 28 sales |
| 25,000 mi | $38,225 | 94 sales |
| 30,000 mi | $38,427 | 93 sales |
| 35,000 mi | $36,900 | 163 sales |
| → Visit 2017 TOYOTA TUNDRA depreciation page to see full data. | ||
Get FULL ACCESS to the vehicle history report and see all blurred info.
⭐ Read 206+ reviews from our customers who used BADVIN to avoid buying junk vehicles.
Testimonials from our customers
After a bad experience buying a used car that turned out to have major issues, I now use Bad VIN to thoroughly check every vehicle i consider. It costs a bit more than other services but the detailed records and photos of past sales are wotrh it for the added peace of mind.

Olivia Johnson
verified on Trustpilot
BadVin's vehicle history report is a must-have before buying any used vehicle. It's saved me from a few lemons over the years - cars that looked great on the surface but had hidden issues like accidents or title problems. Well worth the price.
Camila Santos
verified on Trustpilot
I almost bought a used Honda but luckily checked the BadVin report first. Turned out it had a salvage title from flood damage that the seller didn't disclose. Phew, dodged a huge issue!
Emily Turner
verified on Trustpilot
As a broke college kid I almost settled for a sketchy 2005 Altima cuz it was cheap. but splurged on the report from badvin 1st. soooo glad I did - turned out it had been totalled and rebuilt. spending a little saved me from wasting $1000s!
Sophie
verified on Trustpilot
Frequently asked questions
The depreciation rate can be influenced by factors such as the vehicle's condition, mileage, market demand, and the pace of technological advancements in newer models.
Frame damage can indicate severe impacts and is critical to the structural integrity and safety of the 2017 TOYOTA vehicle, if such damage is documented.
Fire damage, if reported, is detailed with specifics on affected areas and severity, important for assessing the repair quality and safety of the 2017 TOYOTA.
VIN decoding assists in insurance processes by providing accurate vehicle identification, which is crucial for policy creation, risk assessment, and claim processing.
Proper maintenance and good condition can slow the depreciation of a 2017 TOYOTA TUNDRA by making it more attractive to potential buyers, thereby preserving more of its value.
The best time of year to sell your car to minimize depreciation might be just before the release of a new model, when demand for used models could be higher.
You can find your vehicle's VIN on the dashboard on the driver's side, visible through the windshield, and on your vehicle's registration documents.
The duration each owner kept the 2017 TOYOTA may provide insights into how the vehicle was valued and maintained over its lifetime, subject to record availability.
Information from junk yards and salvage auctions may detail major damage and repairs, potentially impacting the 2017 TOYOTA TUNDRA's value and safety, depending on the records obtained.
Documentation, if available, includes details of theft and vandalism incidents, showing the extent of damage and any recovery actions taken for the 2017 TOYOTA vehicle.


