
BADVIN vehicle history report for
2017 TOYOTA HIGHLANDERVIN: 5TDDZRFH5HS405563
Get FULL ACCESS to the vehicle history report and see all blurred info.
⭐ Read 206+ reviews from our customers who used BADVIN to avoid buying junk vehicles.
Historical Records
events
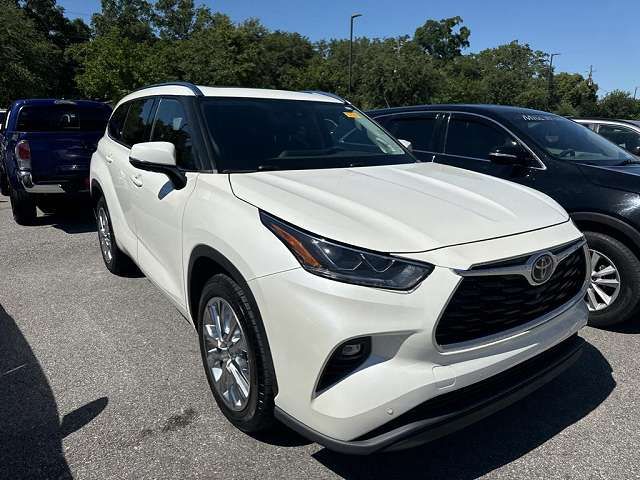
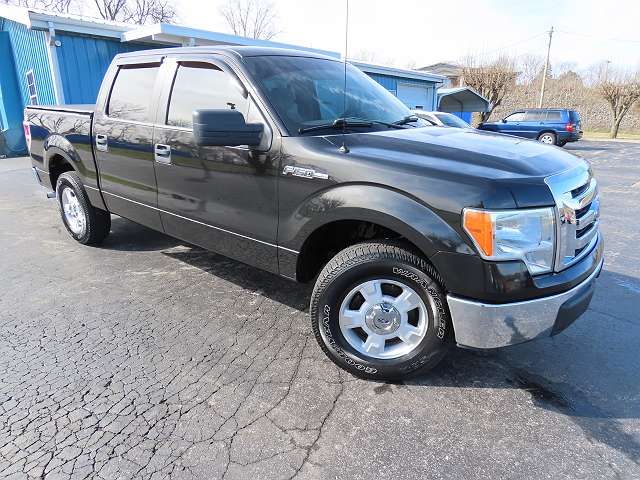
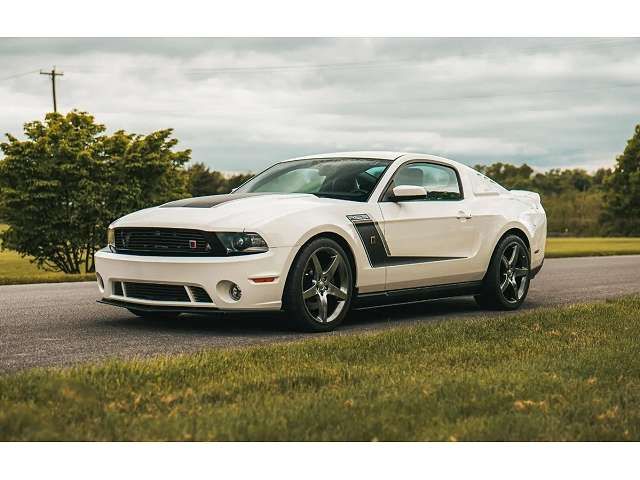
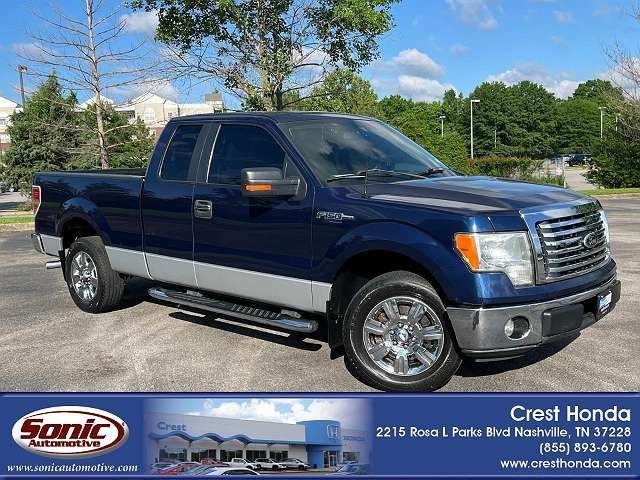
Photos
10 images
Sales History
1 records
Sale Prices
1 records
Market report
Price analytics
Historical Records
Historical records may include service and maintenance records, title status (clean, junk, salvage), insurance records, number of owners, registration events and states, and other information.
You can find more information about historical records in BADVIN reports and see more examples here.
Available historical records for VIN 5TDDZRFH5HS405563
Latest reported mileage: 684 mi
Below you can see some examples of what these records could look like.
2023-10-06
9 months ago
138,486 mi
REBUILT TITLE ISSUED
2022-08-01
2 years ago
9,498 mi
Duplicate title issued
REBUILT TITLE ISSUED
REBUILT TITLE ISSUED
2019-12-18
5 years ago
42,091 mi
TOTAL LOSS VEHICLE
Collision damage reported
Collision damage reported
| Year | 2017 |
| ODO | 5495 mi |
| Condition | Hidden text |
| Seller | Hidden text |
| Location | Laurel, MT, 59044 |
| Date | appeared 3 years ago latest price $6795 |
| Sale Website Type | classifieds |
sale information provided by user #620607


All photos above are REAL and display ACTUAL car. After you get the report you will see full resolution photos.
Tech Specs
| Body Style | SUV |
| Transmission | Automatic |
| Engine | 3.5 L |
| Cylinders | 6 Cyl |
| Drive | AWD |
| Fuel Type | Gasoline |
Model Analytics & Market Report
We've analyzed more than 121,600 sales records of this model and here are some numbers.
The average price for new (MSRP) 2017 TOYOTA HIGHLANDER in 2017 was $41,405.
The average price for used 2017 TOYOTA HIGHLANDER nowadays in 2024 is $24,990 which is 60% from the original price.
Estimated mileage driven per year is 11,461 miles.
For this model we also have depreciation curve, photos, list of features and options, and other analytics.
Take a look at 2017 TOYOTA HIGHLANDER model page in BADVIN vehicles catalog.
Depreciation
The graph below is a depreciation curve for 2017 TOYOTA HIGHLANDER. It shows how much this model looses per year in price. This analytics is calculated using sales records from BADVIN database.
The table below shows average price for used 2017 TOYOTA HIGHLANDER in each year since the year of manufacturing, current year price and projected price in the future years.
You can scroll the table horizontally to see all columns.
| Year | Average Mileage | Average Price | % Left | % Lost | ||
|---|---|---|---|---|---|---|
| 2017 MSRP | 0 mi | $41,405 | — | — | 100% | 0% |
| 2017 | 11,461 mi | $47,195 | −$5,790 | −13.98% | 113.98% | -13.98% |
| 2018 | 22,922 mi | $39,900 | +$7,295 | +15.46% | 96.37% | 3.63% |
| 2019 | 34,383 mi | $37,499 | +$2,401 | +6.02% | 90.57% | 9.43% |
| 2020 | 45,844 mi | $35,508 | +$1,991 | +5.31% | 85.76% | 14.24% |
| 2021 | 57,305 mi | $33,452 | +$2,056 | +5.79% | 80.79% | 19.21% |
| → Visit 2017 TOYOTA HIGHLANDER depreciation page to see full data. | ||||||
Price vs Mileage
The graph below shows how mileage affects the price for 2017 TOYOTA HIGHLANDER. This data was calculated using sales records from BADVIN database.
The table below shows average price for used 2017 TOYOTA HIGHLANDER by mileage and number of sales.
You can scroll the table horizontally to see all columns.
| Mileage | Average Price | Sample Size |
|---|---|---|
| 10,000 mi | $32,299 | 14 sales |
| 15,000 mi | $30,200 | 27 sales |
| 20,000 mi | $31,682 | 30 sales |
| 25,000 mi | $30,408 | 57 sales |
| 30,000 mi | $29,998 | 111 sales |
| 35,000 mi | $30,394 | 130 sales |
| → Visit 2017 TOYOTA HIGHLANDER depreciation page to see full data. | ||
Get FULL ACCESS to the vehicle history report and see all blurred info.
⭐ Read 206+ reviews from our customers who used BADVIN to avoid buying junk vehicles.
Testimonials from our customers
Ich hätte fast einen 2017 Mercedes-Benz C300 gekauft, bis der Bad Vin-Bericht zeigte, dass er als durch Überschwemmung beschädigt gemeldet wurde. Die detaillierten Schadensaufzeichnungen haben mich vor einem großen Fehler bewahrt!

Sophia Müller
verified on Trustpilot
After a bad experience buying a used car that turned out to have major issues, I now use Bad VIN to thoroughly check every vehicle i consider. It costs a bit more than other services but the detailed records and photos of past sales are wotrh it for the added peace of mind.
Olivia Johnson
verified on Trustpilot
I've tried a bunch of different vehicle history reports over the years and badvin.org has been the most comprehensive by far. Stuff like service records, ownership history, lien and repo info that I haven't found elsewhere. Def go-to resource when shopping for used vehicles now.
Levi Johnson
verified on Trustpilot
Bad Vin's vehicle history report showed that the 2018 Audi A4 I was about to buy had been in a major accident that was not disclosed by the seller. The severity analysis helped me avoid a bad purchase. Great service!
Sophie Dubois
verified on Trustpilot
Compare to other 2017 TOYOTA HIGHLANDER


Other vehicles sales records


Frequently asked questions
Yes, the Monroney label typically lists the exterior color and interior options of the vehicle, providing buyers with specifics about the vehicle’s appearance and styling.
Safety ratings on the Monroney label include crash test results from agencies like the NHTSA and IIHS, providing an assessment of the vehicle's safety.
Gray market status, if noted, indicates the 2017 TOYOTA was imported outside official channels, potentially affecting its compliance with local regulations and parts availability.
Yes, the fuel type of a vehicle is listed on the window sticker, providing important information for buyers about whether the car operates on gasoline, diesel, electricity, or hybrid technology.
While a VIN decoder can provide the model year that can suggest warranty status, verifying the actual warranty status usually requires direct contact with the manufacturer or dealer.
Yes, by law, all new 2017 TOYOTA vehicles are required to display a Monroney label to provide clear pricing and feature information to consumers.
A 2017 TOYOTA HIGHLANDER window sticker includes information such as MSRP, fuel efficiency, safety ratings, and optional equipment.


