
BADVIN vehicle history report for
2000 TOYOTA TUNDRAVIN: 5TBBT4415YS005772
Get FULL ACCESS to the vehicle history report and see all blurred info.
⭐ Read 206+ reviews from our customers who used BADVIN to avoid buying junk vehicles.
Historical Records
events
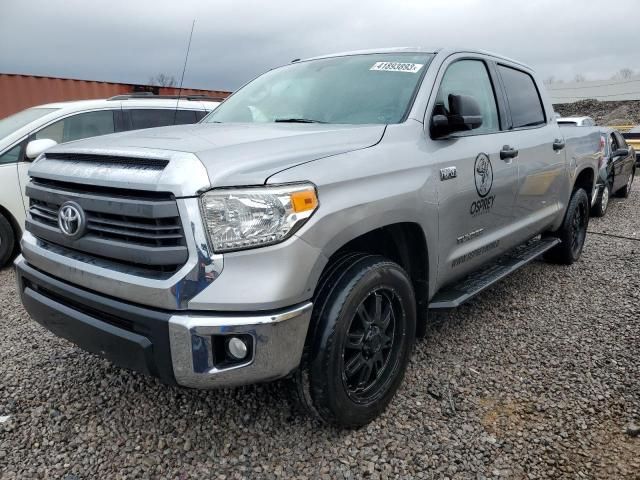
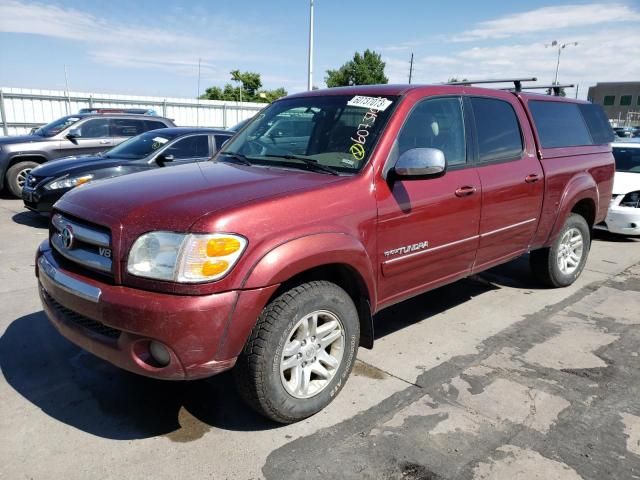
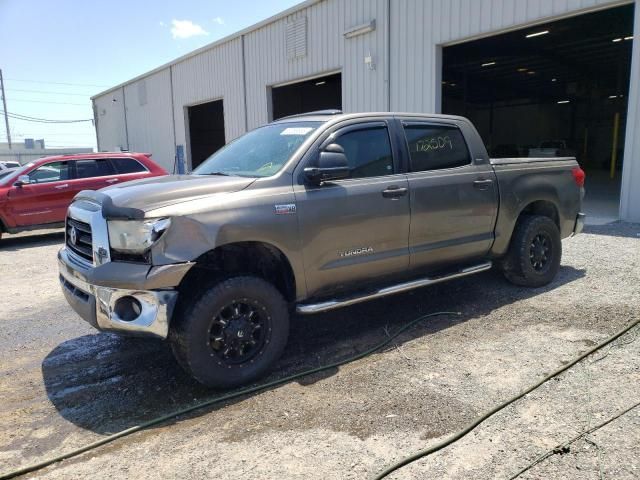
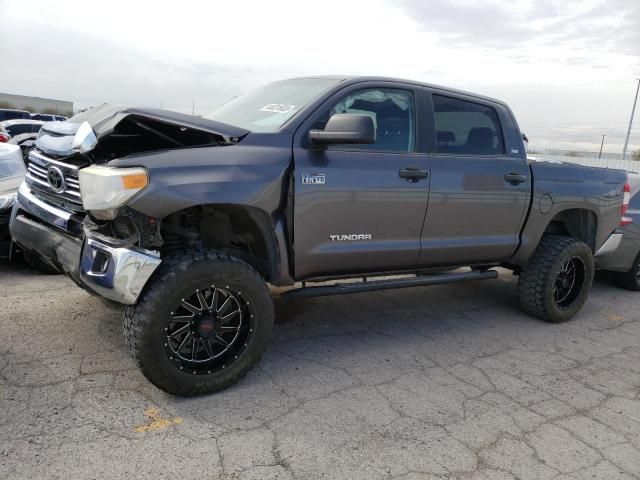
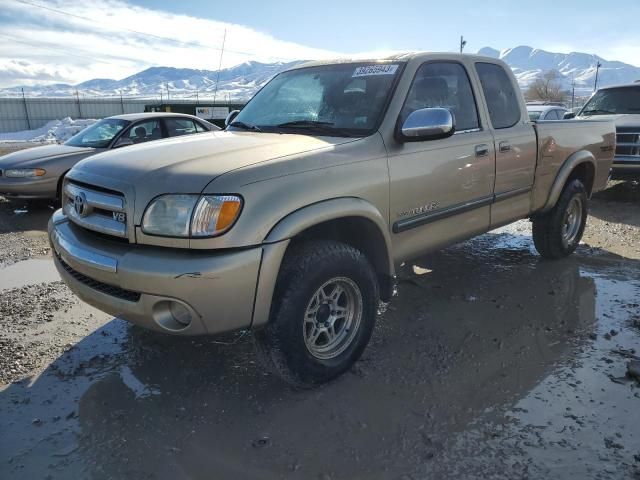
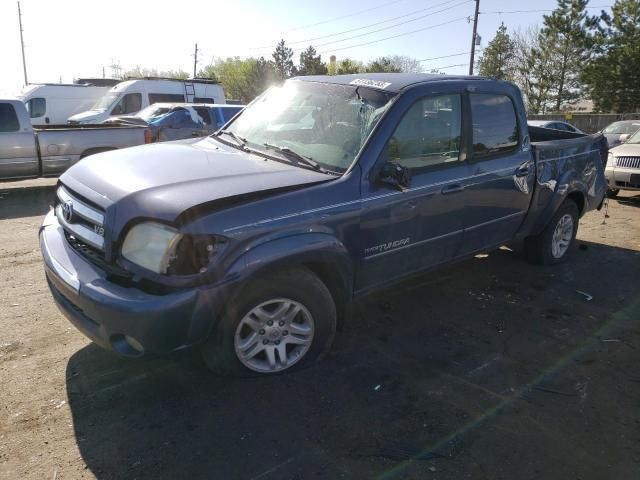
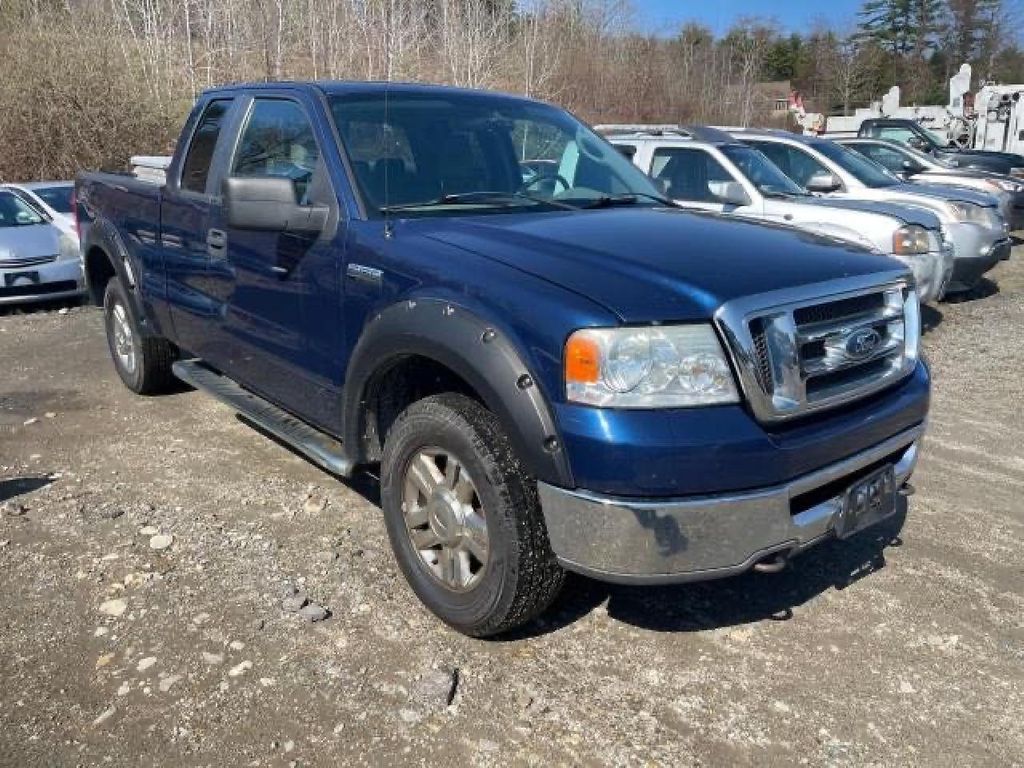
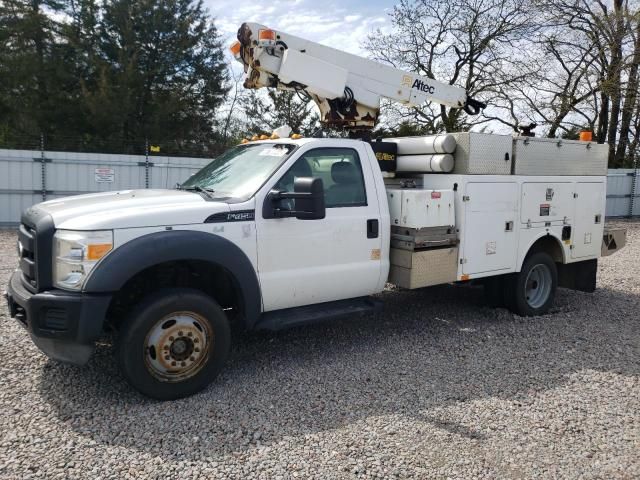
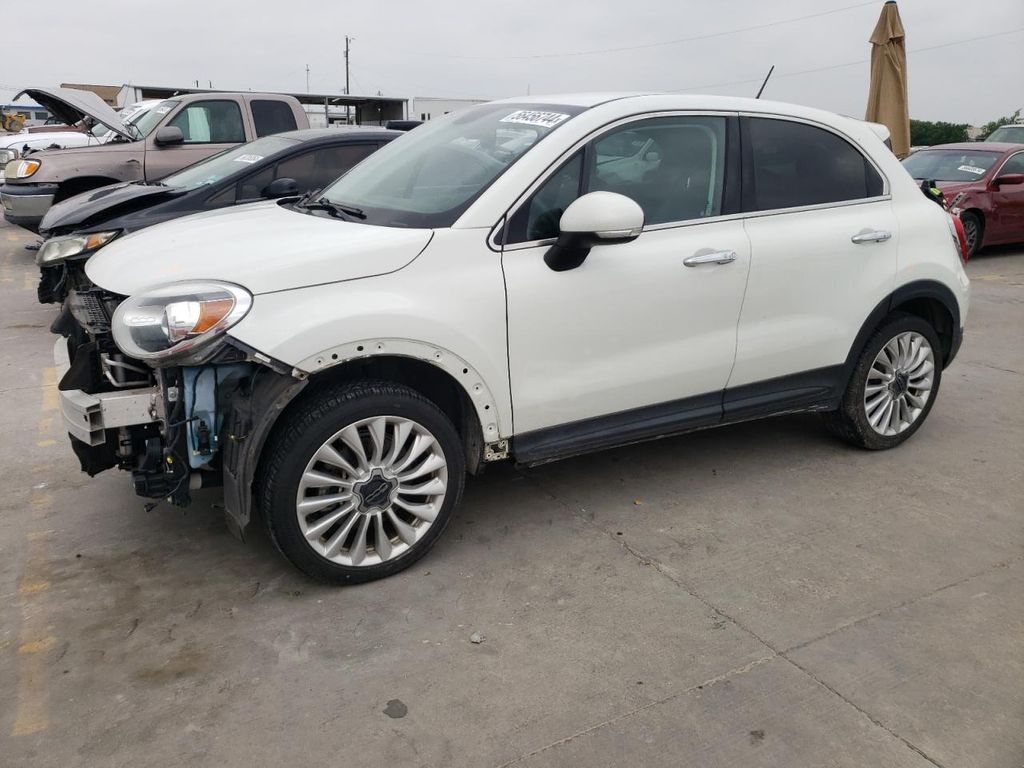
Photos
19 images
Sales History
2 records
Sale Prices
1 records
Market report
Price analytics
Historical Records
Historical records may include service and maintenance records, title status (clean, junk, salvage), insurance records, number of owners, registration events and states, and other information.
You can find more information about historical records in BADVIN reports and see more examples here.
Available historical records for VIN 5TBBT4415YS005772
Latest reported mileage: 392 mi
Below you can see some examples of what these records could look like.
2023-05-30
a year ago
32,744 mi
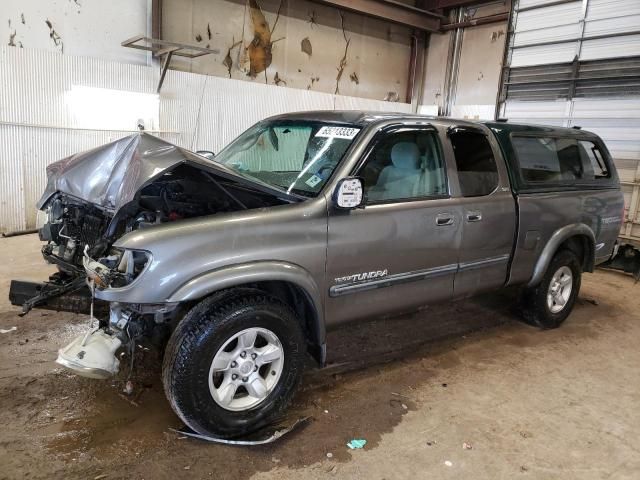
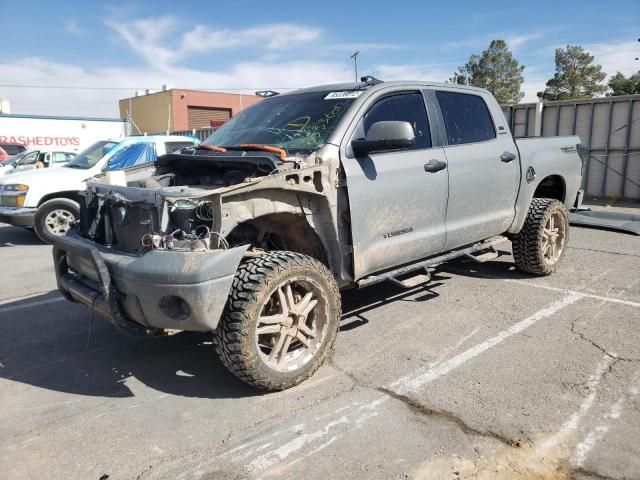
TOTAL LOSS VEHICLE
Collision damage reported
Collision damage reported
2021-12-14
3 years ago
19,841 mi
Vehicle serviced
Maintenance inspection completed
Maintenance inspection completed
2020-11-19
4 years ago
43,252 mi
NOT ACTUAL MILEAGE TITLE ISSUED
Titled or registered as lease vehicle
Titled or registered as lease vehicle
Sale Record
2000 TOYOTA TUNDRA ACCESS CAB
sold
| Year | 2000 |
| Title | Hidden text (Hidden text) |
| ODO | 7559 mi (Hidden text) |
| Damage | Hidden text |
| Estimated Retail Value | $3123 |
| Estimated Repair Cost | $7486 (834%) |
| Seller | Hidden text |
| Location | DENVER CENTRAL, CO, 80202 |
| Date | ended 3 years ago |
| Sale Website Type | salvage or insurance auction |
sale information provided by user #430230


All photos above are REAL and display ACTUAL car. After you get the report you will see full resolution photos.
Tech Specs
| Color | BLACK |
| Transmission | AUTOMATIC |
| Engine | 4.7L 8 |
| Drive | 4x4 w/Rear Wheel Drv |
| Fuel Type | GAS |
Model Analytics & Market Report
We've analyzed more than 3,900 sales records of this model and here are some numbers.
The average price for new (MSRP) 2000 TOYOTA TUNDRA in 2000 was $50,857.
The average price for used 2000 TOYOTA TUNDRA nowadays in 2024 is $8,997 which is 18% from the original price.
Estimated mileage driven per year is 11,272 miles.
For this model we also have depreciation curve, photos, list of features and options, and other analytics.
Take a look at 2000 TOYOTA TUNDRA model page in BADVIN vehicles catalog.
Depreciation
The graph below is a depreciation curve for 2000 TOYOTA TUNDRA. It shows how much this model looses per year in price. This analytics is calculated using sales records from BADVIN database.
The table below shows average price for used 2000 TOYOTA TUNDRA in each year since the year of manufacturing, current year price and projected price in the future years.
You can scroll the table horizontally to see all columns.
| Year | Average Mileage | Average Price | % Left | % Lost | ||
|---|---|---|---|---|---|---|
| 2000 MSRP | 0 mi | $50,857 | — | — | 100% | 0% |
| 2000 | 11,272 mi | $59,999 | −$9,142 | −17.98% | 117.98% | -17.98% |
| 2001 | 22,544 mi | $56,989 | +$3,010 | +5.02% | 112.06% | -12.06% |
| 2002 | 33,816 mi | $48,974 | +$8,015 | +14.06% | 96.3% | 3.7% |
| 2003 | 45,088 mi | $42,729 | +$6,245 | +12.75% | 84.02% | 15.98% |
| 2004 | 56,360 mi | $40,764 | +$1,965 | +4.6% | 80.15% | 19.85% |
| → Visit 2000 TOYOTA TUNDRA depreciation page to see full data. | ||||||
Price vs Mileage
The graph below shows how mileage affects the price for 2000 TOYOTA TUNDRA. This data was calculated using sales records from BADVIN database.
The table below shows average price for used 2000 TOYOTA TUNDRA by mileage and number of sales.
You can scroll the table horizontally to see all columns.
| Mileage | Average Price | Sample Size |
|---|---|---|
| 55,000 mi | $14,991 | 19 sales |
| 70,000 mi | $13,000 | 23 sales |
| 75,000 mi | $11,799 | 13 sales |
| 80,000 mi | $14,995 | 33 sales |
| 85,000 mi | $10,900 | 33 sales |
| 90,000 mi | $12,990 | 47 sales |
| → Visit 2000 TOYOTA TUNDRA depreciation page to see full data. | ||
Get FULL ACCESS to the vehicle history report and see all blurred info.
⭐ Read 206+ reviews from our customers who used BADVIN to avoid buying junk vehicles.
Testimonials from our customers
Was shopping for a used Range Rover and found one that seemed suspiciously cheap. The badVIN report revealed it had been in a major front end collision, with photos showing the damage. Steered clear of that one and saved myself a ton of headaches!!

Ava Patel
verified on Trustpilot
As a car dealer importing vehicles from the US to Mexico, I rely on badvin for comprehensive history reports before bidding at auctions. Their info has helped me avoid several salvage vehicles and is more thorough than carfax. A must-have service!
Javier Ramirez
verified on Trustpilot
As a broke college kid I almost settled for a sketchy 2005 Altima cuz it was cheap. but splurged on the report from badvin 1st. soooo glad I did - turned out it had been totalled and rebuilt. spending a little saved me from wasting $1000s!
Sophie
verified on Trustpilot
I've tried many vehicle reports but badvin's is by far the most comprehensive. It shows accident photos, past sales, repairs and so much more. I won't buy a car now without getting a report first. It's a must-have.
Alexander Hunt
verified on Trustpilot
Compare to other 2000 TOYOTA TUNDRA
2016 TOYOTA TUNDRA CREWMAX
a month ago, 96,247 mi
est retail value $30,999
buy now price $10,900
VIN 5TFDY5F13GX532111
2004 TOYOTA TUNDRA
21 days ago, 127,894 mi
est retail value $15,973
buy now price $1,225
VIN 5TBDT44104S439603
Other vehicles sales records


2022 GMC TERRAIN
in 3 days, 18,811 mi
est retail value $23,838
buy now price $3,900
VIN 3GKALMEV5NL285767

2012 FORD F450
8 days ago, 224,953 mi
est retail value $19,340
buy now price $1,600
VIN 1FDUF4HY2CED10705

2011 TOYOTA PRIUS
in 2 days, 260,828 mi
est retail value $8,862
buy now price $3,500
VIN JTDKN3DU6B0309435


Frequently asked questions
Safety ratings on the Monroney label include crash test results from agencies like the NHTSA and IIHS, providing an assessment of the vehicle's safety.
A VIN alone does not typically provide fuel economy details directly; however, it can identify the vehicle model and engine type, which you can cross-reference with fuel economy data from other sources.
Aftermarket modifications can affect the depreciation of 2000 TOYOTA TUNDRA either positively, by enhancing appeal to certain buyers, or negatively, by deterring those who prefer stock condition.
Our reports may include photos from previous sales, offering a visual history that helps assess the 2000 TOYOTA vehicle’s condition over time, if such photos are available.
You can use a Monroney label to compare different 2000 TOYOTA models by reviewing their features, fuel economy, safety equipment, and pricing directly on the sticker.
You can verify the authenticity of a window sticker on a new car by checking that it includes official data from the manufacturer and matches the vehicle’s VIN and specifications.
Depreciation directly affects the resale value of a 2000 TOYOTA TUNDRA, with faster depreciating vehicles typically having lower resale values over time.
Hail damage, if noted, is detailed with specifics on the impact to the body and glass, which can affect the aesthetic and structural integrity of the 2000 TOYOTA.
Sales descriptions may provide detailed narratives of the 2000 TOYOTA vehicle’s features and condition at the time of each sale, highlighting potential changes and upgrades, depending on available data.
New vehicles often depreciate quickly due to rapid advancements in technology and consumer preference for the latest features, which make older models less desirable.


