
BADVIN vehicle history report for
2013 TOYOTA CAMRYVIN: 4T1BK1FK2DU530109
Get FULL ACCESS to the vehicle history report and see all blurred info.
⭐ Read 206+ reviews from our customers who used BADVIN to avoid buying junk vehicles.
Historical Records
events
Photos
12 images
Sales History
1 records
Sale Prices
2 records
Market report
Price analytics
Historical Records
Historical records may include service and maintenance records, title status (clean, junk, salvage), insurance records, number of owners, registration events and states, and other information.
You can find more information about historical records in BADVIN reports and see more examples here.
Available historical records for VIN 4T1BK1FK2DU530109
Latest reported mileage: 786 mi
Below you can see some examples of what these records could look like.
2023-08-06
10 months ago
48,969 mi
SALVAGE TITLE/CERTIFICATE ISSUED
2022-02-05
2 years ago
20,980 mi
Damage reported: minor to moderate damage
Damage to right rear
Damage to rear
Damage to right rear
Damage to rear
2020-10-19
4 years ago
30,111 mi
New owner reported
REBUILT TITLE ISSUED
REBUILT TITLE ISSUED
2013 Toyota Camry FWD 3.5 6cyl. Gasoline
| Year | 2013 |
| ODO | 2860 mi (Hidden text) |
| Location | Little Rock, AR, 72210 |
| Date | ended 3 years ago sold for $8633 |
| Sale Website Type | dealer auction |
| Notes | |
| Hidden text | |
sale information provided by user #817679

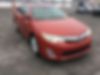

All photos above are REAL and display ACTUAL car. After you get the report you will see full resolution photos.
Tech Specs
| Color | RED |
| Color (Interior) | TAN |
| Transmission | Automatic |
| Cylinders | 6 |
| Drive | FWD |
| Fuel Type | Gasoline |
Standard Features
All these features are based on a model in general. This specific vehicle may differ.
- Key - Ignition - 1
Model Analytics & Market Report
We've analyzed more than 58,800 sales records of this model and here are some numbers.
The average price for new (MSRP) 2013 TOYOTA CAMRY in 2013 was $27,765.
The average price for used 2013 TOYOTA CAMRY nowadays in 2024 is $12,987 which is 47% from the original price.
Estimated mileage driven per year is 9,684 miles.
For this model we also have depreciation curve, photos, list of features and options, and other analytics.
Take a look at 2013 TOYOTA CAMRY model page in BADVIN vehicles catalog.
Depreciation
The graph below is a depreciation curve for 2013 TOYOTA CAMRY. It shows how much this model looses per year in price. This analytics is calculated using sales records from BADVIN database.
The table below shows average price for used 2013 TOYOTA CAMRY in each year since the year of manufacturing, current year price and projected price in the future years.
You can scroll the table horizontally to see all columns.
| Year | Average Mileage | Average Price | % Left | % Lost | ||
|---|---|---|---|---|---|---|
| 2013 MSRP | 0 mi | $27,765 | — | — | 100% | 0% |
| 2013 | 9,684 mi | $28,990 | −$1,225 | −4.41% | 104.41% | -4.41% |
| 2014 | 19,368 mi | $25,949 | +$3,041 | +10.49% | 93.46% | 6.54% |
| 2015 | 29,052 mi | $24,900 | +$1,049 | +4.04% | 89.68% | 10.32% |
| 2016 | 38,736 mi | $23,726 | +$1,174 | +4.71% | 85.45% | 14.55% |
| 2017 | 48,420 mi | $22,910 | +$816 | +3.44% | 82.51% | 17.49% |
| → Visit 2013 TOYOTA CAMRY depreciation page to see full data. | ||||||
Price vs Mileage
The graph below shows how mileage affects the price for 2013 TOYOTA CAMRY. This data was calculated using sales records from BADVIN database.
The table below shows average price for used 2013 TOYOTA CAMRY by mileage and number of sales.
You can scroll the table horizontally to see all columns.
| Mileage | Average Price | Sample Size |
|---|---|---|
| 10,000 mi | $20,985 | 11 sales |
| 15,000 mi | $17,992 | 21 sales |
| 20,000 mi | $19,195 | 17 sales |
| 25,000 mi | $18,963 | 32 sales |
| 30,000 mi | $17,182 | 49 sales |
| 35,000 mi | $17,581 | 74 sales |
| → Visit 2013 TOYOTA CAMRY depreciation page to see full data. | ||
Get FULL ACCESS to the vehicle history report and see all blurred info.
⭐ Read 206+ reviews from our customers who used BADVIN to avoid buying junk vehicles.
Testimonials from our customers
I almost bought a 2019 Malibu that seemed like a great deal - low miles and price. But the badvin report showed it used to be a rental fleet vehicle, which the seller didn't disclose. Glad I found out before buying someone else's abused rental!

Benjamin Torres
verified on Trustpilot
I buy rebuilt title cars at copart to fix and resell. was hoping BadVin reports wud have more detail on damage history to help me value cars before bidding, Carfax is better for that. but for clean title vehicles it seems pretty useful
Fatima
verified on Trustpilot
Was shopping for a used Range Rover and found one that seemed suspiciously cheap. The badVIN report revealed it had been in a major front end collision, with photos showing the damage. Steered clear of that one and saved myself a ton of headaches!!
Ava Patel
verified on Trustpilot
Purchased a badvin report before buying a used Lexus RX 350. It revealed a minor accident the seller hadn't mentioned. I still bought the car but used the info to negotiate a lower price. Well worth the cost for the leverage it gave me!
Aiden Patel
verified on Trustpilot
Frequently asked questions
Yes, in many cases, you can determine the type of drivetrain a 2013 TOYOTA CAMRY has from its VIN if the manufacturer encodes this information within the VIN.
Sales prices from past transactions may be documented in our reports, providing a price history that aids in determining current market value, if such data is available.
A salvage title generally indicates that the vehicle was declared a total loss by an insurance company due to severe damage from an accident, flood, or other causes, if such information is recorded.
Aftermarket modifications can affect the depreciation of 2013 TOYOTA CAMRY either positively, by enhancing appeal to certain buyers, or negatively, by deterring those who prefer stock condition.
Vehicle history reports may provide detailed information about the number of previous owners of a vehicle, depending on the completeness of the records.
The average depreciation rate for vehicles over five years can vary, but many models experience a significant portion of their depreciation within the first few years of ownership.
The market value of a vehicle is calculated based on its historical depreciation trends, current condition, mileage, and market trends.


