
BADVIN vehicle history report for
2017 FORD FUSIONVIN: 3FA6P0UU1HR226732
Get FULL ACCESS to the vehicle history report and see all blurred info.
⭐ Read 206+ reviews from our customers who used BADVIN to avoid buying junk vehicles.
Historical Records
events
Window Sticker
PDF found
Photos
13 images
Sales History
2 records
Sale Prices
3 records
Market report
Price analytics
Historical Records
Historical records may include service and maintenance records, title status (clean, junk, salvage), insurance records, number of owners, registration events and states, and other information.
You can find more information about historical records in BADVIN reports and see more examples here.
Available historical records for VIN 3FA6P0UU1HR226732
Latest reported mileage: 605 mi
Below you can see some examples of what these records could look like.
2023-08-08
10 months ago
52,444 mi
Vehicle sold
MILEAGE INCONSISTENCY
MILEAGE INCONSISTENCY
2022-07-27
2 years ago
17,953 mi
Damage reported
Damage to front
Damage to front
2020-10-21
4 years ago
40,876 mi
Duplicate title issued
REBUILT TITLE ISSUED
REBUILT TITLE ISSUED
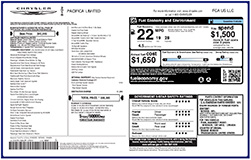
Window Sticker
A PDF of a window sticker is available for VIN 3FA6P0UU1HR226732.
Also called Monroney label, it's a label required in the United States to be displayed in all new automobiles.
It may include certain official information about the car such as:
- Manufacturer's Suggested Retail Price (MSRP)
- Engine and Transmission Specifications
- Equipment, Packages, and Extra Features
- Fuel Economy Rating
- Other Information
Read more about window stickers and see some examples here.
| Year | 2017 |
| ODO | 1545 mi |
| Seller | Hidden text (Hidden text) |
| Location | Palm Coast, FL, 32137 |
| Date | appeared 2 years ago latest price $2140 sale post disappeared 2020-06-23 |
| Sale Website Type | classifieds |
| Notes | |
| Hidden text | |
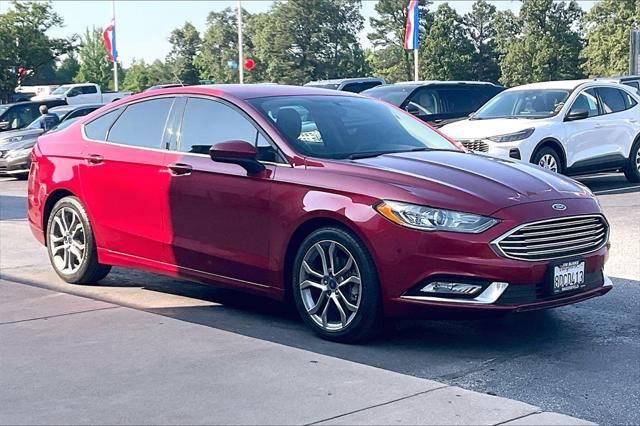
sale information provided by user #963928

All photos above are REAL and display ACTUAL car. After you get the report you will see full resolution photos.
Tech Specs
| Body Style | Sedan |
| Color | MAGNETIC METALLIC |
| Transmission | AUTOMATIC CVT |
| Engine | 2.0L IVCT I4 HEV |
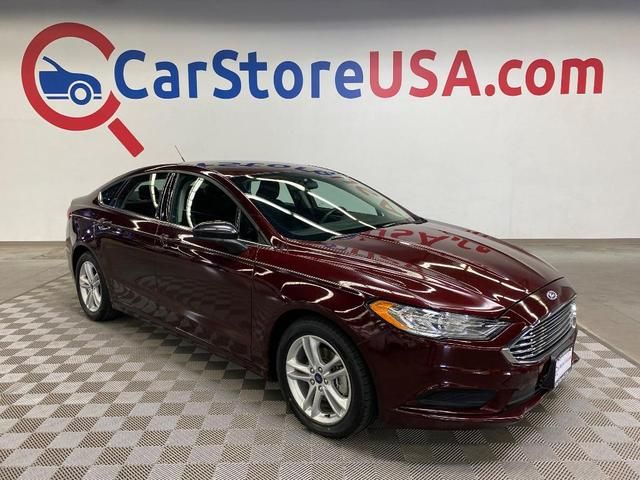
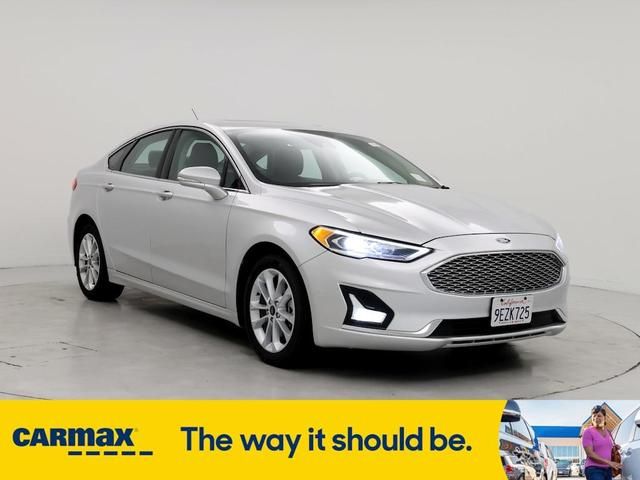
2017 Ford Fusion Hybrid S FWD
| Year | 2017 |
| ODO | 5999 mi |
| Seller | Hidden text |
| Location | Tampa, FL, 33619 |
| Date | ended 4 years ago sold for $9289 |
| Sale Website Type | dealer auction |
sale information provided by user #942737


All photos above are REAL and display ACTUAL car. After you get the report you will see full resolution photos.
Tech Specs
| Color | Gray |
| Color (Interior) | Gray |
| Transmission | Automatic |
| Engine | 4 Cylinder |
| Drive | 2 Wheel Drive |
| Fuel Type | Hybrid |
Standard Features
All these features are based on a model in general. This specific vehicle may differ.
- A/C
- Hidden text
- CVT Transmission
- Hidden text
- 4 Cylinder Engine
- Hidden text
- Bluetooth Connection
- Hidden text
- Driver Adjustable Lumbar
- Hidden text
- Hard Top
- Hidden text
- A/T
- Hidden text
- CD Player
- Hidden text
- Driver Vanity Mirror
- Hidden text
- Keyless Start
- Hidden text
- Power Mirror(s)
- Hidden text
- Steering Wheel Audio Controls
- Hidden text
- AM/FM Stereo
- Hidden text
- Brake Assist
- Hidden text
- Driver Air Bag
- Hidden text
- Intermittent Wipers
- Hidden text
- Passenger Vanity Mirror
- Hidden text
- Smart Device Integration
- Hidden text
- ABS
- Hidden text
- Bucket Seats
- Hidden text
- Driver Illuminated Vanity Mirror
- Hidden text
- Keyless Entry
- Hidden text
- Power Windows
- Hidden text
- Tire Pressure Monitor
- Hidden text
- Power Door Locks
- Hidden text
- Stability Control
- Hidden text
- Engine Immobilizer
- Hidden text
- Knee Air Bag
- Hidden text
- Power Steering
- Hidden text
- Telematics
Model Analytics & Market Report
We've analyzed more than 207,300 sales records of this model and here are some numbers.
The average price for new (MSRP) 2017 FORD FUSION in 2017 was $26,590.
The average price for used 2017 FORD FUSION nowadays in 2024 is $13,998 which is 53% from the original price.
Estimated mileage driven per year is 11,273 miles.
For this model we also have depreciation curve, photos, list of features and options, and other analytics.
Take a look at 2017 FORD FUSION model page in BADVIN vehicles catalog.
Depreciation
The graph below is a depreciation curve for 2017 FORD FUSION. It shows how much this model looses per year in price. This analytics is calculated using sales records from BADVIN database.
The table below shows average price for used 2017 FORD FUSION in each year since the year of manufacturing, current year price and projected price in the future years.
You can scroll the table horizontally to see all columns.
| Year | Average Mileage | Average Price | % Left | % Lost | ||
|---|---|---|---|---|---|---|
| 2017 MSRP | 0 mi | $26,590 | — | — | 100% | 0% |
| 2021 | 56,365 mi | $18,649 | +$0 | +0% | 70.14% | 29.86% |
| → Visit 2017 FORD FUSION depreciation page to see full data. | ||||||
Price vs Mileage
The graph below shows how mileage affects the price for 2017 FORD FUSION. This data was calculated using sales records from BADVIN database.
The table below shows average price for used 2017 FORD FUSION by mileage and number of sales.
You can scroll the table horizontally to see all columns.
| Mileage | Average Price | Sample Size |
|---|---|---|
| 10,000 mi | $17,700 | 11 sales |
| 15,000 mi | $18,990 | 15 sales |
| 20,000 mi | $16,997 | 27 sales |
| 25,000 mi | $17,750 | 40 sales |
| 30,000 mi | $16,934 | 63 sales |
| 35,000 mi | $16,988 | 72 sales |
| → Visit 2017 FORD FUSION depreciation page to see full data. | ||
Get FULL ACCESS to the vehicle history report and see all blurred info.
⭐ Read 206+ reviews from our customers who used BADVIN to avoid buying junk vehicles.
Testimonials from our customers
As a used car dealer, I rely on badvin.org for checking every vehicle I'm considering purchasing at auction. The comprehensive reports give me peace of mind and help me avoid problem cars. Photos of past sales have saved me from overpaying many times. Worth every penny!

Misha
verified on Trustpilot
Was shopping for a used Range Rover and found one that seemed suspiciously cheap. The badVIN report revealed it had been in a major front end collision, with photos showing the damage. Steered clear of that one and saved myself a ton of headaches!!
Ava Patel
verified on Trustpilot
I almost bought a 2019 Malibu that seemed like a great deal - low miles and price. But the badvin report showed it used to be a rental fleet vehicle, which the seller didn't disclose. Glad I found out before buying someone else's abused rental!
Benjamin Torres
verified on Trustpilot
Purchased a badvin report before buying a used Lexus RX 350. It revealed a minor accident the seller hadn't mentioned. I still bought the car but used the info to negotiate a lower price. Well worth the cost for the leverage it gave me!
Aiden Patel
verified on Trustpilot
Compare to other 2017 FORD FUSION


Other vehicles sales records


Frequently asked questions
Yes, the choice of vehicle color can impact the depreciation rate, with neutral colors typically being easier to sell and potentially holding their value better than more unconventional colors.
If available, auction photos may be included in our reports, providing a glimpse into the 2017 FORD vehicle’s condition and appearance at the time of sale.
Vehicle history reports may include records of theft and any recovery details if the vehicle was stolen and found, subject to data availability.
Safety ratings on the Monroney label include crash test results from agencies like the NHTSA and IIHS, providing an assessment of the vehicle's safety.
Yes, the window sticker can help you negotiate a better price on a new 2017 FORD FUSION by providing you with detailed pricing information and the cost of optional extras.
The average depreciation rate for vehicles over five years can vary, but many models experience a significant portion of their depreciation within the first few years of ownership.
Window stickers for luxury 2017 FORD models often include unique information such as high-end options, advanced technological features, and premium materials, reflecting the upscale positioning of these vehicles.
Yes, the window sticker for 2017 FORD vehicles includes warranty information, detailing the coverage for various components and the duration of the warranty.
Technology plays a significant role in the depreciation of vehicles, as models with outdated tech depreciate faster due to lower consumer demand for older features.


